


-
近岸海域与陆地毗连,受到来自陆地和海洋的双重作用,是各种系统相互作用相对活跃的地带,因其拥有丰富的生物多样性和人类生存资源,为人类生活提供了重要的生存环境,是海洋生态系统的重要基础[1]。浮游植物是海洋生态系统中最重要的组成部分,其种类组成的变化是反应水质污染的直接后果之一。同时,作为水域生态系统的初级生产者,它是太阳能转化为有机物里的化学能[2],启动了水域生态系统中的食物网[3]。由于人类活动对近岸海域的影响,导致近岸海域生态系统脆弱,引起一些有害的藻类丛生,从而导致赤潮的发生,严重危害人类健康和渔业资源,影响经济的发展[4]。因此,有必要对近岸海域中的浮游植物群落结构和水质进行调查研究,为该海域生态环境的保护提供基础资料。
陵水湾位于海南省陵水黎族自治县南部海岸,是一个近于封闭的天然港湾,其周围环抱群山,海湾宽阔,湾内无明显径流注入,地形地貌复杂,仅与湾外一个狭窄的潮汐汊道相通,是一个半封闭的沙坝 − 潮汐汊道 − 泻湖海岸体系[5],也是国家重点渔港之一。目前,有关陵水湾近岸海域浮游植物群落结构及水质状况的调查鲜有报道。因此,笔者于2019年春、秋两季分别对陵水湾近岸海域网采的浮游植物样本进行分析,旨在为陵水湾近岸海域生态系统保护提供基础资料。
-
参考《海洋调查规范》(GB 12763—2007)在陵水湾海域(109°32′06.85″~109°57′11.09″;18°14′03.28″~18°24′25.90″)设置12个站位,站位地理坐标见表1,各站位采样分布见图1。样品的采集和预处理工作按照《海洋调查规范第9部分:海洋生态调查指南》(GB 17378.7—007)的规定进行。样本由底到表层采用Ⅲ型浮游生物网垂直拖网采集样品至1 L标本瓶中,使用终浓度为φ=5%的甲醛固定样本后静置沉淀浓缩至50 mL。移液枪吸取0.1 mL浓缩样品置于CX41生物显微镜下进行种类鉴定和计数。采集地的电导率、气温、盐度、水温、透明度、pH、溶解氧、水深等指标均为现场测定。
表 1 陵水湾近岸海域浮游植物调查站位地理坐标
Table 1. Geographical coordinates of phytoplankton survey stations in the coastal waters of Lingshui Bay
站位 Station 经度 Longitude 纬度 Latitude 1-1 109°57′11.09″ 18°24′14.82″ 1-2 109°57′05.18″ 18°23′25.45″ 1-3 109°57′05.18″ 18°22′08.59″ 2-1 109°55′22.63″ 18°24′25.90″ 2-2 109°33′12.08″ 18°14′09.52″ 2-3 109°55′21.33″ 18°22′19.87″ 3-1 109°53′34.97″ 18°24′11.56″ 3-2 109°32′06.85″ 18°14′03.28″ 3-3 109°53′33.83″ 18°22′23.38″ 4-1 109°52′24.54″ 18°23′38.64″ 4-2 109°58′24.38″ 18°22′25.00″ 4-3 109°52′24.01″ 18°21′18.65″ 
图 1 陵水湾海域各采样点分布
Figure 1. Schematic diagram of the distribution of sampling points in Lingshui Bay
-
样本浓缩至50 mL,取0.1 mL于CX41生物显微镜下计数、鉴定。
Shannon-Wiener 多样性指数(H′)计算公式[6]:
$$H' = - \sum\limits_{i = 1}^S {{P_i}{{\log }_2}{P_i}}, $$ Pielou 均匀度指数(J)计算公式[7]:
$$J' = H'/\log 2S,$$ Margalef丰富度指数计算公式[8]:
$$D = (S - 1)/\ln N,$$ 优势种确定是由优势度决定的,计算公式[9]:
$${{Y}} = {f_i} \times {P_i},$$ 式中:H′为多样性指数;S为种类数;Pi=ni/N(ni是第i个物种的个体数,N是全部物种的个体数);fi为第i种在各个站位出现的频率,Pi为第i种占各个站位细胞总量的比例。
-
利用哈希 DR3900多参数水质检测仪检测采集海水的总氮、硝酸盐氮、总磷、亚硝酸盐氮、氨氮和COD的含量等指标,具体操作按实验说明进行。采用Canoco 5.0对浮游植物群落和各环境因子之间的关系进行关联分析。选择优势度前10的物种数据和环境数据进行lg(X+1)转换,去趋势对应分析(DCA)结果显示,选择冗余分析(RDA)较合理。
-
从表2可知,陵水湾调查期间春季平均水温为26.5 ℃,秋季平均水温为30.80 ℃。春、秋两季各调查站位的pH为8.10~8.32,平均pH值分别为8.29和8.23。春季平均电导率为21.49 μs·cm−1,秋季为23.90 μs·cm−1。春、秋两季海水盐度差异较明显,秋季盐度高于春季。春季溶解氧波动较大,平均为7.40 mg·L−1;秋季平均溶解氧为6.09 mg·L−1,且各站位溶解氧变化差异不大。
表 2 2019年春秋两季陵水湾各调查站位环境参数表
Table 2. Environmental parameters of survey sites in Lingshui Bay in the spring and autumn of 2019
样品编号
Sample code水温/℃ Sea water temperature pH 电导率/(μs·cm−1) Conductivity 盐度 Salinity 溶解氧DO/(mg·L−1) 春 秋 春 秋 春 秋 春 秋 春 秋 1-1 26.37 29.70 8.30 8.10 21.80 24.77 29.00 33.73 10.37 6.54 1-2 26.33 30.10 8.30 8.20 21.83 25.00 29.00 32.80 9.33 6.67 1-3 26.37 29.70 8.32 8.30 21.57 25.00 29.00 33.37 10.77 6.32 2-1 26.33 29.90 8.28 8.20 21.57 21.15 29.00 33.30 7.83 5.45 2-2 26.23 31.00 8.28 8.20 21.50 25.00 29.00 33.43 5.90 5.49 2-3 26.30 30.40 8.29 8.20 21.30 22.73 29.70 33.17 10.37 6.31 3-1 26.83 31.50 8.28 8.20 21.33 25.00 29.70 31.10 4.57 5.55 3-2 27.03 32.00 8.28 8.30 21.33 19.37 29.00 35.30 5.00 5.50 3-3 26.30 30.40 8.31 8.30 21.37 25.00 30.30 33.03 10.27 5.91 4-1 26.70 31.00 8.29 8.30 21.43 23.80 31.70 31.13 4.77 7.04 4-2 26.03 32.50 8.27 8.30 21.43 25.00 32.00 34.20 4.90 6.09 4-3 26.07 31.40 8.22 8.20 21.37 25.00 32.00 33.70 4.77 6.20 -
从图2可知,本次陵水湾调查海域所采集到的样品,春季共鉴定出浮游植物6门81种,秋季鉴定出3门53种。春季鉴定出硅藻门57种,秋季鉴定出硅藻门41种,分别占总种类数的70.37%和77.36%;春秋两季甲藻种类分别为17种和11种,均占总种类数的20%左右;春季鉴定出4种蓝藻门藻类,而秋季仅鉴定出1种;在秋季调查中,春季出现的黄藻门、金藻门和定鞭藻门种类未被鉴定出。
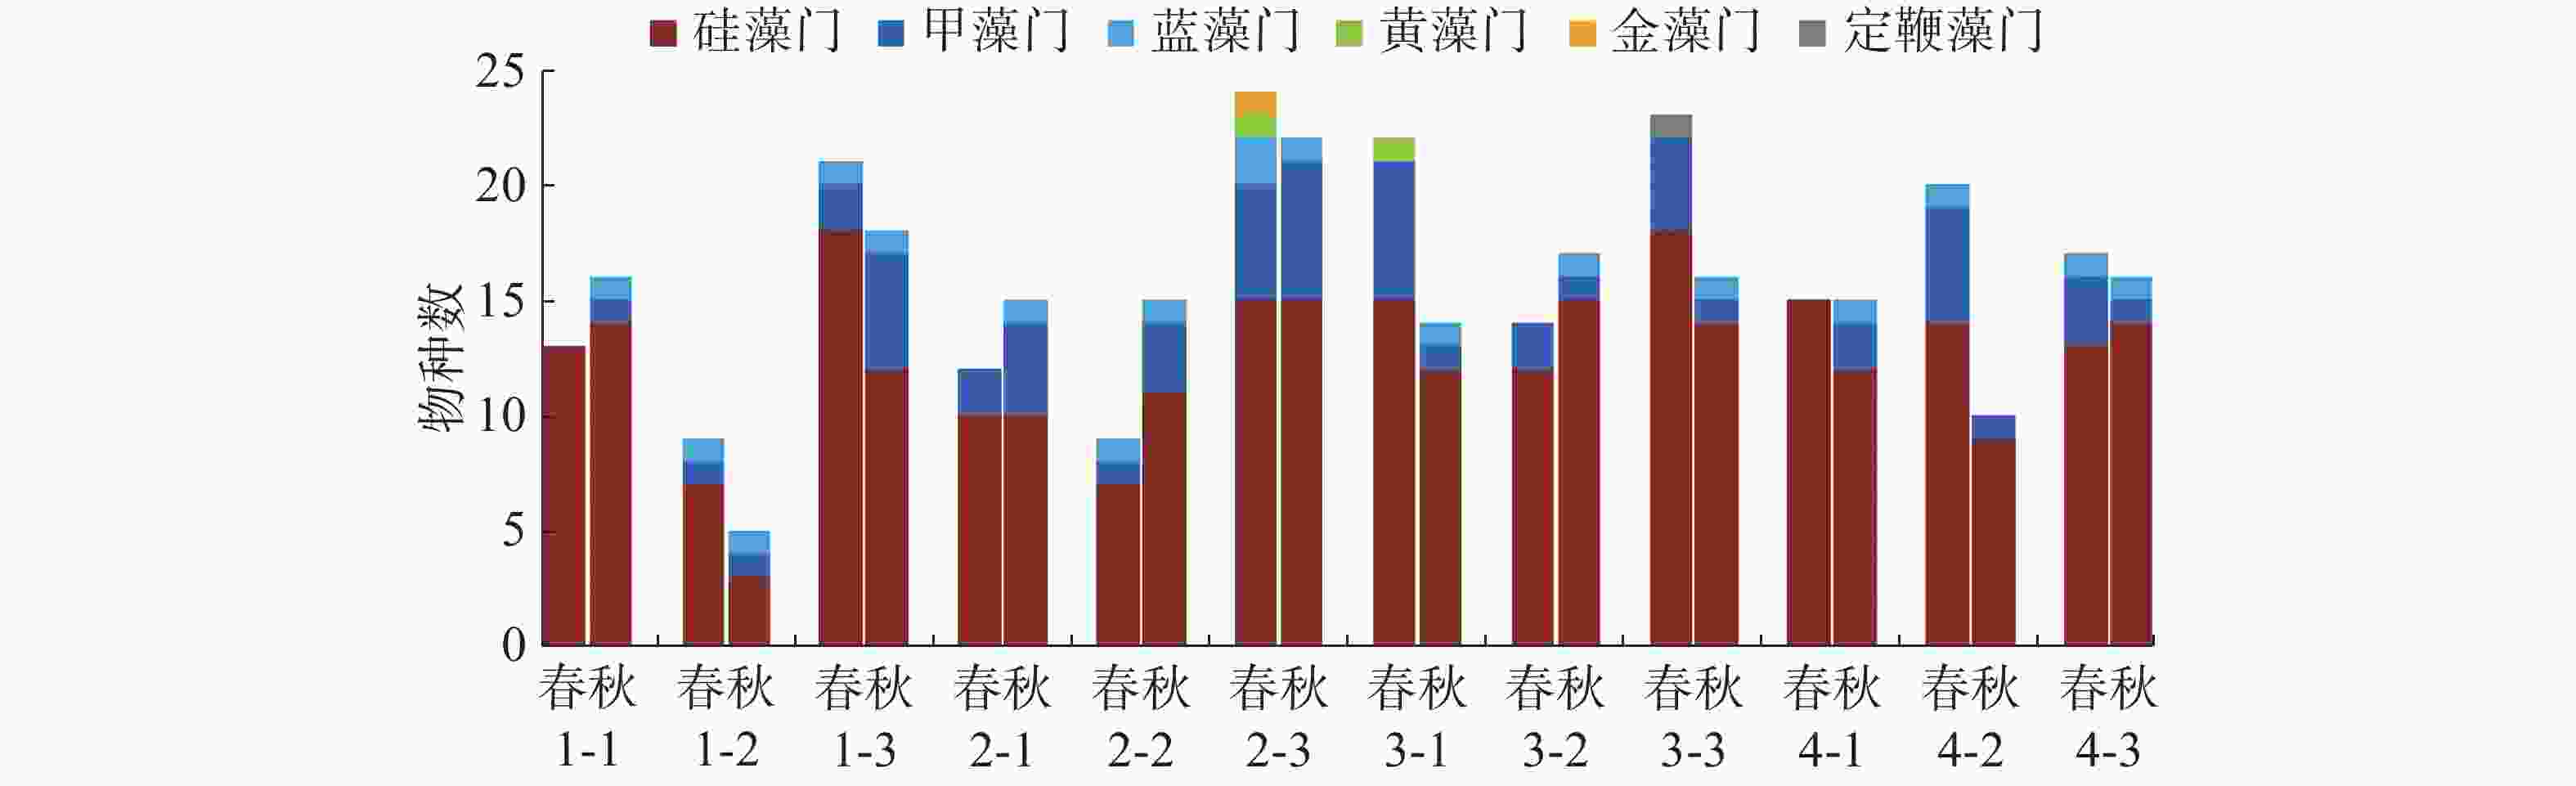
图 2 陵水湾2019年调查站位浮游植物的物种数
Figure 2. The number of phytoplankton species at the survey stations in Lingshui Bay in 2019
-
在春、秋两季的调查中,平均藻细胞密度为8.56×10³ 个·m−3和22.81×10³ 个·m−3,均以硅藻为主,其藻细胞平均密度占比分别达到94.17%和88.42%。除1-1站位外,其余站位秋季藻细胞密度均大于春季(图3)。
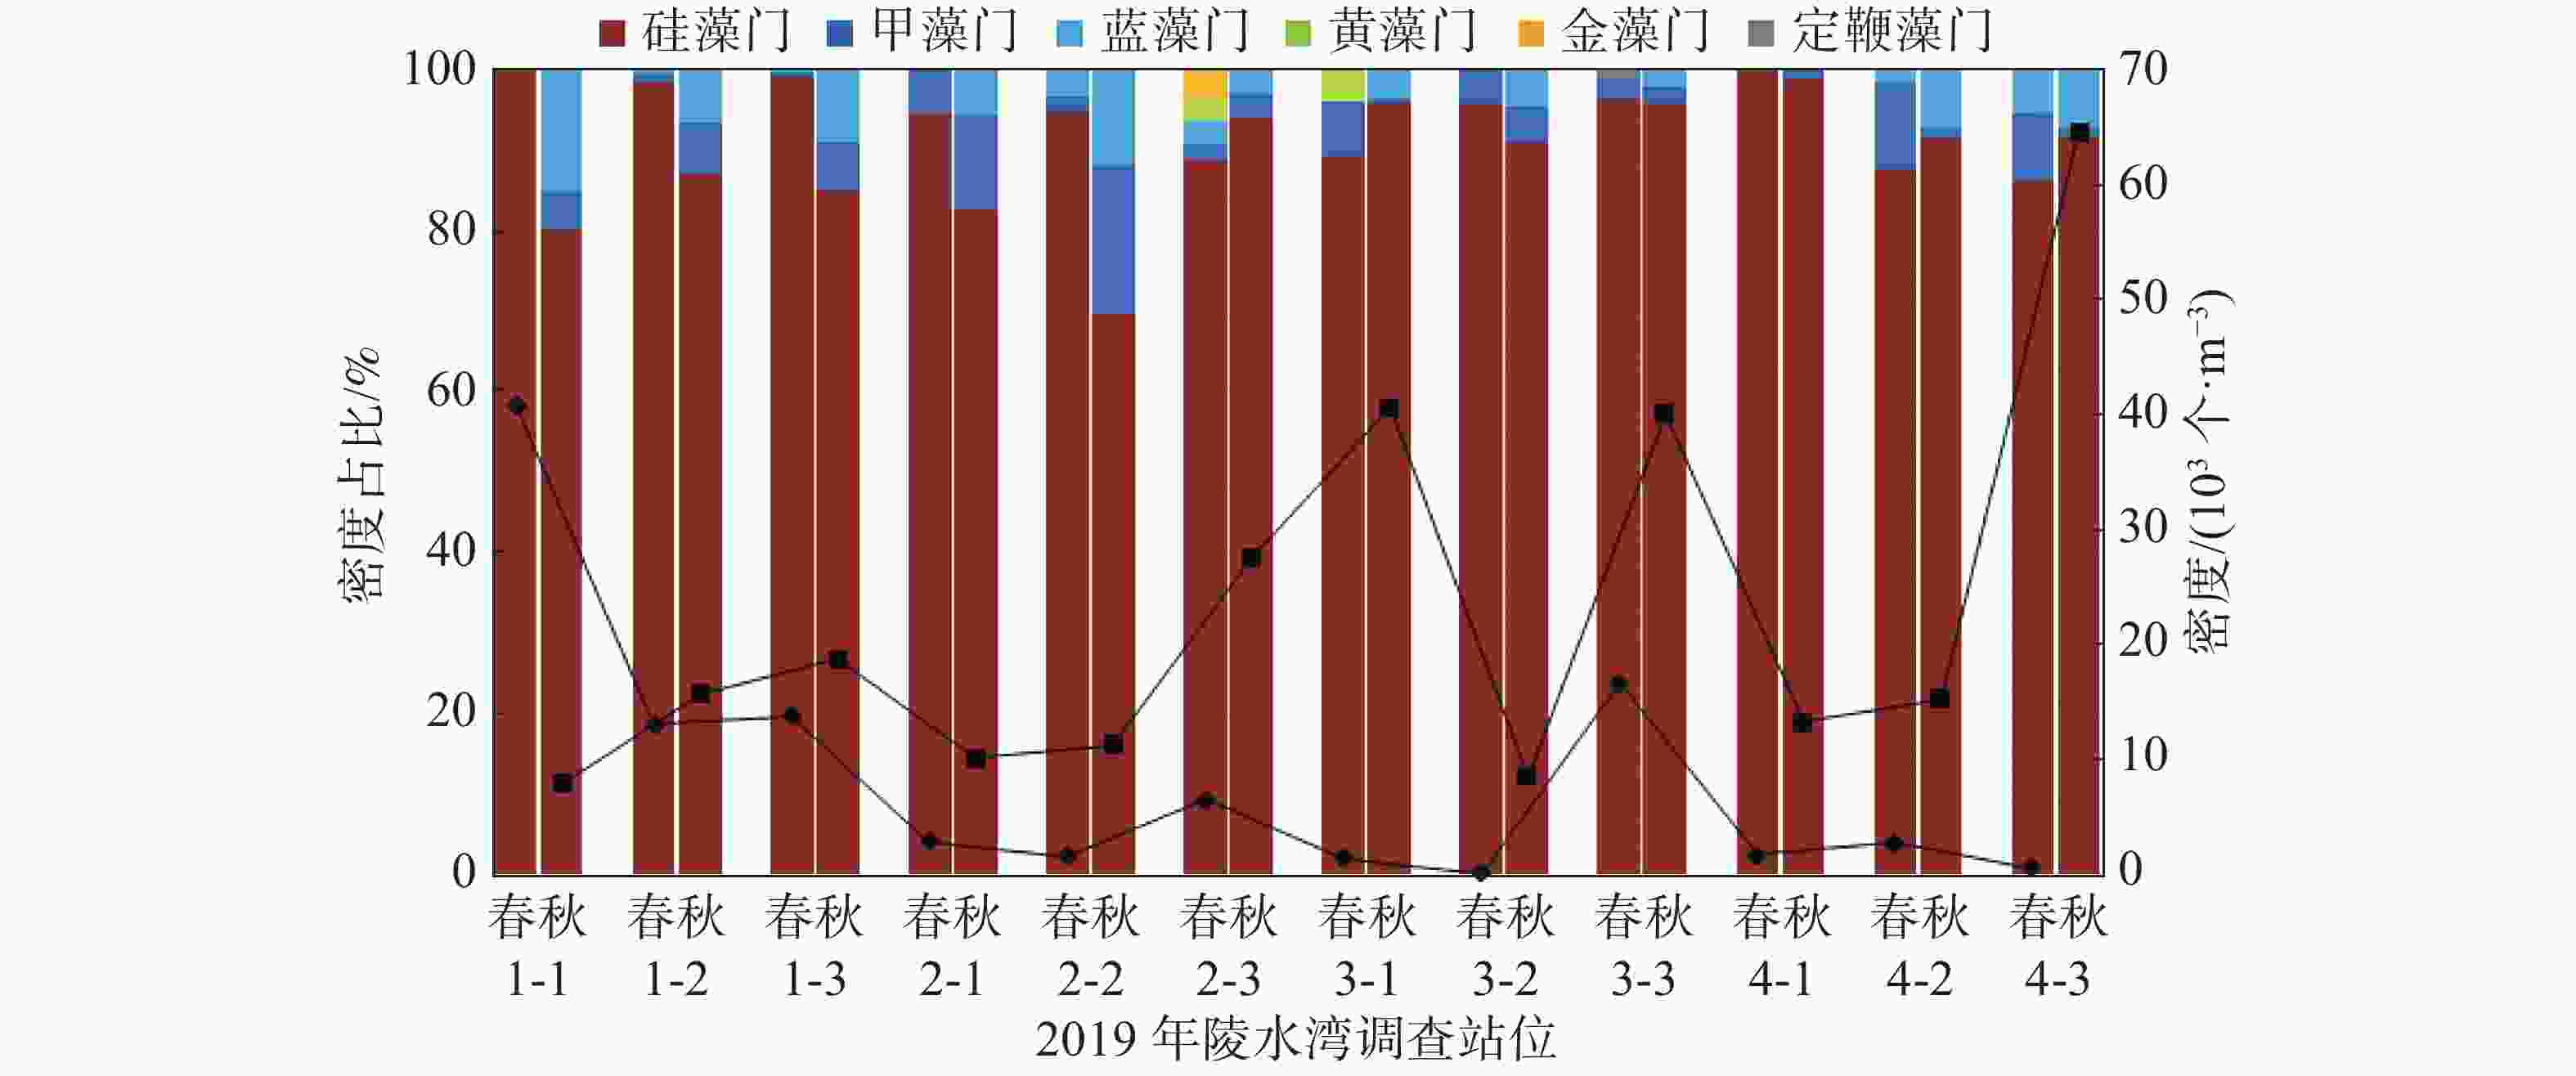
图 3 陵水湾门水平浮游植物的空间分布
Figure 3. Spatial distribution of phytoplankton at phylum level in Lingshui Bay
-
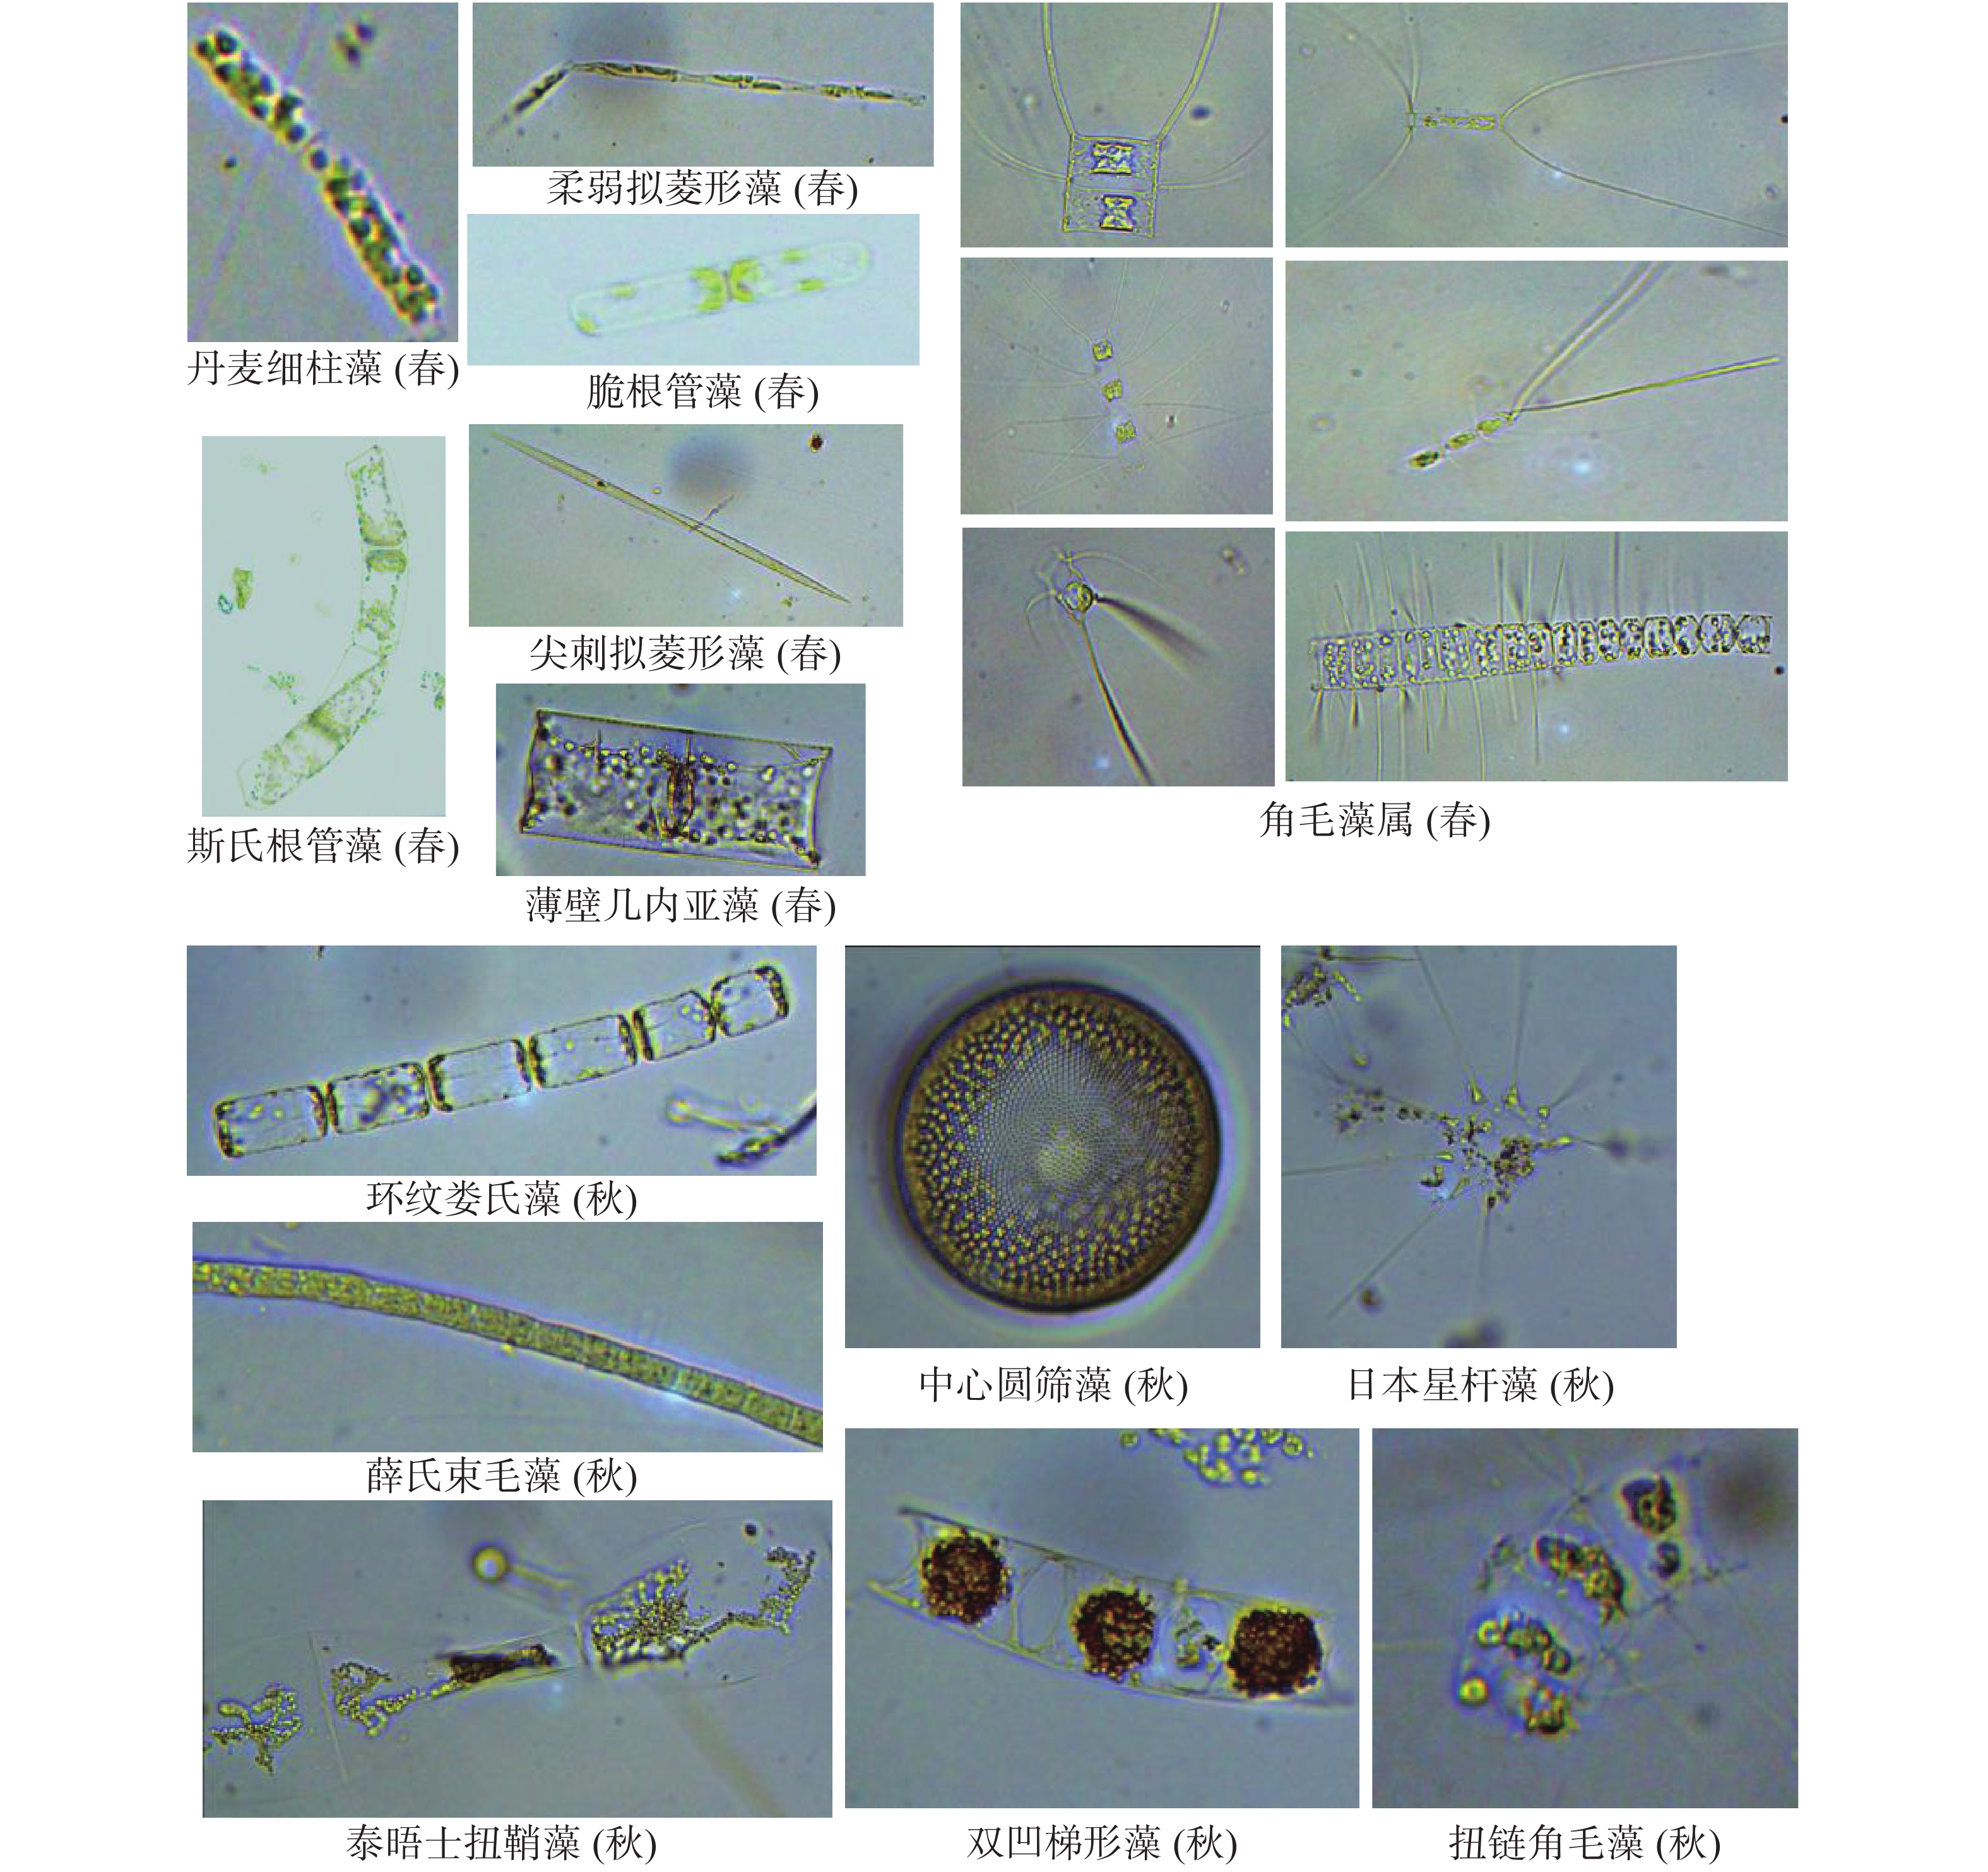
将优势度≥0.02的物种作为该海域的优势种。春季调查期间,该海域浮游植物优势种共7种,分别为丹麦细柱藻(Leptocylindrus danicus)、柔弱拟菱形藻(Pseudo-nitzschia delicatissima)、角毛藻属(Chaetoceros spp)、斯氏根管藻(Rhizosolenia stolterfothii)、脆根管藻(Rhizosolenia fragillissima)、薄壁几内亚藻(Guinardia flaccida)、尖刺拟菱形藻(Pseudo-nitzschia pungens)。丹麦细柱藻为第1优势种,优势度为Y=0.364 3,平均密度为3.12×10³ 个·m−3;柔弱拟菱形藻为第2优势种,优势度为Y=0.099 3,平均密度为1.27×10³ 个·m−3。秋季调查期间该海域浮游植物优势种共7种,与春季不同,分别为环纹娄氏藻(Lauderia annulata)、中心圆筛藻(Coscinodiscus centralis)、薛氏束毛藻(Trichodesmium thiebautii)、扭链角毛藻(Chaetoceros tortissimus)、双凹梯形藻(Climacodium biconcavum)、泰晤士扭鞘藻(Streptothece thamesis)和日本星杆藻(Asterionella japonica)。环纹娄氏藻为第1优势种,优势度为Y=0.153,平均密度为3.50×10³ 个·m−3;中心圆筛藻为第2优势种,优势度为Y=0.128,平均密度为3.49×10³ 个·m−3(表3)。陵水湾春秋两季优势种显微镜下的生物学特征见图4。
表 3 陵水湾浮游植物优势种
Table 3. The dominant species of phytoplankton in Lingshui Bay
航次
Voyage优势种
Dominant species平均密度/(×103 个·m−3)
Mean density占总密度比例/%
Over total density出现频率/%
Frequency优势度
Dominance春 丹麦细柱藻 Leptocylindrus danicus 3.12 36.43 100.00 0.36 柔弱拟菱形藻 Pseudo-nitzschia delicatissima 1.27 14.89 66.67 0.10 角毛藻属 Chaetoceros spp 0.85 9.93 83.33 0.08 斯氏根管藻 Rhizosolenia stolterfothii 0.50 5.85 83.33 0.05 脆根管藻 Rhizosolenia fragillissima 0.58 6.75 58.33 0.04 薄壁几内亚藻 Guinardia flaccida 0.25 2.91 83.33 0.02 尖刺拟菱形藻 Pseudo-nitzschia pungens 0.43 5.01 41.67 0.02 秋 环纹娄氏藻 Lauderia annulata 3.50 15.33 100.00 0.15 中心圆筛藻 Coscinodiscus centralis 3.49 15.32 83.33 0.13 薛氏束毛藻 Trichodesmium thiebautii 1.28 5.62 91.67 0.05 扭链角毛藻 Chaetoceros tortissimus 3.24 14.18 25.00 0.04 双凹梯形藻 Climacodium biconcavum 0.85 3.72 66.67 0.03 泰晤士扭鞘藻 Streptothece thamesis 0.81 3.57 66.67 0.02 日本星杆藻 Asterionella japonica 1.49 6.55 33.33 0.02 
图 4 陵水湾浮游植物优势藻种的显微观察
Figure 4. Microscopic observation of dominant algae species in phytoplankton in Lingshui Bay
-
多样性指数和均匀度计算结果表明(表4),春季该海域浮游植物的多样性指数和均匀度平均值分别为2.99和0.76,秋季分别为3.03和0.79。春秋季陵水湾多样性指数均≥3.0,表明该海域生境状况优良。春季丰富度指数范围在0.84~2.89之间,平均为1.96。秋季丰富度指数范围在0.45~2.25之间,平均为1.42。
表 4 陵水湾各站位浮游植物多样性指数、均匀度和丰富度指数
Table 4. Phytoplankton diversity index, evenness and richness index of each survey station in Lingshui Bay
站位 Survey station 多样性指数 Diversity index 均匀度指数 Evenness index 丰富度指数 Richness index 春 秋 春 秋 春 秋 1-1 2.96 2.88 0.80 0.72 1.13 1.35 1-2 2.06 1.58 0.65 0.68 0.84 0.45 1-3 2.90 3.35 0.66 0.80 2.10 1.76 2-1 3.07 3.10 0.86 0.79 1.38 1.42 2-2 2.44 3.17 0.77 0.81 1.08 1.52 2-3 3.09 3.82 0.67 0.86 2.61 2.25 3-1 3.40 2.28 0.76 0.60 2.89 1.27 3-2 3.20 3.02 0.84 0.74 2.44 1.51 3-3 2.75 3.72 0.61 0.93 2.26 1.66 4-1 2.81 3.14 0.72 0.80 1.88 1.32 4-2 3.62 2.56 0.84 0.77 2.40 0.95 4-3 3.64 3.71 0.89 0.93 2.48 1.56 -
从图5可知,陵水湾春季总氮含量平均值为3.90 mg·L−1,秋季总氮含量均高于春季各站位,平均总氮为6.86 mg·L−1,各调查站位之间无明显规律。春秋两季硝酸盐氮含量平均值分别为0.90 mg·L−1和0.73 mg·L−1,秋季略低于春季,春秋季各站位差异较大。陵水湾春季调查区域亚硝酸盐氮含量介于0.006~0.010 mg·L−1之间,秋季亚硝酸盐氮含量介于0.001 8~0.008 8 mg·L−1之间,平均值为0.005 9 mg·L−1,与春季相比,秋季亚硝酸盐氮含量下降。陵水湾各调查站位春季的氨氮含量介于0.28~1.72 mg·L−1之间,秋季氨氮含量平均值增加,明显高于春季。陵水湾春季总磷平均值1.64 mg·L−1,秋季总磷含量平均值为0.75 mg·L−1,仅为春季含量的1/2。陵水湾海域春季COD的平均值为3.00 mg·L−1,秋季平均值3.80 mg·L−1。

图 5 陵水湾各调查站位水质相关指标的测定结果
Figure 5. Measurement results of water quality-related indicators at various survey stations in Lingshui Bay
-
陵水湾浮游植物与环境因子之间的冗余分析(RDA)结果表明(图6),春季第1第2排序轴的特征值分别为0.551和0.141,累计解释69.2%的物种变化信息;秋季第1第2排序轴的特征值分别为0.292和0.198,累计解释49.09%的物种变化信息。

图 6 陵水湾春季(a)和秋季(b)浮游植物与环境因子的RDA排序分析图
Figure 6. RDA ordination analysis of phytoplankton and environmental factors of Lingshui Bay in spring (a) and autumn (b)
选择优势度排名前10的春秋两季的浮游植物,利用向前引入法逐步筛选环境因子,发现春季有2个环境因子的检验结果达到显著水平,分别为盐度(S)(F=4.6;P=0.008)和亚硝态氮(NO2-N)(F=2.8,P=0.014);秋季仅亚硝态氮(NO2-N)(F=2.8,P=0.034)达到显著水平。说明这2个环境因子是影响陵水湾浮游植物群落结构的主要环境因子。
浮游植物与环境因子的RDA排序结果表明(图6),春季浮游植物优势种如脆根管藻、薄壁几内亚藻、角毛藻属和柔弱拟菱形藻等与亚硝态氮和电导率呈正相关,与COD呈负相关。其余优势种如拟旋链角毛藻、丹麦细柱藻、柔弱根管藻、斯氏根管藻、拟旋链角毛藻和尖刺拟菱形藻等与溶解氧呈正相关,与盐度、总磷和总氮呈负相关。秋季浮游植物优势种如泰晤士扭鞘藻、日本星杆藻、双凹梯形藻和环纹娄氏藻等与COD、总磷、水温、溶解氧和硝态氮呈正相关。中心网纹藻、中华半管藻、海链藻、钟形中鼓藻和扭链角毛藻等与氨氮、总磷和pH呈正相关。薛式束毛藻与所有检测的环境因子之间均呈负相关的关系。
-
对海南陵水湾近岸海域春、秋两季的浮游植物和水质调查的结果表明,共发现浮游植物134种,均以硅藻为主要类群,与历年来南海浮游植物调查结果基本一致[10]。春季鉴定出4种蓝藻门藻类,而秋季仅鉴定出1种,黄藻、金藻和定鞭藻门种类未鉴定出。春秋两季硅藻细胞密度分别占总细胞密度的94.17%和88.42%,是主要的优势类群。调查发现,水温的增高,光照作用的增强,有利于硅藻的生长[11]。硅藻是水域浮游植物的主要类群,因其组成和数量与营养盐的浓度密切相关[12-13],因此,硅藻经常被用来作为含盐的指示物[14],硅藻去除各营养盐中的N和P,从而达到净化废水的作用,硅藻群集生活的过程可反映该区域环境的长期变化过程[15-16]。
-
陵水湾春、秋两季的优势种均为7种,春季优势种分别为丹麦细柱藻、柔弱拟菱形藻、角毛藻属、斯氏根管藻、脆根管藻、薄壁几内亚藻、尖刺拟菱形藻,其中,丹麦细柱藻为第1优势种,柔弱拟菱形藻为第2优势种。丹麦细柱藻为广温广盐近岸种类,是中国近海较为常见的赤潮藻种类型[17-18]。在陵水湾采样期间未出现赤潮现象,说明丹麦细柱藻的细胞丰度不足以达到引起赤潮,但因为其生长速度快,细胞粒径小,通常是水体富营养化的标志[19]。秋季优势种分别为环纹娄氏藻、中心圆筛藻、薛氏束毛藻、扭链角毛藻、双凹梯形藻、泰晤士扭鞘藻和日本星杆藻,其中,环纹娄氏藻为第1优势种,中心圆筛藻为第2优势种。陵水湾春季浮游植物的多样性指数、均匀度和丰富度指数平均值分别为2.99 、0.76和1.96,秋季分别为3.03、0.79和1.42。Shannon-Wiener 指数值为0~1时,水体为重污染;指数值1~3为中度污染;指数值大于3时,为清污染或无污染[20]。春秋季陵水湾多样性指数均大于3.0,表明该海域生境状况一直优良,均匀度指数均大于0.3,结合多样性指数和均匀度指数,表明了陵水湾浮游植物多样性高,且群落结构稳定[21]。
-
水质检测结果表明,秋季总氮、氨氮和COD含量平均值高于春季,秋季硝酸盐氮、亚硝酸盐氮和总磷含量平均值低于春季。秋季调查结果也表明,秋季的细胞密度大于春季的细胞密度。研究显示,氮磷营养盐是浮游植物生长的必需条件,海水中氮磷营养盐的增多是导致细胞密度高的原因之一[22]。COD含量的增高是水体受到有机物污染的指标,COD含量越高,表明受到有机物污染越严重,秋季的COD含量高于春季,说明秋季调查海域的水体环境较春季差[23]。
陵水湾春季浮游植物和环境因子进行RDA分析结果显示,影响浮游植物的主要环境因子有盐度和亚硝态氮。已有研究报道,氮盐是影响浮游植物生长极为重要的因素[24],而海水盐度是浮游植物渗透压影响的关键因素之一,盐度的变化是促使赤潮生物快速繁殖,从而引发赤潮的重要原因[25-26]。在陵水湾调查期间,该海域没有出现赤潮现象,可能的原因是浮游植物细胞丰度未达到引起赤潮的水平。陵水湾秋季调查结果显示,影响陵水湾浮游植物生长的主要限制因素是海水中的亚硝态氮含量。
结果表明,陵水湾环境中的营养盐和海水盐度的变化是影响浮游植物群落结构变化的主要原因。陵水湾调查海域秋季水体环境较春季差,浮游植物细胞密度高于春季。水质方面,秋季水质中的氮元素高于春季。人类活动的破坏、生活污水的排放是导致陵水湾水体富营养化的主要原因,加强控制生活污水的排放管理,是保护海港生态环境的重要举措。
Investigation of Phytoplankton Community Structure and Seawater Quality in Lingshui Bay in Spring and Autumn
-
摘要: 于2019年春、秋两季笔者分别对陵水湾近岸海域浮游植物的种类、群落结构、多样性指数和水质进行调查。结果表明:春、秋两季分别鉴定出浮游植物6门81种和3门53种,均以硅藻居多。春、秋两季优势种各不相同,但均为7种。春、秋两季浮游植物平均细胞密度分别为8.56×10³ 个·m−3和22.81×10³ 个·m−3。春季该海域浮游植物的多样性指数和均匀度平均值分别为2.99和0.76,秋季分别为3.03和0.79。冗余分析结果表明,陵水湾海域生态环境优良,春季浮游植物与盐度和亚硝酸盐氮呈显著正相关,秋季浮游植物与亚硝酸盐氮呈显著正相关,因此,影响陵水湾浮游植物的主要因素是盐度和亚硝酸盐氮含量。陵水湾浮游植物群落结构与水中营养盐密切相关,应加强控制陵水湾污水的排放,增强对陵水湾近岸海域环境的保护。Abstract: The species, community structure and diversity index of phytoplankton and seawater quality in the coastal waters of Lingshui Bay were investigated in the spring and autumn of 2019. The results showed that there were 81 species of phytoplankton in 6 phyla and 53 species in 3 phyla identified in spring and autumn, respectively, most of which were diatoms. There are 7 dominant species of phytoplankton although different in spring and autumn. The average cell density of phytoplankton in spring and autumn was 8.56×10³ cells·m−3 and 22.81×10³ cells·m−3, respectively. The average diversity index and uniformity of phytoplankton in the sea waters were 2.99 and 0.76 in spring, and 3.03 and 0.79 in autumn. Redundancy analysis (RDA) showed that the ecological environment in Lingshui Bay was excellent. The phytoplankton was significantly positively correlated with salinity and nitrite-nitrogen in spring, and with nitrite-nitrogen in autumn, indicating that the main factors affecting phytoplankton in Lingshui Bay are salinity and nitrite-nitrogen content. The phytoplankton community structure in Lingshui Bay was closely related to the nutrients in the sea water. The control of discharge of sewage in Lingshui Bay should be strengthened to enhance the protection of the coastal waters of Lingshui Bay.
-
Key words:
- Lingshui Bay /
- phytoplankton /
- community structure /
- environmental factor /
- redundancy analysis
-
图 2 陵水湾2019年调查站位浮游植物的物种数
Fig. 2 The number of phytoplankton species at the survey stations in Lingshui Bay in 2019
图 3 陵水湾门水平浮游植物的空间分布
Fig. 3 Spatial distribution of phytoplankton at phylum level in Lingshui Bay
图 4 陵水湾浮游植物优势藻种的显微观察
Fig. 4 Microscopic observation of dominant algae species in phytoplankton in Lingshui Bay
图 5 陵水湾各调查站位水质相关指标的测定结果
Fig. 5 Measurement results of water quality-related indicators at various survey stations in Lingshui Bay
图 6 陵水湾春季(a)和秋季(b)浮游植物与环境因子的RDA排序分析图
TN:总氮;TP:总磷;NO2-N:亚硝态氮;NO3-N:硝态氮;NH3-N:氨氮;COD:化需氧量;Cond:电导率;DO:溶解氧;WT:水温;S:盐度。
Fig. 6 RDA ordination analysis of phytoplankton and environmental factors of Lingshui Bay in spring (a) and autumn (b)
TN: Total nitrogen; TP: Total phosphorus; NO2-N: Nitrite; NO3-N: nitrate; NH3-N: Ammonia nitrogen; COD: Chemical oxygen demand; Cond: Conductivity; DO: Dissolved oxygen; WT: Water temperature; S: salinity.
表 1 陵水湾近岸海域浮游植物调查站位地理坐标
Table 1 Geographical coordinates of phytoplankton survey stations in the coastal waters of Lingshui Bay
站位 Station 经度 Longitude 纬度 Latitude 1-1 109°57′11.09″ 18°24′14.82″ 1-2 109°57′05.18″ 18°23′25.45″ 1-3 109°57′05.18″ 18°22′08.59″ 2-1 109°55′22.63″ 18°24′25.90″ 2-2 109°33′12.08″ 18°14′09.52″ 2-3 109°55′21.33″ 18°22′19.87″ 3-1 109°53′34.97″ 18°24′11.56″ 3-2 109°32′06.85″ 18°14′03.28″ 3-3 109°53′33.83″ 18°22′23.38″ 4-1 109°52′24.54″ 18°23′38.64″ 4-2 109°58′24.38″ 18°22′25.00″ 4-3 109°52′24.01″ 18°21′18.65″  下载: 导出CSV
表 2 2019年春秋两季陵水湾各调查站位环境参数表
Table 2 Environmental parameters of survey sites in Lingshui Bay in the spring and autumn of 2019
样品编号
Sample code水温/℃ Sea water temperature pH 电导率/(μs·cm−1) Conductivity 盐度 Salinity 溶解氧DO/(mg·L−1) 春 秋 春 秋 春 秋 春 秋 春 秋 1-1 26.37 29.70 8.30 8.10 21.80 24.77 29.00 33.73 10.37 6.54 1-2 26.33 30.10 8.30 8.20 21.83 25.00 29.00 32.80 9.33 6.67 1-3 26.37 29.70 8.32 8.30 21.57 25.00 29.00 33.37 10.77 6.32 2-1 26.33 29.90 8.28 8.20 21.57 21.15 29.00 33.30 7.83 5.45 2-2 26.23 31.00 8.28 8.20 21.50 25.00 29.00 33.43 5.90 5.49 2-3 26.30 30.40 8.29 8.20 21.30 22.73 29.70 33.17 10.37 6.31 3-1 26.83 31.50 8.28 8.20 21.33 25.00 29.70 31.10 4.57 5.55 3-2 27.03 32.00 8.28 8.30 21.33 19.37 29.00 35.30 5.00 5.50 3-3 26.30 30.40 8.31 8.30 21.37 25.00 30.30 33.03 10.27 5.91 4-1 26.70 31.00 8.29 8.30 21.43 23.80 31.70 31.13 4.77 7.04 4-2 26.03 32.50 8.27 8.30 21.43 25.00 32.00 34.20 4.90 6.09 4-3 26.07 31.40 8.22 8.20 21.37 25.00 32.00 33.70 4.77 6.20
下载: 导出CSV
表 3 陵水湾浮游植物优势种
Table 3 The dominant species of phytoplankton in Lingshui Bay
航次
Voyage优势种
Dominant species平均密度/(×103 个·m−3)
Mean density占总密度比例/%
Over total density出现频率/%
Frequency优势度
Dominance春 丹麦细柱藻 Leptocylindrus danicus 3.12 36.43 100.00 0.36 柔弱拟菱形藻 Pseudo-nitzschia delicatissima 1.27 14.89 66.67 0.10 角毛藻属 Chaetoceros spp 0.85 9.93 83.33 0.08 斯氏根管藻 Rhizosolenia stolterfothii 0.50 5.85 83.33 0.05 脆根管藻 Rhizosolenia fragillissima 0.58 6.75 58.33 0.04 薄壁几内亚藻 Guinardia flaccida 0.25 2.91 83.33 0.02 尖刺拟菱形藻 Pseudo-nitzschia pungens 0.43 5.01 41.67 0.02 秋 环纹娄氏藻 Lauderia annulata 3.50 15.33 100.00 0.15 中心圆筛藻 Coscinodiscus centralis 3.49 15.32 83.33 0.13 薛氏束毛藻 Trichodesmium thiebautii 1.28 5.62 91.67 0.05 扭链角毛藻 Chaetoceros tortissimus 3.24 14.18 25.00 0.04 双凹梯形藻 Climacodium biconcavum 0.85 3.72 66.67 0.03 泰晤士扭鞘藻 Streptothece thamesis 0.81 3.57 66.67 0.02 日本星杆藻 Asterionella japonica 1.49 6.55 33.33 0.02
下载: 导出CSV
表 4 陵水湾各站位浮游植物多样性指数、均匀度和丰富度指数
Table 4 Phytoplankton diversity index, evenness and richness index of each survey station in Lingshui Bay
站位 Survey station 多样性指数 Diversity index 均匀度指数 Evenness index 丰富度指数 Richness index 春 秋 春 秋 春 秋 1-1 2.96 2.88 0.80 0.72 1.13 1.35 1-2 2.06 1.58 0.65 0.68 0.84 0.45 1-3 2.90 3.35 0.66 0.80 2.10 1.76 2-1 3.07 3.10 0.86 0.79 1.38 1.42 2-2 2.44 3.17 0.77 0.81 1.08 1.52 2-3 3.09 3.82 0.67 0.86 2.61 2.25 3-1 3.40 2.28 0.76 0.60 2.89 1.27 3-2 3.20 3.02 0.84 0.74 2.44 1.51 3-3 2.75 3.72 0.61 0.93 2.26 1.66 4-1 2.81 3.14 0.72 0.80 1.88 1.32 4-2 3.62 2.56 0.84 0.77 2.40 0.95 4-3 3.64 3.71 0.89 0.93 2.48 1.56
下载: 导出CSV
-
[1] BIERMAN P, LEWIS M, OSTENDORF B, et al. A review of methods for analysing spatial and temporal patterms in coastal water quality [J]. Ecological Indicators, 2011, 11(1): 103 − 114. doi: 10.1016/j.ecolind.2009.11.001 [2] 李亚军,王先明,程贤松,等. 海南岛海尾湾浮游植物群落结构及水质的调查[J]. 热带生物学报, 2020, 11(3): 257 − 265. [3] CHEN B H, XU Z H, ZHOU Q, et al. Long-term changes of phytoplankton community in Xiagu waters of Xiamen, China [J]. Acta Oceano Sin, 2010, 29(6): 104 − 114. doi: 10.1007/s13131-010-0081-4 [4] 富砚昭, 韩成伟, 许士国. 近岸海域赤潮发生机制及其控制途径研究进展[J]. 海洋环境科学, 2019, 38(1): 146 − 152. [5] GONG W P, WANG Y P, WANG D R, et al. Hydrodynamics under combined action of wave and tide and its implication for the sediment dynamics in Xincun tidal inlet, Hainan [J]. Journal of Marine Sciences, 2008, 26(2): 1 − 12. [6] SHANNON C E, WEAVER W. The Mathematical theory of communication [M]. Urbana IL: University of IIlinois Press, 1949: 1 − 125. [7] PIELOU E C. An introduction to mathematical ecology [M]. New York: Wiley Interscience, 1969: 1 − 286. [8] MARGALEF R. La teoriá de la informacion en ecologia [J]. Memonas de la Real Academia de Cienciasy Artes de Barcelona, 1957, 32(13): 373 − 449. [9] 孙儒泳. 动物生态学原理[M]. 2版. 北京: 北京师范大学出版社, 1992: 356 − 357. [10] 李红飞, 林森杰. 南海浮游植物生态学研究进展[J]. 厦门大学学报(自然科学版), 2019, 58(1): 1 − 10. [11] 徐琼, 贾克力, 李文宝, 等. 达里诺尔湖夏季浮游植物群落结构及分布特征[J]. 水生态学杂志, 2016, 37(6): 14 − 22. [12] 李顺, 吴聪, 陈炽新, 等. 南海中北部表层沉积硅藻的高分辨空间分布及其与现代环境因子的关系[J]. 地学前缘, 2020, 27(6): 241 − 254. [13] 曾晓鹏. 海洋浮游硅藻对多重海洋环境变化的生理学响应研究[D]. 广州: 华南理工大学, 2019. [14] 肖武鹏, 柳欣, 黄邦钦. 春季东海近岸表层浮游植物群落结构及其与环境因子的关系[J]. 海洋学研究, 2013, 31(3): 76 − 82. doi: 10.3969/j.issn.1001-909X.2013.03.011 [15] 胡俊, 柳欣, 张钒, 等. 台湾海峡浮游植物生长的营养盐限制研究[J]. 台湾海峡, 2008(4): 452 − 458. [16] 王丹, 黄春秀, 黄邦钦, 等. 黄海两种典型硅藻的磷胁迫生理研究[J]. 海洋科学, 2008(5): 22 − 27. [17] 黄海燕, 杨翼, 杨璐, 等. 2004—2015年夏季渤海湾生态监控区网采浮游植物变化研究[J]. 海洋学报, 2018, 40(1): 115 − 128. [18] 戴红, 邱茂福, 杨毕铖, 等. 闽江口以南海域夏季浮游植物群落特征及其与环境因子的关系[J]. 渔业研究, 2016, 38(1): 56 − 66. [19] 陈宝红. 基于水采样品的厦门海域浮游植物群落对营养盐长期变化的响应研究[D]. 厦门: 厦门大学, 2012. [20] KUANG Q J, MA P M, HU Z Y, et al. Research progress on algae biological evaluation and treatment of lake eutrophication [J]. Journal of Safety and Environment, 2005, 4(2): 87 − 91. [21] 马建新, 郑振虎, 李云平, 等. 莱州湾浮游植物分布特征[J]. 海洋湖沼通报, 2002(04): 63 − 67. doi: 10.3969/j.issn.1003-6482.2002.04.011 [22] SHU W X, ZHANG Y S, WEI C Z, et al. Seasonal dynamics of and factors in phytoplankton in Hongze Lake [J]. Water Resources Protection, 2016, 32(5): 115 − 122. [23] KAWABE M, KAWABE M. Temporal and spatial characteristics of chemical oxygen demand in Tokyo Bay [J]. Journal of Oceanography, 1997, 53(1): 103 − 120. [24] 李亚军, 王先明, 程贤松, 等. 美济礁近岸海域夏季浮游植物群落结构特征及其与环境因子的关系[J]. 热带作物学报, 2020, 41(3): 615 − 621. doi: 10.3969/j.issn.1000-2561.2020.03.027 [25] 赵行行. 东港赤潮监控区浮游植物生长的环境因子影响分析[D]. 大连海事大学, 2017. [26] 武丹, 韩龙, 梅鹏蔚, 等. 渤海湾浮游植物群落特征及其环境影响因子[J]. 环境科学与技术, 2016, 39(4): 68 − 73. -

 点击查看大图

计量
- 文章访问数: 995
- HTML全文浏览量: 435
- PDF下载量: 45
- 被引次数: 0


