

-
群落物种多样性的形成与维持机制一直是生态学研究的热点[1-3]。物种多度分布(species abundance distribution, SAD)是描述给定生态群落内物种个体数量变化的简单而有力的方法[4],已经广泛应用于研究生态位差异、扩散、密度依赖、物种形成和灭绝对生态群落结构和动态的影响[5],在生物多样性和生物地理学的研究中发挥了重要作用[6]。自从MOTOMURA[7]首次试图揭示物种多度曲线的潜在机制以来,现已出现了至少27种不同的物种多度模型[6]。这些模型大致可分为3类:(1)纯统计模型,根据统计假设方法推导出来的物种多度分布模型,可以很好地拟合自然群落内的物种多度数据,但是难以解释其中的生态学意义,其中使用最早和最广泛的两个模型是对数级数模型(The logseries model)[8]和对数正态模型(The lognormal model)[9]。(2)生态学模型,也叫生态位模型,根据物种的多度和生态位占有之间的关系推导出的物种分布模型,可以阐释物种多度数据背后的生态学过程意义。其中断棍模型(Broken-stick model)[10]和生态位优先占领模型(Niche preemption model)[7]已被广泛应用与物种多度分布的研究中。(3)中性理论模型,以中性理论为基础的模型,如零和多项式模型(zero-sum multinomial distribution model)[11]和Volkov模型[12]。然而,生态位理论和中性理论在解释维持物种多样性的不同过程方面一直存在争议。生态位理论认为,在处于平衡状态的群落中,每个物种必须占据不同的生态位,强调环境过滤或物种相互作用在决定物种组成中的重要性[13]。中性理论则相反,假设空间过程单独决定物种组成,强调随机过程的重要性[14]。近年来对物种多度分布的研究主要集中在根据样地实测数据,使用物种多度分布模型对数据拟合,然后根据它们各自的拟合效果推断维持物种多样性的机制[15]。
亚热带常绿阔叶林是世界上分布广泛、生物多样性高的主要生物群落,其群落结构和物种组成与热带和温带森林大不相同[16]。常绿与落叶物种是亚热带常绿阔叶林中较易分辨的两类生活型,两者对生物因子和非生物因子有着不同的响应手段[17-19]。在常绿阔叶林中,常绿树种往往占绝对优势,只有极少数落叶树种零星分布在群落中[20]。姚良锦等的研究表明,两类生活型树种川陕鹅耳枥和多脉青冈具有相反的多度分布情况[21]。落叶树种的多度分布格局更易受到生境异质性的影响,而常绿树种多度分布格局对生境变化的响应不大[22]。笔者对大岗山2 ha常绿阔叶林样地群落生态学数据进行分析,使用6个模型进行不同生活型物种多度格局的拟合,每个模型都代表决定群落行为的基本过程。假设在大岗山常绿阔叶林中,常绿和落叶树种的多度分布应该有着明显的差别,主导落叶树种多度分布格局的主要机制是生态位过程,主导常绿树种多度分布格局的主要机制是中性过程。对常绿和落叶树种的多度分布格局进行研究,将有助于从新视角理解常绿阔叶林内物种多样性与维持机制。
-
研究区位于江西大岗山森林生态系统国家野外科学观测研究站(简称大岗山森林生态站),地理坐标为114°30′~114°45′E,27°30′~27°50′N。属于亚热带季风湿润区,日照充足,雨量充沛。土壤类型为红壤和黄壤,植被类型主要由常绿阔叶林、杉木林、毛竹林等构成,其中常绿阔叶林为演替成熟的顶级次生林,由于受到人为干扰,几乎已经找不到未被破坏的原始林,经过几十年的自然演替,次生林林冠已全封闭。
-
在江西大岗山森林生态站内,选择具有典型代常绿阔叶林区域设置样地,样地面积为2 hm2。按照国家标准《森林生态系统长期定位观测方法》(GB/T33027—2016)中的相关规范进行样地设置,将样地划分为20 m×20 m标准的50个样方。在每个样方中进行植物普查,对胸径(DBH)≥1 cm的树干进行标记、鉴定,并测量其胸径、树高、冠幅、物种名称、健康状况和空间坐标。
-
采用重要值(importance value,IV)衡量物种的优势度。以样地群落数据为基础,分别计算常绿与落叶两种生活型树种的重要值。重要值=(相对多度+相对显著度+相对频度)÷3。
-
物种多度表示方法通常以直方图法(histogram plot)、多度等级分布(rank abundance distribution, RAD)以及累积经验分布函数(empirical cumulative distribution function, ECDF)为主[6]。前两种方法在进行数学处理和解释时会造成困难而难以比较不同的物种分布[23],因此,笔者采用ECDF来表示两类生活型物种的多度分布格局,使用K-S(Kolmogorov-Smirnov test)检验比较两者差异。
-
生态位和中性理论分别强调了维持物种多样性的不同过程[24]。为了评价两种理论在两类生活型物种群落构建过程中的相对重要性,使用纯统计模型、生态位模型和中性理论模型3种类型的模型来解释和量化物种多度分布的模式和过程。分别为对数级数模型(Log-series model)、对数正态模型(Poisson-lognormal model)、生态位优先占领模型(Niche preemption model)、断棍模型(Broken-stick model)、复合群落零和多项式模型(metacommunity zero-sum multinomial distribution model)、Volkov模型(Volkov model)。
(1)对数级数模型:
$$ S\left(n\right)=\alpha \frac{{X}^{n}}{n}; $$ 式中,
$ S\left(n\right) $ 为群落中多度为$ n $ 的物种数,$ \alpha $ 代表群落内物种多样性;$ X $ 为常数(0<$ X $ ≤1)[8]。(2)对数正态模型:
$$ \begin{split} &{A_i} = {e^{\log \left( {\rm{\mu }} \right) + \log \left( {\rm{\delta }} \right)}}\varPhi \\ &\left( {i = 1,2,3, \cdots ,S} \right); \end{split} $$ 式中,
$ { A}_{i} $ 为第$ i $ 个物种的多度,$ \;\mu $ 和$ \delta $ 分别表示正态分布的均值和方差,$ \varPhi $ 为正态偏差[9]。(3)生态位优先占领模型:
$$\begin{array}{c} {A_I} = {A_1}{\left( {1 - k} \right)^{i - 1}}\\ \left( {i = {\rm{1}},{\rm{2}},3, \cdots ,S} \right); \end{array}$$ 式中,模型假定种1先占用群落总生态位的
$ k $ 份,种2占用剩下的$ k(1-k) $ 份,种3再继续占据余下的$ k{(1-k)}^{2} $ 份,依次类推,直至剩余资源无法继续维持另一个物种的生存[7]。(4)断棍模型:
$$\begin{split} &{A_i} = \frac{J}{S}\sum\limits_{x = i}^S {\frac{1}{x}} \\ &\left( {i = {\rm{1}},{\rm{2}},3, \cdots ,S} \right); \end{split}$$ 式中,该模型假设某一群落内的总生态位是长度为1的一条短棍,若将其分割为
$ S $ 段,则代表生态位被$ S $ 个物种所占有,模型假定$ S $ 个物种的分类地位和竞争能力均相似,且在群落中同时出现。$ J $ 表示群落内物种的个体总数,$ {A}_{i} $ 表示第$ i $ 物种的多度[10]。(5)复合群落零和多项式模型:
$$ S\left(n\right)=\frac{\theta }{n}{\int }_{0}^{J}{f}_{n,1}\left(y\right)\left(1-\frac{y}{J}\right); $$ $$ {f}_{n,\delta }\left(y\right)=\frac{1}{{\Gamma }\left(n\right){\delta }^{n}}\mathrm{e}\mathrm{x}\mathrm{p}\left(-\frac{y}{\delta }\right){y}^{n-1}{\text{。}} $$ 式中,该模型假定某一样点的物种多度分布来自中性复合群落的随机漂变。
$ S\left(n\right) $ 为群落中多度为$ n $ 的物种数,$ \theta $ 代表群落内物种多样性;$ J $ 为取样点内个体数[11]。(6)Volkov模型:
$$ S\left(n\right)=\theta \frac{J!}{n!\left(J-n\right)!}\frac{{\Gamma }\left(\gamma \right)}{{\Gamma }\left(J+\gamma \right)}{\int }_{0}^{\gamma }\frac{{\Gamma }\left(n+y\right)}{{\Gamma }\left(1+y\right)}\frac{{\Gamma }\left(J-n+\gamma -y\right)}{{\Gamma }\left(\gamma -y\right)}dy; $$ $$ {\Gamma }\left(\mathrm{z}\right)={\int }_{0}^{\infty }{t}^{z-1}{e}^{-t}dt; $$ $$ \gamma =\frac{m(J-1)}{1-m}{\text{。}} $$ 式中,相较于复合群落零和多项式模型增加了迁移系数
$ m $ ,$ S\left(n\right) $ 为群落中多度为$ n $ 的物种数,$ \gamma $ 表示迁移到局域群落内的个体数[12]。 -
同时使用K-S检验[25]和赤池信息准则(Akaike information criterion, AIC)两种方法判断模型的拟合效果。K-S检验是一种非参数检验的方法,它通过计算两个样本经验分布函数(Empirical distribution function)之间的距离(统计量D)来判断二者是否存在显著差异。为了避免K-S检验中常出现的数据连结的问题,使用通过bootstrap优化后K-S进行检验(bootstrap的次数为1 000次。当P<0.05时,表明该模型被拒绝)[26]。AIC检验中,计算的AIC数值越小,表明拟合效果越好。数据处理过程均基于R-4.0.2软件(R CoreTeam, 2012),使用的软件包有sads包和Matching包。
-
在大岗山常绿阔叶林样地内共调查到乔木个体10 603株,其中常绿树种9 242株,落叶树种1 361株,常绿物种占明显优势。木本植物165种,其中常绿植物95种,落叶植物70种。分别计算两类生活型树种的重要值,两类生活型树种都具有明显的优势种(表1),常绿植物重要值前三位分别是丝栗栲(castanopsis fargesii)、青冈(Cyclobalanopsis glauca)、鹿角杜鹃(Rhododendron latoucheae);落叶植物重要值前三位分别是赤杨叶(Alniphyllum fortunei)、山乌桕(Sapium discolor)和木油桐(Vcmicia Montana)。
表 1 大岗山2 ha样地内两种生活型物种中重要值排名前十的木本植物
Table 1. The top 10 species of evergreen and deciduous woody plants arranged by the importance value at a 2 ha plot in Dagang Mountain
排名 Rank 常绿物种 Evergreen species 重要值 IV 排名 Rank 落叶树种 Deciduous species 重要值 IV 1 丝栗栲(Castanopsis fargesii) 13.35 1 赤杨叶(Alniphyllum fortunei) 10.98 2 青冈(Cyclobalanopsis glauca) 13.00 2 山乌桕(Sapium discolor) 9.98 3 鹿角杜鹃(Rhododendron latoucheae) 8.86 3 木油桐(Vernicia montana) 8.98 4 木荷(Schima superba) 4.54 4 野漆(Toxicodendron succedaneum) 4.81 5 黄牛奶树(Symplocos laurina) 4.50 5 八角枫(Alangium chinense) 4.62 6 刨花润楠(Machilus pauhoi) 4.27 6 枫香树(Liquidambar formosana) 3.84 7 油茶(Camellia oleifera) 3.87 7 野茉莉(Tyrax japonicus) 3.79 8 杉木(Cunninghamia lanceolata) 3.52 8 雷公鹅耳枥(Carpinus viminea) 3.61 9 细枝柃(Eurya loquaiana) 3.49 9 浙江柿(Diospyros glaucifolia) 2.84 10 格药柃(Eurya muricata) 2.88 10 檫木(Sassafras tzumu) 2.84 -
大岗山2 hm2样地内95种常绿物种与70种落叶物种的累计经验分布如图1所示,常绿与落叶物种的ECDF均呈现出一定程度的S型。两种生活型树种有着相似的稀有种比例,常绿物种相比于落叶物种,有着更高的常见种比例,基于bootstrap模拟方法的K-S检验表明,常绿树种与落叶树种的ECDF之间并无显著性差异(D=0.203,P=0.087)。
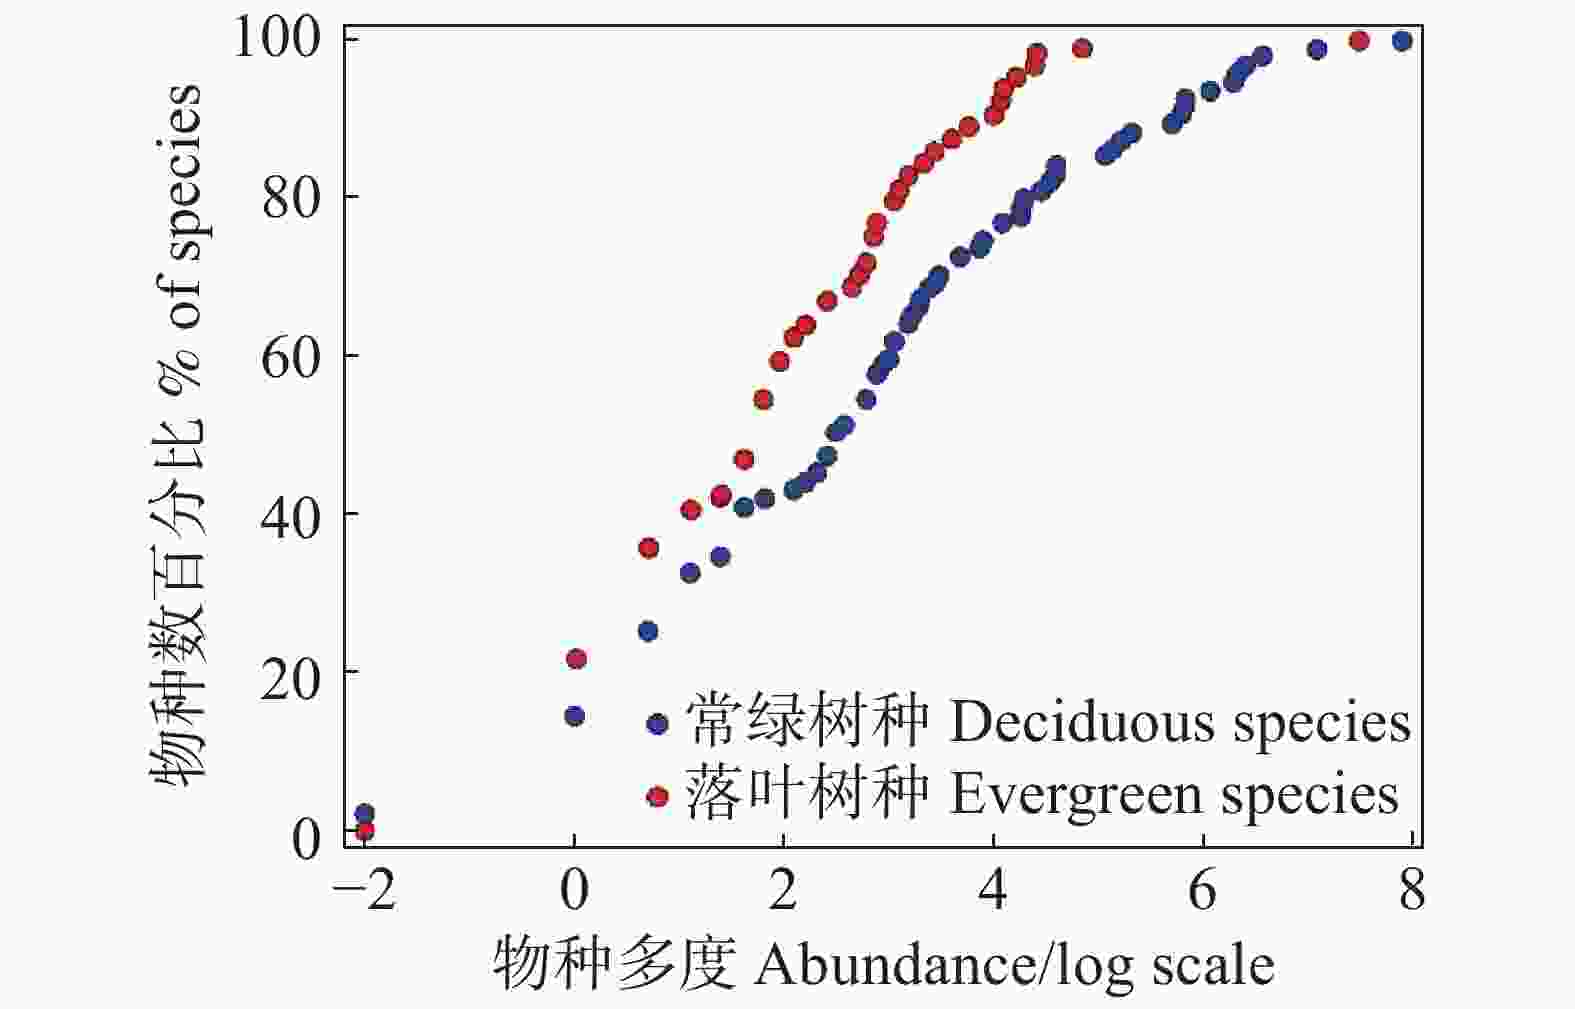
图 1 大岗山2 hm2样地内常绿与落叶物种的累计经验分布函数
Figure 1. The cumulative empirical distribution function of evergreen and deciduous species at the 2 ha plot in Dagang Mountain
-
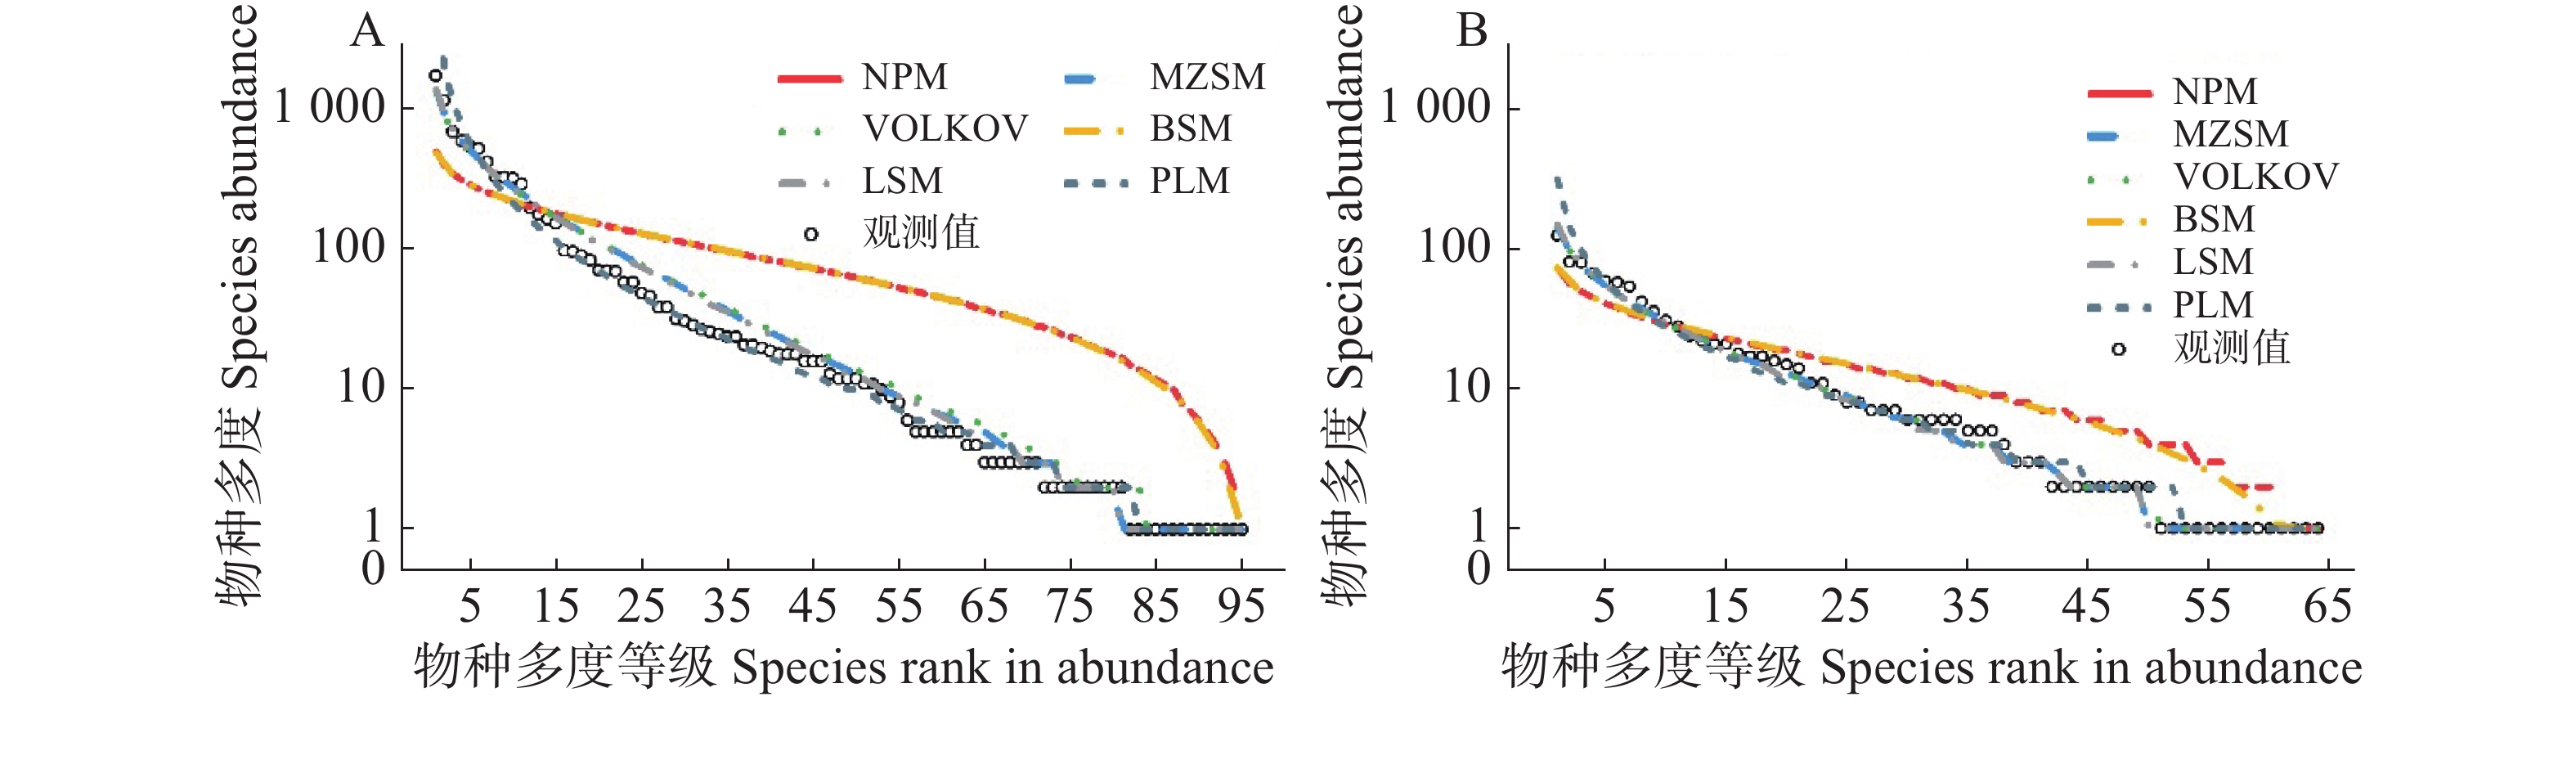
通过拟合6种模型来估计常绿与落叶物种的物种多度分布格局。经K-S检验,6个模型除了断棍模型和生态位优先占领模型两个生态位模型外,其余4个模型均在可接受范围内,且都很好地拟合了数据,并且AIC值在模型之间保持了很小的差异(表2)。根据AIC值和K-S检验结果判断,在常绿物种中,剩余4种模型对物种多度分布的拟合优度排序依次是:对数级数模型>复合群落零和多项式模型>对数正态模型>Volkov模型,断棍模型和生态位优先占领模型的K-S检验P值<0.001,2个被拒绝;在落叶树种中,剩余4种模型对物种-多度分布的拟合优度排序依次是:复合群落零和多项式模型>对数级数模型> Volkov模型>对数正态模型,断棍模型和生态位优先占领模型的K-S检验P值均小于0.05,分别为0.043和0.044,2个模型被拒绝。不同的模型对两类生活型中常见种、中间种和稀有种有着不同的拟合效果(图3)。
表 2 6个模型对常绿与落叶物种的物种–多度分布拟合优度检验
Table 2. Goodness-of-fit test of six models for the species-abundance distribution of evergreen and deciduous woody plants
生活型 Life form 模型 Model AIC D P 常绿物种
Evergreen species对数级数模型 Log-series model 884.8 0.084 0.793 对数正态模型 Poisson-lognormal model 888.0 0.053 0.991 断棍模型 Broken-stick model 1 065.7 0.432 <0.001 生态位优先占领模型 Niche preemption model 1 060.6 0.432 <0.001 复合群落零和多项式模型
Metacommunity zero-sum multinominal distribution model885.0 0.084 0.817 Volkov 模型 Volkov model 888.3 0.095 0.699 落叶树种
Deciduous species对数级数模型 Log-series model 445.5 0.063 0.988 对数正态模型 Poisson-lognormal model 451.5 0.063 0.986 生态位优先占领模型 Niche preemption model 478.2 0.234 0.044 断棍模型 Broken-stick model 481.5 0.234 0.043 复合群落零和多项式模型
Metacommunity zero-sum multinominal distribution model445.3 0.063 0.993 Volkov 模型 Volkov model 447.5 0.047 0.999 注:AIC为赤池信息准则;D为K-S检验统计量。
Note: AIC means Akaike information criterion; D means Statistic of K-S test.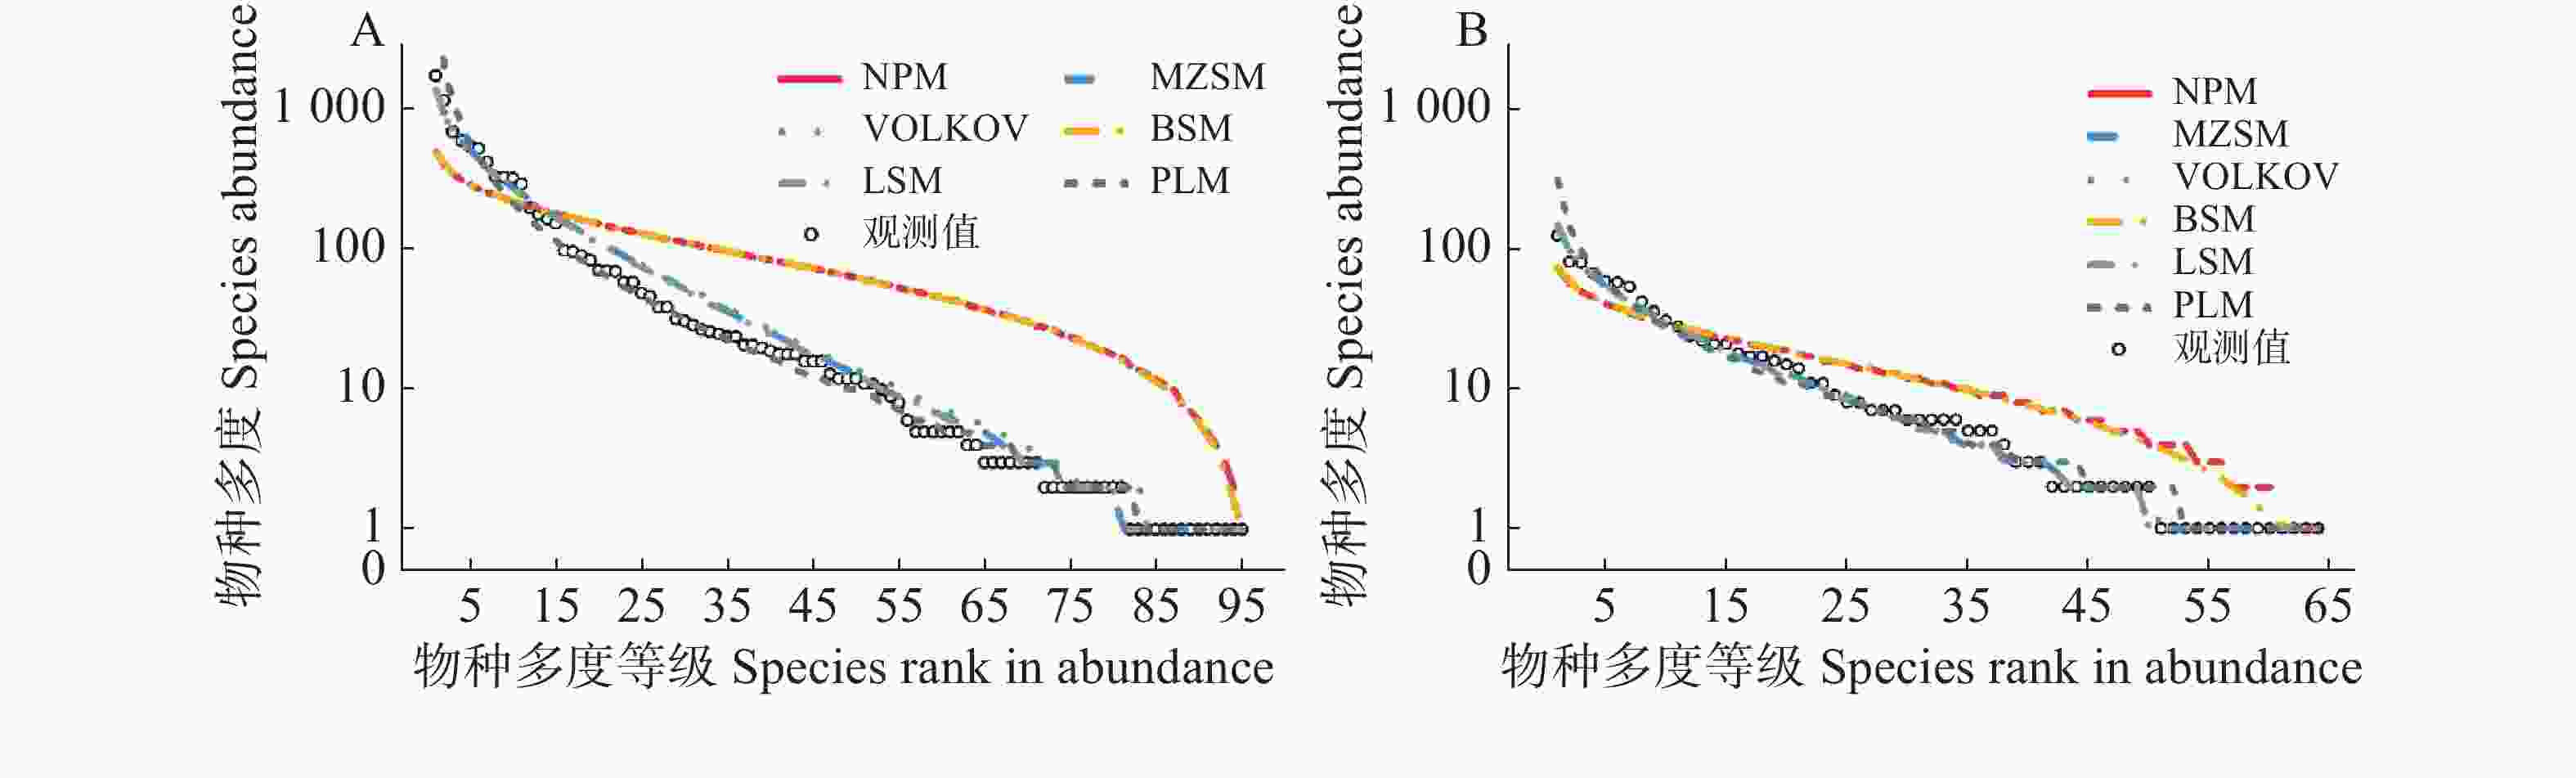
图 3 大岗山2 hm2样地内常绿与落叶物种多度分布及模型拟合
Figure 3. The species–abundance distribution and model fitting for evergreen and deciduous species at the 2 ha plot in Dagang Mountain
-
累计经验函数分布图可以突出不同生活型树种之间的物种多度分布格局差异,解释稀有种、中间种和常见种的物种组成[23]。多种模型拟合的物种多度分布格局的应用可以更好地解释群落的生态学意义[27]。对大岗山2 hm2样地中两类生活型物种分布格局进行对比和分析,结果表明,两类生活型物种在数量比例、重要值方面存在明显差异。在物种分布格局的角度来说,两类生活型物种没有显著区别(图1)。由此推论:尽管这两类生活型物种在大岗山常绿阔叶林群落中的重要性差别很大,但主导其各自物种多度分布格局形成的生态学过程有可能是相似的,这与笔者在文中的假设恰恰相反。在大岗山样地内的70个落叶树种中,稀有种的比例占13.55%,而常绿树种中,稀有种比例为13.85%,两种生活型树种稀有种比例相似,这与朱强等[28]在常绿落叶阔叶混交林中的研究结果相反,说明常绿阔叶林与常绿阔叶落叶混交林之间物种组成的差异。而方晓峰等[29]的在常绿阔叶林的研究中,常绿树种和落叶树种的稀有种比例分别为24.7%和46.8%,与本研究结果在数值存在极大的差异,说明不同地区常绿阔叶林群落组成受到生境异质性的影响。从多度排序上看,常绿物种中前23位物种的多度之和便占到常绿物种总多度的90%;落叶树种中的前29位多度之和也占到落叶物质的总多度的90%,说明两类生活型树种都存在少数物种占较大优势的情况。
纯统计模型和中性理论模型可以很好地拟合两类生活型物种的多度分布格局,但是两个生态位模型则被拒绝,这可能是由于大岗山森林的群落维持机制更多是由中性过程主导的,大岗山样地森林为成熟的常绿阔叶林,其常绿树种和落叶树种的数量比例等都已相对稳定,生态位过程可能并不明显[30]。本研究的结果与天童山样地中的结果基本相似[22]。而在温带的针阔混交林中,则出现了相反的结果[31],这可能与环境异质性有关。例如,热带森林群落比亚热带森林受中性过程的影响更大,中性理论模型能更好地解释其中机理[32]。在北方针叶林中,生态位模型适用于解释油松林的分布机制,但对于其中的乔、灌、草3层,中性理论模型均不被接受[25]。有研究结果表明,针叶林和阔叶混交林群落在不同演替阶段的随机过程是决定中、大样本尺度下物种多度分布格局模式的主要生态驱动力,草本层的物种多度分布模式随生长季节而变化,在长白山北温带森林阔叶红松混交群落中,中性模型的表现优于生态位模型[33-35]。此外,取样尺度也会影响物种分布格局,在不同的取样尺度下存在着不同的生态过程[36]。在较小的取样尺度下,中性模型和生态位模型比纯统计模型有更好的拟合优度,随着取样面积的增大,生态位模型的拟合效果会明显减弱直至被淘汰[37]。随着空间尺度的增加,中性过程逐渐取代生态位过程,成为维持物种分布格局的主要机制[38]。这也解释了生态位过程和中性过程并非两种相互排斥的极端,它们之间会随着取样尺度不断转化[39]。因此,取样尺度可能对生态位-中性连续体中群落的最终位置产生重要影响。一个群落的位置不仅取决于其内在特征,而且取决于驱动群落动态的生态位和中性过程的相互作用。虽然群落可能或多或少是中性的,但没有任何一个群落是真正中性的或完全基于生态位的;因此生态位-中性连续体的顶端只存在于理论上[40]。
在生态学中,格局和过程的关系并非一一对应,而根据格局反推其形成机制的方法必然存在局限性[41]。不同物种之间在生态习性、复杂地形、竞争排斥、生态位分化和演替过程上的明显差异可能导致某些模式潜在的特异性被掩盖,因此,单纯地利用物种多度分布格局无法完全解释其背后的生态学机制。基于此,笔者初步认为在大岗山常绿阔叶林中,相比于生态位过程,中性过程对常绿和落叶两类生活型物种的多度分布格局的起着更重要的作用。
Distribution of species abundance of different plant life forms in the evergreen broadleaf forest in Dagang Mountain
-
摘要: 为了揭示江西大岗山常绿阔叶林内常绿和落叶物种的多度分布格局,以及主导两类生活型物种群落构建的主要生态学过程,建立2 hm2长期固定样地并进行群落生态学调查。使用累积经验分布函数量化两类生活型物种的分布特征,利用6种物种分布模型进行数据拟合,采用Akaike信息准则(AIC)和Kolmogorov-Smirnov检验拟合效果。结果表明,在大岗山常绿阔叶林内,常绿树种重要值前3位分别是丝栗栲(Castanopsis fargesii)、青冈(Cyclobalanopsis glauca)、鹿角杜鹃(Rhododendron latoucheae);落叶物种重要值前3位分别是赤杨叶(Alniphyllum fortunei)、山乌桕(Sapium discolor)和木油桐(Vcmicia Montana)。两类生活型物种多度分布曲线均呈现出一定的S形,两者之间并无显著差异,除了生态位模型外,纯统计模型和中性理论模型均可接受。中性过程对两类生活型物种的物种多度分布格局形成有重要影响。Abstract: In order to reveal abundance distribution patterns of evergreen and deciduous trees in the same community and the major ecologic process of the community establishment by plant species of two leading plant life forms, a community ecological survey was conducted at the permanent plot with an area of 2 ha at the broadleaf evergreen forest in Dagan Mountain, Jiangxi Province. The distribution features of the plants of two different life forms were quantified by using the cumulative empirical distribution function, and fitted by using 6 distribution models. The goodness of fit of the 6 models were tested by using Akaike information criterion (AIC) and Kolmogorov-Smimov Test. The results showed that the top three evergreen tree species arranged by the importance value are Castanopsis fargesii, Cyclobalanopsis glauca and Rhododendron latoucheae in the broadleaf evergreen forest in Dagang Mountain, while the three deciduous tree species arranged by the importance value are Alniphyllum fortune, Sapium discolor and Vernicia montana. The distribution curves of the plant species of the two life forms in Dagang Mountain were all in a S shape and were not significantly different. The pure statistical model and the neutral theoretical model except the niche models were acceptable. Neutral processes play an important role in the formation of species-abundance distribution patterns of two plant life forms.
-
Key words:
- species abundance distribution /
- model fitting /
- niche model /
- Dagang Mountain
-
图 3 大岗山2 hm2样地内常绿与落叶物种多度分布及模型拟合
A为常绿树种,B为落叶树种。
Fig. 3 The species–abundance distribution and model fitting for evergreen and deciduous species at the 2 ha plot in Dagang Mountain
A and B represent evergreen species and deciduous species, respectively.
表 1 大岗山2 ha样地内两种生活型物种中重要值排名前十的木本植物
Table 1 The top 10 species of evergreen and deciduous woody plants arranged by the importance value at a 2 ha plot in Dagang Mountain
排名 Rank 常绿物种 Evergreen species 重要值 IV 排名 Rank 落叶树种 Deciduous species 重要值 IV 1 丝栗栲(Castanopsis fargesii) 13.35 1 赤杨叶(Alniphyllum fortunei) 10.98 2 青冈(Cyclobalanopsis glauca) 13.00 2 山乌桕(Sapium discolor) 9.98 3 鹿角杜鹃(Rhododendron latoucheae) 8.86 3 木油桐(Vernicia montana) 8.98 4 木荷(Schima superba) 4.54 4 野漆(Toxicodendron succedaneum) 4.81 5 黄牛奶树(Symplocos laurina) 4.50 5 八角枫(Alangium chinense) 4.62 6 刨花润楠(Machilus pauhoi) 4.27 6 枫香树(Liquidambar formosana) 3.84 7 油茶(Camellia oleifera) 3.87 7 野茉莉(Tyrax japonicus) 3.79 8 杉木(Cunninghamia lanceolata) 3.52 8 雷公鹅耳枥(Carpinus viminea) 3.61 9 细枝柃(Eurya loquaiana) 3.49 9 浙江柿(Diospyros glaucifolia) 2.84 10 格药柃(Eurya muricata) 2.88 10 檫木(Sassafras tzumu) 2.84  下载: 导出CSV
表 2 6个模型对常绿与落叶物种的物种–多度分布拟合优度检验
Table 2 Goodness-of-fit test of six models for the species-abundance distribution of evergreen and deciduous woody plants
生活型 Life form 模型 Model AIC D P 常绿物种
Evergreen species对数级数模型 Log-series model 884.8 0.084 0.793 对数正态模型 Poisson-lognormal model 888.0 0.053 0.991 断棍模型 Broken-stick model 1 065.7 0.432 <0.001 生态位优先占领模型 Niche preemption model 1 060.6 0.432 <0.001 复合群落零和多项式模型
Metacommunity zero-sum multinominal distribution model885.0 0.084 0.817 Volkov 模型 Volkov model 888.3 0.095 0.699 落叶树种
Deciduous species对数级数模型 Log-series model 445.5 0.063 0.988 对数正态模型 Poisson-lognormal model 451.5 0.063 0.986 生态位优先占领模型 Niche preemption model 478.2 0.234 0.044 断棍模型 Broken-stick model 481.5 0.234 0.043 复合群落零和多项式模型
Metacommunity zero-sum multinominal distribution model445.3 0.063 0.993 Volkov 模型 Volkov model 447.5 0.047 0.999 注:AIC为赤池信息准则;D为K-S检验统计量。
Note: AIC means Akaike information criterion; D means Statistic of K-S test.
下载: 导出CSV
-
[1] LUÍS BORDA-DE-ÁGUA, BORGES P A V, HUBBELL S P, et al. Spatial scaling of species abundance distributions [J]. Ecography, 2012, 35(6): 549 − 556. doi: 10.1111/j.1600-0587.2011.07128.x [2] MAGURRAN A E, HENDERSON P A. Explaining the excess of rare species in natural species abundance distributions [J]. Nature, 2003, 422(6933): 714 − 716. doi: 10.1038/nature01547 [3] LEFCHECK J S, BYRNES J E K, ISBELL F, et al. Biodiversity enhances ecosystem multifunctionality across trophic levels and habitats [J]. Nature Communications, 2015, 6: 6936. doi: 10.1038/ncomms7936 [4] ULRICH W, OLLIK M, UGLAND K I. A meta-nalysis of species–abundance distributions [J]. Oikos, 2010, 119(7): 1149 − 1155. doi: 10.1111/j.1600-0706.2009.18236.x [5] GREEN J L, PLOTKIN J B. A statistical theory for sampling species abundances [J]. Ecology Letters, 2010, 10(11): 1037 − 1045. [6] MCGILL B J, ETIENNE R S, GRAY J S, et al. Species abundance distributions [J]. Ecology Letters, 2007, 10(10): 995 − 1015. doi: 10.1111/j.1461-0248.2007.01094.x [7] MOTOMURA I. A statistical treatment of ecological communities [J]. Zoological Magazine, 1932, 44: 379 − 383. [8] FISHER R A, CORBET A S, WILLIAMS C B. The relation between the number of species and the number of individuals in a random sample of an animal population [J]. Journal of Animal Ecology, 1943, 12(1): 42 − 58. doi: 10.2307/1411 [9] PRESTON F W. The canonical distribution of commonness and rarity: Part I [J]. Ecology, 1962, 43(2): 185 − 215. doi: 10.2307/1931976 [10] MACARTHUR R H. On the relative abundance of bird species [J]. Proc. Nat. Acad Sci. USA, 1957, 43(3): 293 − 295. doi: 10.1073/pnas.43.3.293 [11] ALONSO D, MCKANE A J. Sampling Hubbell’s neutral theory of biodiversity [J]. Ecology Letters, 2004, 7(10): 901 − 910. doi: 10.1111/j.1461-0248.2004.00640.x [12] VOLKOV I., BANAVAR J., HUBBELL S, et al Neutral theory and relative species abundance in ecology [J]. Nature, 2003, 424: 1035 − 1037. doi: 10.1038/nature01883 [13] GILBERT B, LECHOWICZ M J. Neutrality, niches, and dispersal in a temperate forest understory [J]. Proceedings of the National Academy of Sciences of the United States of America, 2004, 101(20): 7651 − 7656. doi: 10.1073/pnas.0400814101 [14] CHAVE J. Neutral theory and community ecology [J]. Ecology Letters, 2004, 7(3): 241 − 253. doi: 10.1111/j.1461-0248.2003.00566.x [15] 马克明. 物种多度格局研究进展[J]. 植物生态学报, 2003(3): 412 − 426. [16] JIN Y, QIAN H, YU M J, et al. Phylogenetic structure of tree species across different life stages from seedlings to canopy trees in a subtropical evergreen broad-leaved forest [J]. Plos One, 2015, 10(6): e0131162. doi: 10.1371/journal.pone.0131162 [17] 于水强, 王静波, 郝倩葳, 等. 四种不同生活型树种细根寿命及影响因素[J]. 生态学报, 2020, 40(9): 3040 − 3047. [18] 藏亚静, 韦博良, 许宁, 等. 宝天曼国家级自然保护区不同生活型物种及不同径级的点格局分析[J]. 河南农业大学学报, 2016, 50(4): 528 − 536. [19] 白坤栋, 莫凌, 刘铭, 等. 广西猫儿山不同海拔常绿和落叶树种的营养再吸收模式[J]. 生态学报, 2015(17): 209 − 220. [20] 姚志良, 温韩东, 邓云, 等. 哀牢山亚热带中山湿性常绿阔叶林树种beta多样性格局形成的驱动力[J]. 生物多样性, 2020, 28(4): 48 − 57. [21] 姚良锦, 姚兰, 易咏梅, 等. 亚热带常绿落叶阔叶混交林优势种川陕鹅耳枥和多脉青冈的空间格局[J]. 林业科学, 2018, 54(12): 1 − 11. [22] 谢玉彬, 马遵平, 杨庆松, 等. 基于地形因子的天童地区常绿树种和落叶树种共存机制研究[J]. 生物多样性, 2012, 20(2): 159 − 167. [23] MATTHEWS T J, WHITTAKER R J. On the species abundance distribution in applied ecology and biodiversity management [J]. Journal of Applied Ecology, 2015, 52(2): 443 − 454. doi: 10.1111/1365-2664.12380 [24] ROMINGER A J, MILLER T E X, COLLINS S L. Relative contributions of neutral and niche-based processes to the structure of a desert grassland grasshopper community [J]. Oecologia, 2009, 161(4): 791 − 800. doi: 10.1007/s00442-009-1420-z [25] 毕润成, 闫明, 高利霞. 山西霍山油松林的物种多度分布格局[J]. 植物生态学报, 2011, 35(12): 1256 − 1270. [26] SEKHON J S. Multivariate and propensity score matching software with automated balance optimization: The matching package for R [J]. Journal of Statistical Software, 2011, 42(7): 52. [27] 徐炜, 马志远, 井新, 等. 生物多样性与生态系统多功能性: 进展与展望[J]. 生物多样性, 2016, 24(1): 55 − 71. [28] 朱强, 艾训儒, 姚兰, 等. 鄂西南亚热带山地常绿落叶阔叶混交林物种多度分布格局[J]. 西北植物学报, 2020, 40(6): 1061 − 1069. [29] 方晓峰, 杨庆松, 刘何铭, 等. 天童常绿阔叶林中常绿与落叶物种的物种多度分布格局[J]. 生物多样性, 2016, 24(6): 629 − 638. [30] 宋庆丰, 王兵, 牛香, 等. 江西大岗山低海拔常绿阔叶林物种组成与群落结构特征[J]. 生态学杂志, 2020, 39(2): 384 − 393. [31] 闫琰, 张春雨, 赵秀海. 长白山不同演替阶段针阔混交林群落物种多度分布格局[J]. 植物生态学报, 2012, 36(9): 923 − 934. [32] CHISHOLM R A, PACALA S W. Theory predicts a rapid transition from niche-structured to neutral biodiversity patterns across a speciation-rate gradient [J]. Theoretical Ecology, 2011, 4(2): 195 − 200. doi: 10.1007/s12080-011-0113-5 [33] 曹琳琳, 苏宝玲, 周旺明, 等. 长白山区典型植被类型物种多样性空间分布的尺度效应[J]. 生态学杂志, 2017, 36(11): 3102 − 3108. [34] 张姗, 蔺菲, 原作强, 等. 长白山阔叶红松林草本层物种多度分布格局及其季节动态[J]. 生物多样性, 2015, 23(5): 641 − 648. [35] 杜宇凡, 古琛, 乌力吉, 等. 不同载畜率下短花针茅荒漠草原物种多度格局[J]. 生态学杂志, 2016, 35(3): 675 − 683. [36] 陈俊, 艾训儒, 姚兰, 等. 木林子天然次生林典型群落物种多度分布格局的尺度效应[J]. 湖北民族学院学报(自然科学版), 2018, 36(2): 130 − 133, 202. [37] WU A, DENG X, HE H, et al. Responses of species abundance distribution patterns to spatial scaling in subtropical secondary forests [J]. Ecology and Evolution, 2019, 2019(2): 1 − 10. [38] 程佳佳, 米湘成, 马克平, 等. 亚热带常绿阔叶林群落物种多度分布格局对取样尺度的响应[J]. 生物多样性, 2011, 19(2): 168 − 177. [39] FISHER C K, MEHTA P. The transition between the niche and neutral regimes in ecology [J]. Proceedings of the National Academy of Sciences of the United States of America, 2014, 111(36): 13111 − 13116. doi: 10.1073/pnas.1405637111 [40] ADLER P B, Hillerislambers J, Levine J M. A niche for neutrality [J]. Ecology Letters, 2007, 10(2): 95 − 104. doi: 10.1111/j.1461-0248.2006.00996.x [41] ETIENNE R S. A new sampling formula for neutral biodiversity [J]. Ecology Letters, 2010, 8(3): 253 − 260. -

 点击查看大图

计量
- 文章访问数: 928
- HTML全文浏览量: 176
- PDF下载量: 40
- 被引次数: 0


