2022 Vol. 13, No. 4
2022, 13(4): 315-323.
doi: 10.15886/j.cnki.rdswxb.2022.04.001
Abstract:
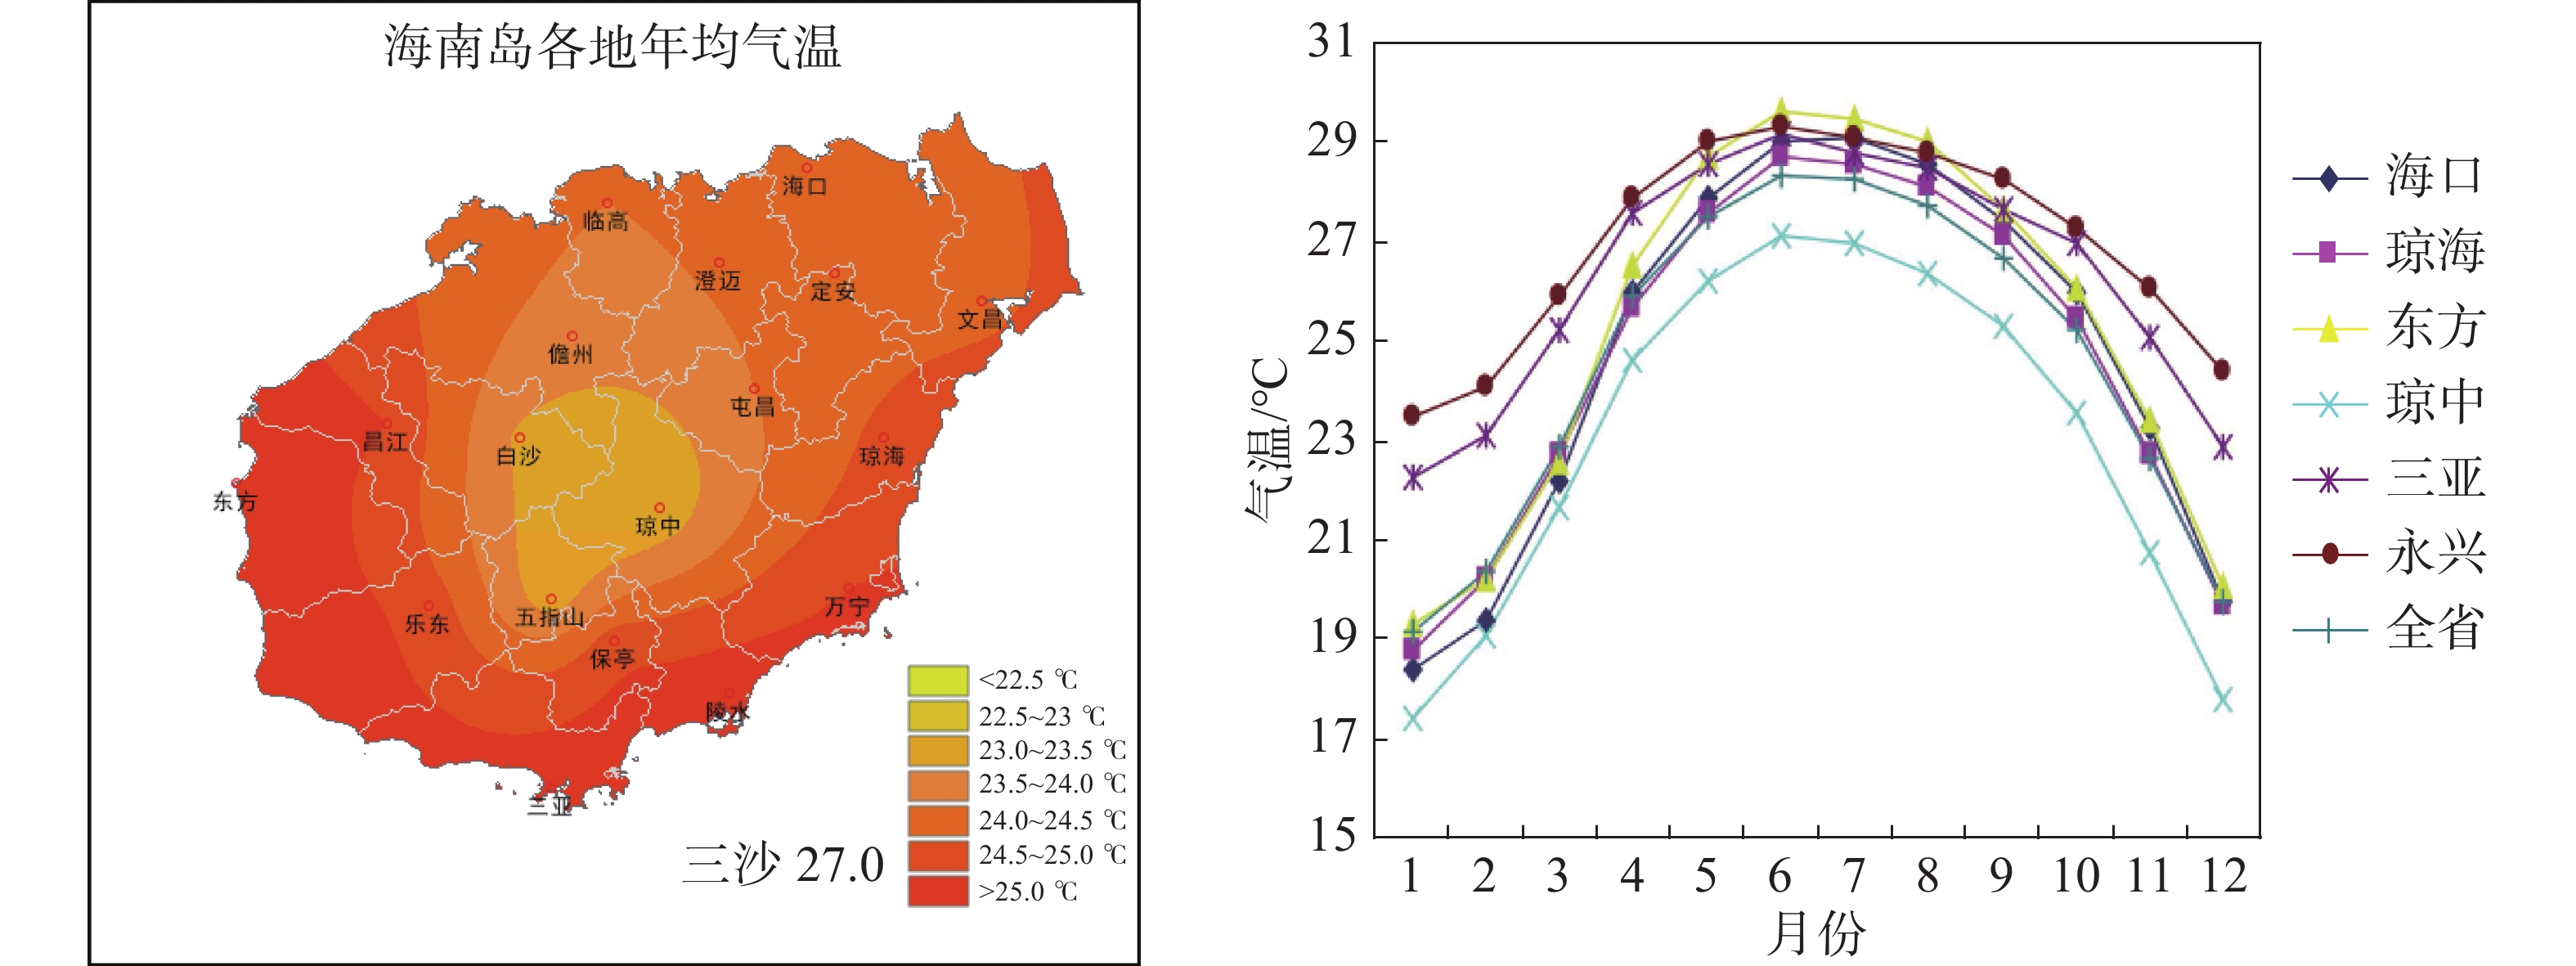
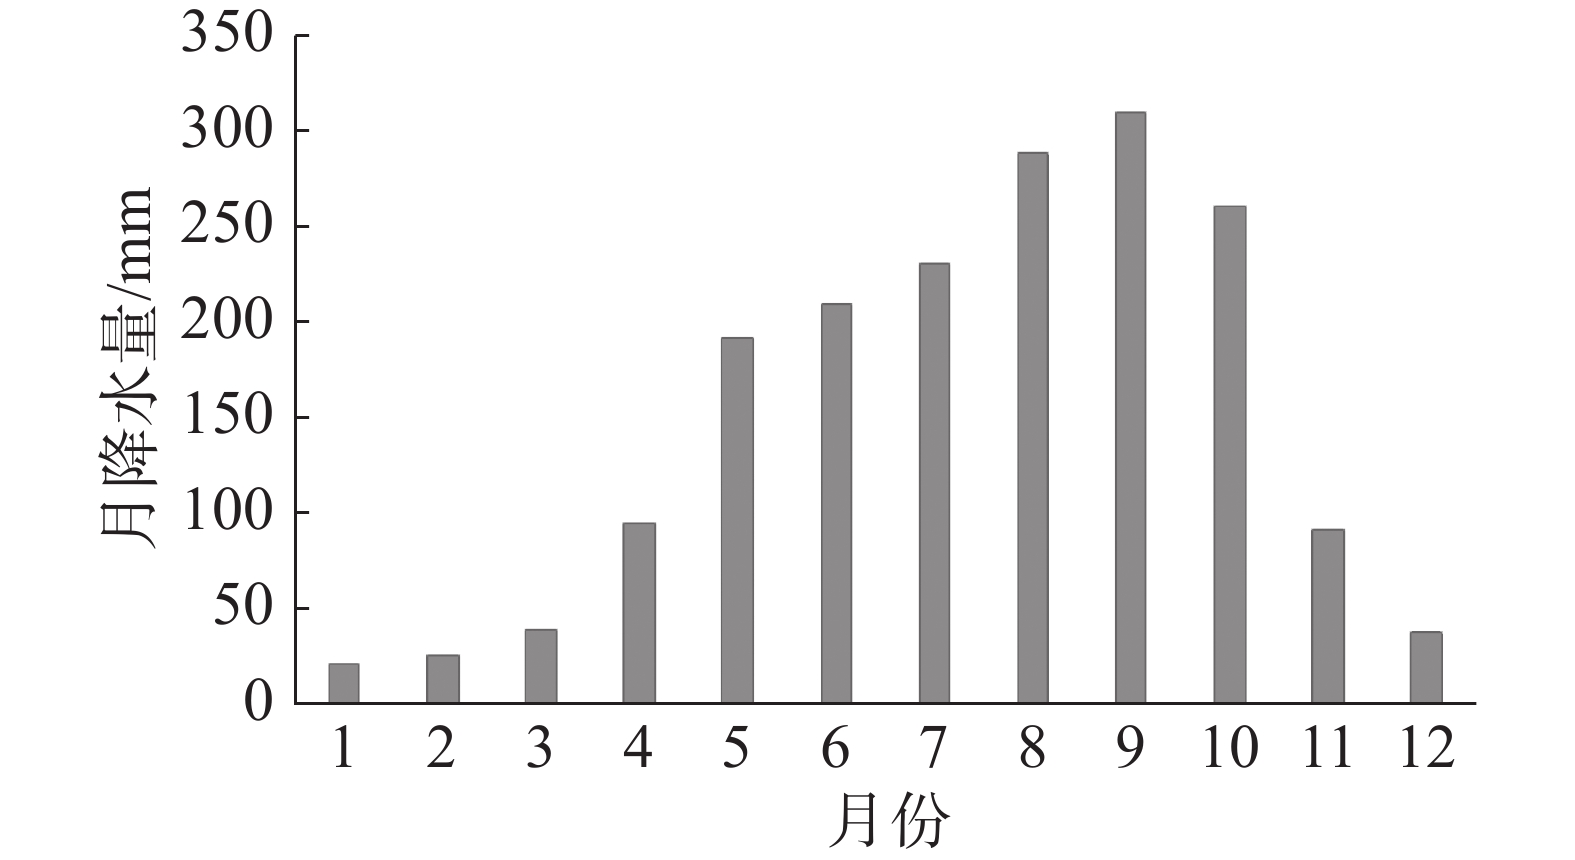
Based on the daily and monthly meteorological observation data from 19 meteorological stations in Hainan, an analysis was made of the important climatic characteristics in Hainan, especially Hainan Island from the states of climate, extremes and disasters. The results show that the average annual temperature in Hainan is higher than 23 ℃, lower in the middle mountainous area and higher in the coastal area. The monthly variation of the temperature shows an almost symmetrical unimodal distribution, with the peak in June to July. The annual mean rainfall is over 900 mm, highly different between the east and the west of Hainan island, with the highest being above 2 000 mm in the east and the windward side of the southeast of Wuzhishan Mountain. The monthly rainfall shows a staircase asymmetrical unimodal distribution, with the peak in September. The annual sunshine hours are over 1 700 h, higher in the coastal area than in the northern inland and central mountainous areas, and their monthly variation has a bimodal distribution, with the primary peak in July and the secondary one in May, and the valley in February, showing a distinct feature of rain, heat and light in the same season. The extreme maximum temperature in Hainan Island is above 38 ℃, higher in the north than in the south, with the highest being upto 41.1 ℃ in the high value centers; the extreme minimum temperature in the central mountain area is lower than that in the surrounding areas, and is close to or lower than 0 ℃, with the lowest being −1.4 ℃. The maximum annual rainfall in each region is over 1500mm, and the minimum annual rainfall is below 1 500 mm; the longest stretch of consecutive days of rainfall is more than 26 days, and occurs mostly in August to September, and the longest stretch of continuous days of no rainfall is close to or more than 30 days; the maximum daily rainfall in each region is more than 300 mm, and the maximum rainfall is more than 600 mm. High temperature occurs mainly in May to July in Hainan Island, and the average days with high temperature are about 20 days, more in the north than in the south. The low temperature and rainy processes are common in the north of Wuzhishan mountain, where annual low temperature and rainy processes occur once or twice, about 10 days, but rare in the south of Wuzhishan mountain. The average annual rainstorm days of the whole island is about 8 days, and their monthly distribution is asymmetrically unimodal. The number of rainstorm days increases slowly from May to October, and decrease dramatically from October to November. Rainstorm which happens over half of the island is very low in probability, and that over the whole island is very rare, but all occurred after 2 000. Drought is common in the island, and it occurs frequently in winter and spring in the west and the south coast of the island. Continuous drought in other areas of the island is also observed in winter and spring when there is low typhoon rainfall in the autumn.
Based on the daily and monthly meteorological observation data from 19 meteorological stations in Hainan, an analysis was made of the important climatic characteristics in Hainan, especially Hainan Island from the states of climate, extremes and disasters. The results show that the average annual temperature in Hainan is higher than 23 ℃, lower in the middle mountainous area and higher in the coastal area. The monthly variation of the temperature shows an almost symmetrical unimodal distribution, with the peak in June to July. The annual mean rainfall is over 900 mm, highly different between the east and the west of Hainan island, with the highest being above 2 000 mm in the east and the windward side of the southeast of Wuzhishan Mountain. The monthly rainfall shows a staircase asymmetrical unimodal distribution, with the peak in September. The annual sunshine hours are over 1 700 h, higher in the coastal area than in the northern inland and central mountainous areas, and their monthly variation has a bimodal distribution, with the primary peak in July and the secondary one in May, and the valley in February, showing a distinct feature of rain, heat and light in the same season. The extreme maximum temperature in Hainan Island is above 38 ℃, higher in the north than in the south, with the highest being upto 41.1 ℃ in the high value centers; the extreme minimum temperature in the central mountain area is lower than that in the surrounding areas, and is close to or lower than 0 ℃, with the lowest being −1.4 ℃. The maximum annual rainfall in each region is over 1500mm, and the minimum annual rainfall is below 1 500 mm; the longest stretch of consecutive days of rainfall is more than 26 days, and occurs mostly in August to September, and the longest stretch of continuous days of no rainfall is close to or more than 30 days; the maximum daily rainfall in each region is more than 300 mm, and the maximum rainfall is more than 600 mm. High temperature occurs mainly in May to July in Hainan Island, and the average days with high temperature are about 20 days, more in the north than in the south. The low temperature and rainy processes are common in the north of Wuzhishan mountain, where annual low temperature and rainy processes occur once or twice, about 10 days, but rare in the south of Wuzhishan mountain. The average annual rainstorm days of the whole island is about 8 days, and their monthly distribution is asymmetrically unimodal. The number of rainstorm days increases slowly from May to October, and decrease dramatically from October to November. Rainstorm which happens over half of the island is very low in probability, and that over the whole island is very rare, but all occurred after 2 000. Drought is common in the island, and it occurs frequently in winter and spring in the west and the south coast of the island. Continuous drought in other areas of the island is also observed in winter and spring when there is low typhoon rainfall in the autumn.
2022, 13(4): 324-330.
doi: 10.15886/j.cnki.rdswxb.2022.04.002
Abstract:
Drought is one of the main meteorological disasters affecting ecology and production in Hainan. The meteorological drought in Hainan Island was analyzed from the perspectives of precipitation distribution, drought causes, dry and wet conditions, water balance and drought monitoring index, in order to provide a reference for relevant decision-making and research. Hainan Island is located on the north edge of the South China Sea. Affected by the tropical monsoon climate and topography, the temporal and spatial distribution of precipitation is uneven. Hainan Island has low precipitation in winter and spring, high in summer and autumn, and spatially higher in the east part than in the west part. From the dry-wet indices, it can be seen that Hainan Island is dry from November to April, and gradually becomes wet since May, and wettest in August, September and October. The actual evapotranspiration of the surface is high in the central mountain area and low in the surrounding plains and terraces. The months with the ratio of abundant precipitation to evapotranspiration are very few in winter and spring (December to April), generally below 20 %. It is particularly seriously dry in the south and west of Hainan Island. The Standardize Precipitation Evapotranspiration index (SPEI) is calculated for different timescales to determine the drought in Hainan. It is found that SPEI for a 6 or 12-months timescale in the dry season and for a 3-months timescale in the wet season can be used to determine the drought in Hainan Island to monitor the occurrence and development of drought in the Island.
Drought is one of the main meteorological disasters affecting ecology and production in Hainan. The meteorological drought in Hainan Island was analyzed from the perspectives of precipitation distribution, drought causes, dry and wet conditions, water balance and drought monitoring index, in order to provide a reference for relevant decision-making and research. Hainan Island is located on the north edge of the South China Sea. Affected by the tropical monsoon climate and topography, the temporal and spatial distribution of precipitation is uneven. Hainan Island has low precipitation in winter and spring, high in summer and autumn, and spatially higher in the east part than in the west part. From the dry-wet indices, it can be seen that Hainan Island is dry from November to April, and gradually becomes wet since May, and wettest in August, September and October. The actual evapotranspiration of the surface is high in the central mountain area and low in the surrounding plains and terraces. The months with the ratio of abundant precipitation to evapotranspiration are very few in winter and spring (December to April), generally below 20 %. It is particularly seriously dry in the south and west of Hainan Island. The Standardize Precipitation Evapotranspiration index (SPEI) is calculated for different timescales to determine the drought in Hainan. It is found that SPEI for a 6 or 12-months timescale in the dry season and for a 3-months timescale in the wet season can be used to determine the drought in Hainan Island to monitor the occurrence and development of drought in the Island.
2022, 13(4): 331-338.
doi: 10.15886/j.cnki.rdswxb.2022.04.003
Abstract:
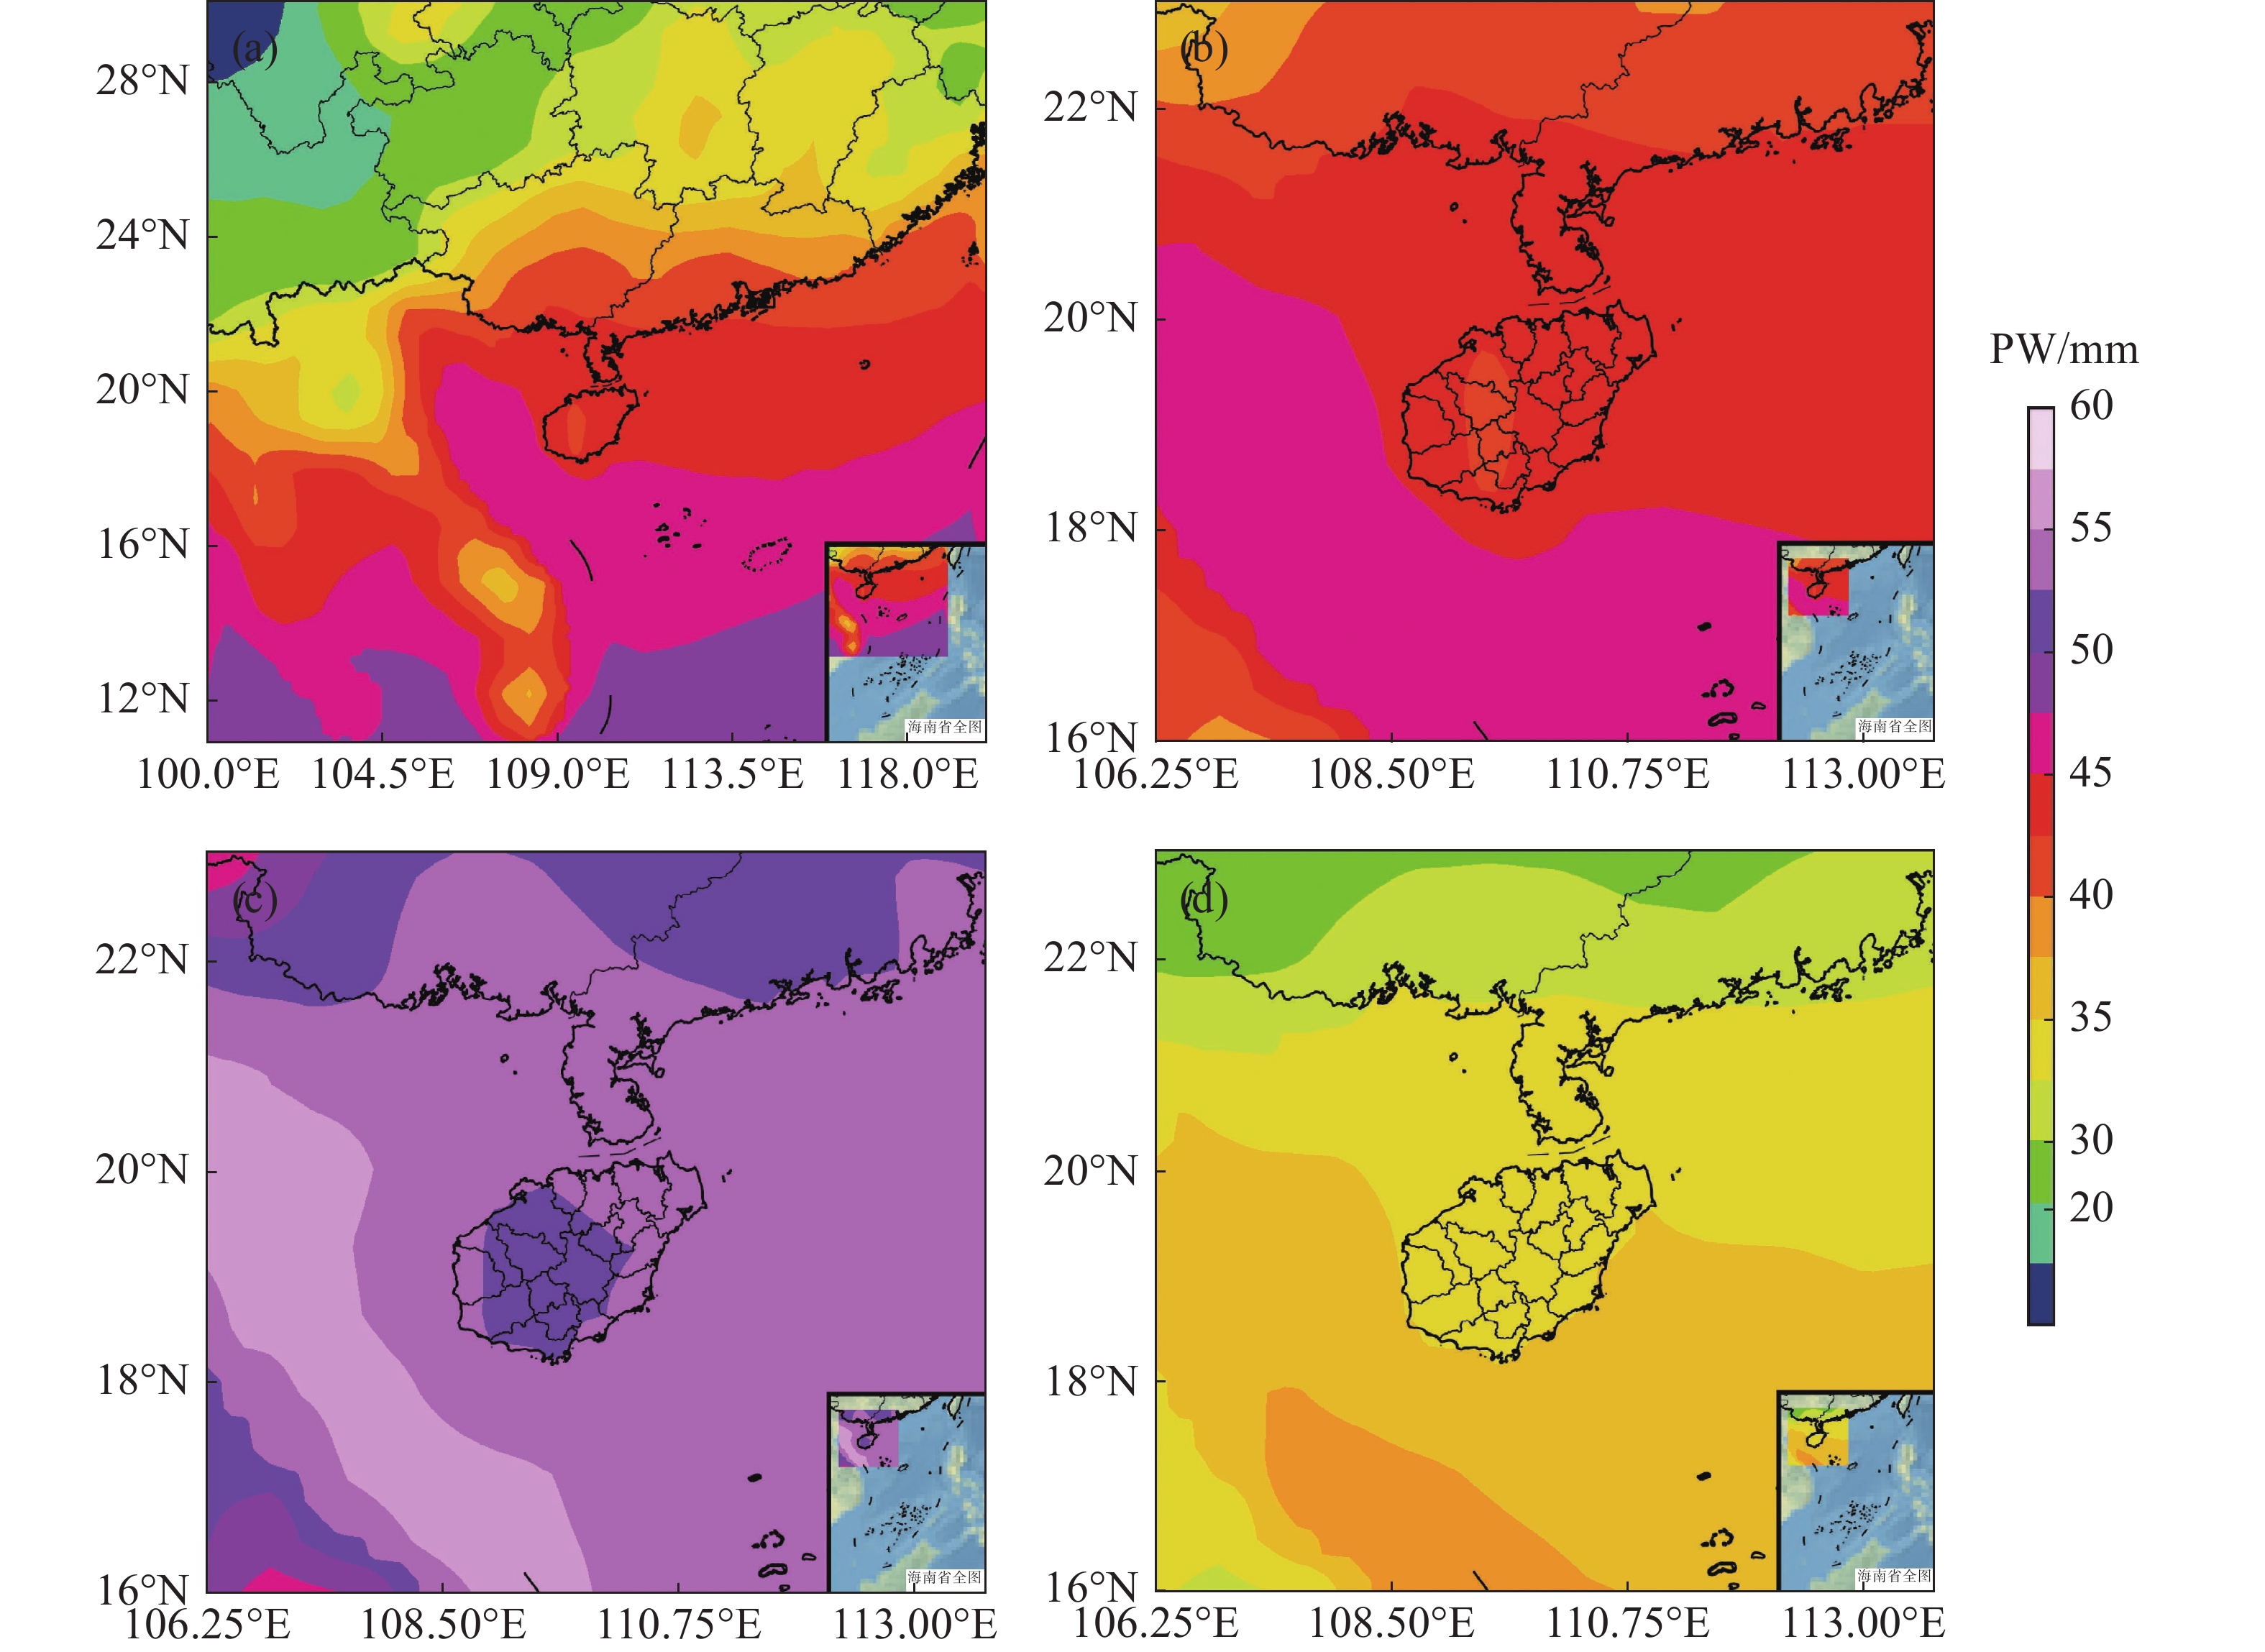
In order to understand temporal and Spatial Characteristics of cloud water resources in Hainan Island, based on data of ERA-I reanalysis from 1981 to 2010, the temporal and spatial distributions of Rainy-Season, Dry-Season and annual mean precipitable water(PW), total cloud cover(TCC), low cloud cover, high cloud cover are analyzed. The results show that the changes of PW over Hainan Island indicate significant variations in temporal and spatial characteristics(southern wet-northern dry). The values of PW and TCC in Rainy-Season are higher than that in Dry-Season and are greater above the ocean than that above land. The low center of annual mean PW over Hainan Island located in WuZhi Mountain of Hainan Island, the value of annual mean PW is high above South China Sea surface. The low(high) value center of annual mean TCC over South China is located in west of Hainan Island and coastal areas over southern China(east of Sichuan Basin), the TCC value in south of South China Sea is second high. The maximum value of TCC value in Rainy-Season and Dry-Season are 63.20% and 54.26%. The clouds of Hainan Island in Rainy-Season are mostly high clouds, with high cloud cover value more than 44%, but in Dry-Season the maximum value of low cloud cover is 41.88%, and the value of high cloud cover is less than 17%, the clouds in Dry-Season are main low clouds. There is a single peak in annual variation of monthly mean PW in Hainan Island with the peak in August. There are also obvious decadal changes about PW and TCC in Hainan Island over the past 30 years.
In order to understand temporal and Spatial Characteristics of cloud water resources in Hainan Island, based on data of ERA-I reanalysis from 1981 to 2010, the temporal and spatial distributions of Rainy-Season, Dry-Season and annual mean precipitable water(PW), total cloud cover(TCC), low cloud cover, high cloud cover are analyzed. The results show that the changes of PW over Hainan Island indicate significant variations in temporal and spatial characteristics(southern wet-northern dry). The values of PW and TCC in Rainy-Season are higher than that in Dry-Season and are greater above the ocean than that above land. The low center of annual mean PW over Hainan Island located in WuZhi Mountain of Hainan Island, the value of annual mean PW is high above South China Sea surface. The low(high) value center of annual mean TCC over South China is located in west of Hainan Island and coastal areas over southern China(east of Sichuan Basin), the TCC value in south of South China Sea is second high. The maximum value of TCC value in Rainy-Season and Dry-Season are 63.20% and 54.26%. The clouds of Hainan Island in Rainy-Season are mostly high clouds, with high cloud cover value more than 44%, but in Dry-Season the maximum value of low cloud cover is 41.88%, and the value of high cloud cover is less than 17%, the clouds in Dry-Season are main low clouds. There is a single peak in annual variation of monthly mean PW in Hainan Island with the peak in August. There are also obvious decadal changes about PW and TCC in Hainan Island over the past 30 years.
2022, 13(4): 339-347.
doi: 10.15886/j.cnki.rdswxb.2022.04.004
Abstract:
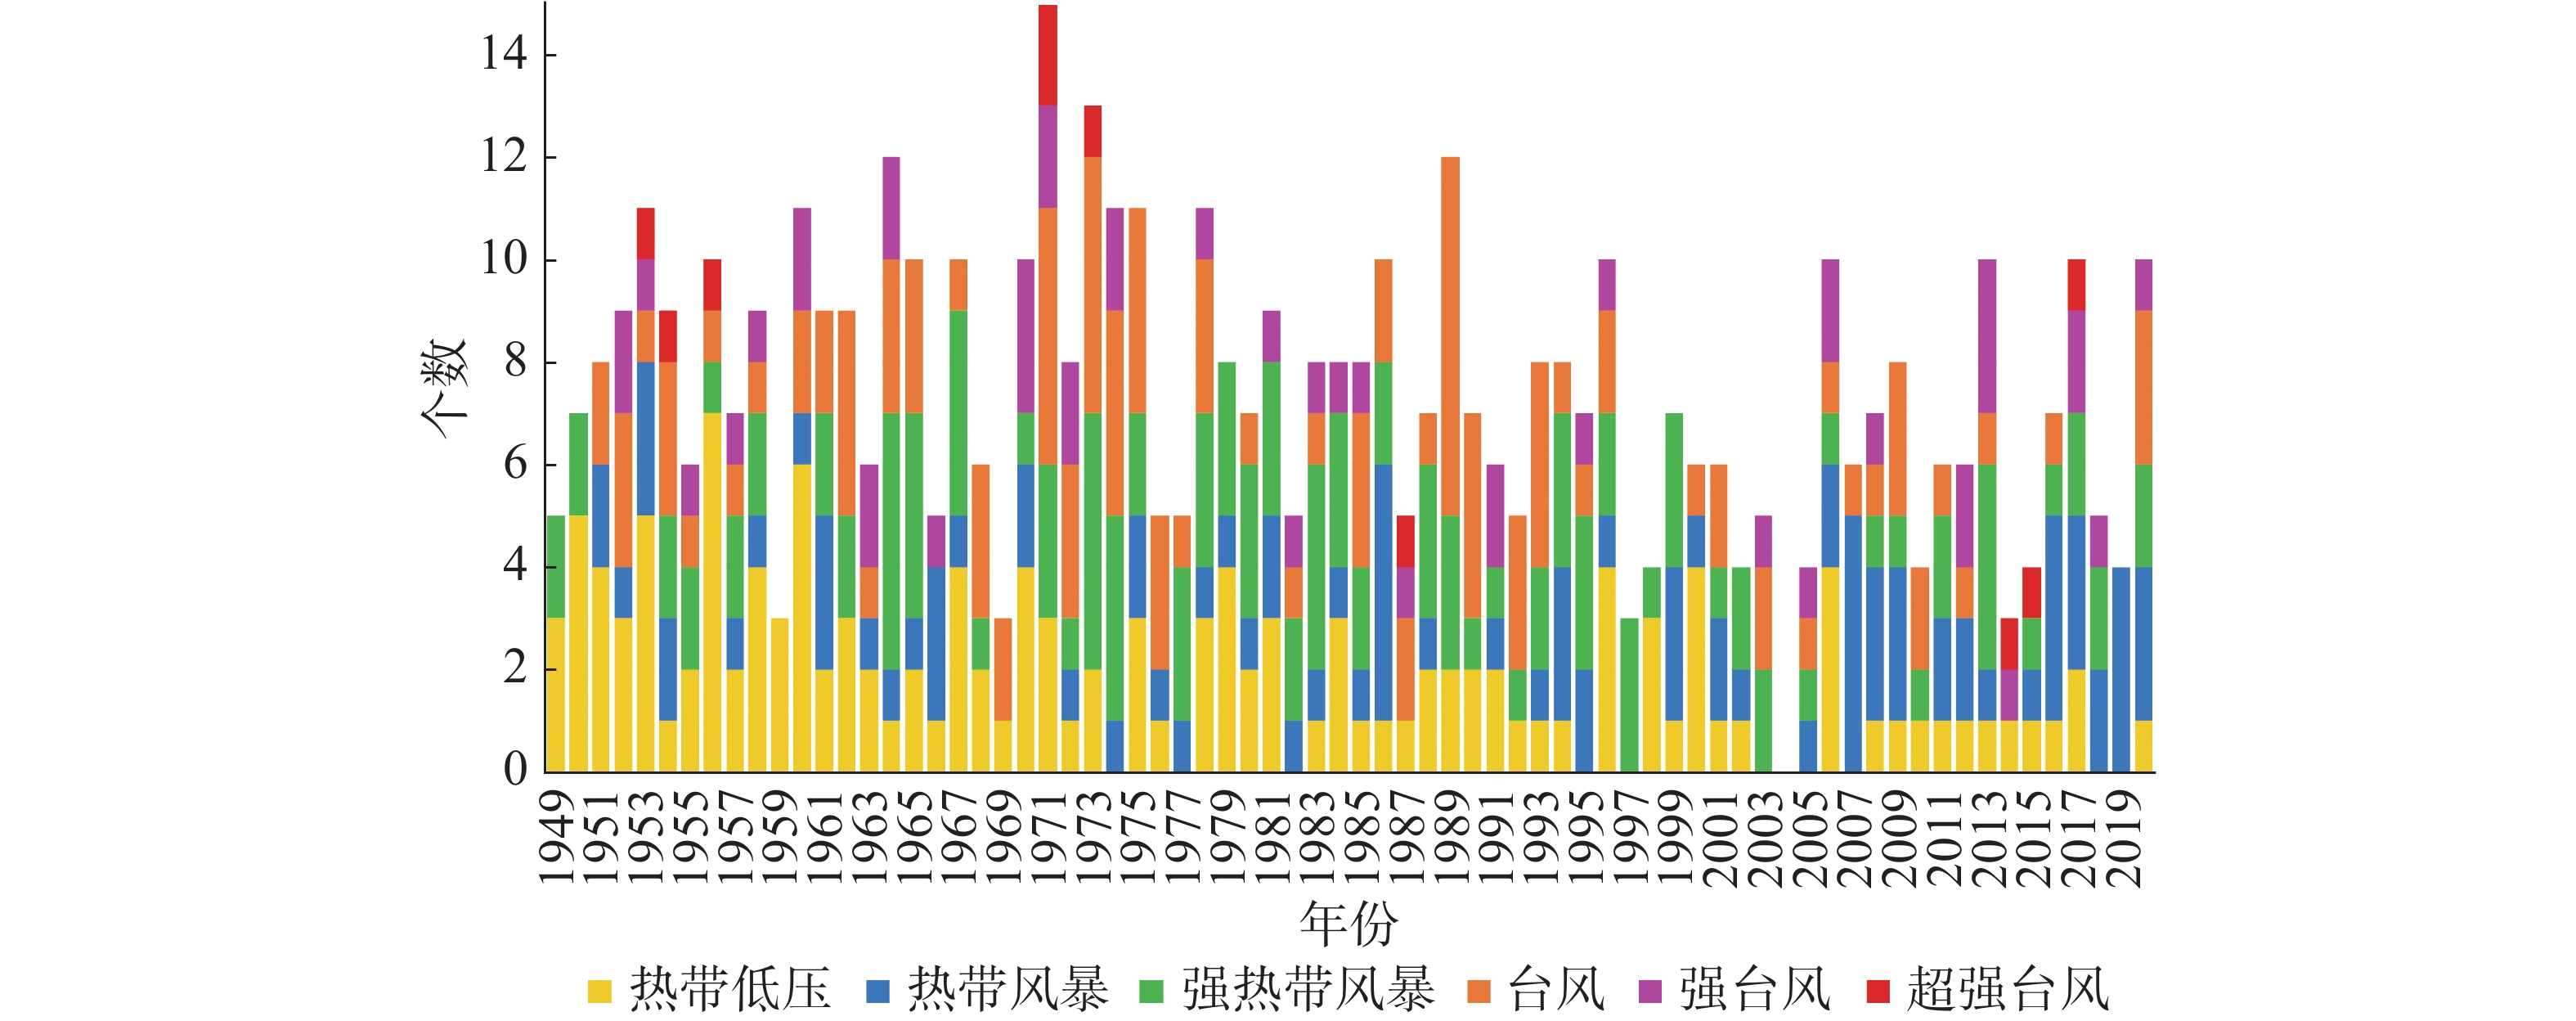
Characteristics of tropical cyclone (TC) activities over Hainan Island in 1949—2020 are statistically analyzed by using the data from the Best Track Dataset for Tropical Cyclones (1949—2020) compiled by Shanghai Tropical Cyclones Institute of the China Meteorological Administration (CMA-STI). Results show that the TCs affecting Hainan Island tended to decrease remarkably, with about 4.857 TCs per decade, especially in the categories of tropical depression and typhoon or higher. The TCs landing Hainan tended to decline slightly, whereas the TCs affecting Hainan tended to increase obviously. TCs landed Hainan frequently in between June to October, with the peak in September. Most TC activities were concentrated at the southeastern part of Hainan Island. The weaker TCs were generated mostly in the northeastern South China Sea while the stronger TCs mostly in between the east of the Philippines and the Caroline Islands. The duration time from a TC landfall to re-entry into the ocean was 10.8 hour on average. The weak (strong) TCs landing Hainan Island were likely to keep (lose) their strength when they crossed the Island.
Characteristics of tropical cyclone (TC) activities over Hainan Island in 1949—2020 are statistically analyzed by using the data from the Best Track Dataset for Tropical Cyclones (1949—2020) compiled by Shanghai Tropical Cyclones Institute of the China Meteorological Administration (CMA-STI). Results show that the TCs affecting Hainan Island tended to decrease remarkably, with about 4.857 TCs per decade, especially in the categories of tropical depression and typhoon or higher. The TCs landing Hainan tended to decline slightly, whereas the TCs affecting Hainan tended to increase obviously. TCs landed Hainan frequently in between June to October, with the peak in September. Most TC activities were concentrated at the southeastern part of Hainan Island. The weaker TCs were generated mostly in the northeastern South China Sea while the stronger TCs mostly in between the east of the Philippines and the Caroline Islands. The duration time from a TC landfall to re-entry into the ocean was 10.8 hour on average. The weak (strong) TCs landing Hainan Island were likely to keep (lose) their strength when they crossed the Island.
2022, 13(4): 348-357.
doi: 10.15886/j.cnki.rdswxb.2022.04.005
Abstract:
The spatial and temporal distribution characteristics for South China Sea monsoon trough activities and heavy rainfall between May to September from 2001 to 2020 Hainan Island were statistically analyzed by using NCEP reanalysis and land-based observations in Hainan Island. Monsoon trough that generates heavy rainfall events were grouped into two types according to its position. The composite analysis of high- and low-level circulations and their element fields were performed. The results show that the monsoon trough affecting Hainan occurred about 10.3 times per year on average, 58.4 days per year, and 5.7 days per event on average. The heavy rainfall events accounted for 7.1%, mainly occurring in August and September. The first type of monsoon trough was mostly active in August, and was the easiest to bring heavy rainfall in September. The second type of monsoon trough was mostly active in September and brought heavy rainfall most frequently in September as well. The high frequency heavy rainfall zones generated from the first and second types of monsoon trough were different, and the second type of monsoon trough tended to bring heavy rainfall more easily. The divergence of the high-level South Asia high, and strong monsoon and monsoon trough on moderately low level were a prerequisite for the occurrence of heavy rainfall, but establishment of monsoon trough at different locations led to different system configurations of rainfall. The occurrence of heavy rainfall in the first type of monsoon trough was highly related to the structure and shear line location of monsoon trough. The monsoon transferred the water vapor and energy to the trough zone, and the convergence on the low level and the divergence on the high level of monsoon trough generated and enhanced the convection and ascending motion on low level, which led to heavy rainfall. The high frequency heavy rainfall area in the first type of monsoon trough corresponded to the strongest convergence area on the south of the trough and the right side of cyclone circulation. The occurrence of heavy rainfall in the second type of monsoon trough was related to the low-level jetstream on the north side of monsoon trough and the water vapor and energy on low level were transferred by low-level jet to Hainan Island and resulted in the intense convergence upward motion over the island, which led to the occurrence of heavy rainfall. The intensity distribution of rainfall was also highly related with the special bell-shaped terrain of Hainan Island. The high frequency heavy rainfall areas in the two types of monsoon trough were both well corresponding to the strong terrain effect area, but were obviously different due to the different low wind background on low level.
The spatial and temporal distribution characteristics for South China Sea monsoon trough activities and heavy rainfall between May to September from 2001 to 2020 Hainan Island were statistically analyzed by using NCEP reanalysis and land-based observations in Hainan Island. Monsoon trough that generates heavy rainfall events were grouped into two types according to its position. The composite analysis of high- and low-level circulations and their element fields were performed. The results show that the monsoon trough affecting Hainan occurred about 10.3 times per year on average, 58.4 days per year, and 5.7 days per event on average. The heavy rainfall events accounted for 7.1%, mainly occurring in August and September. The first type of monsoon trough was mostly active in August, and was the easiest to bring heavy rainfall in September. The second type of monsoon trough was mostly active in September and brought heavy rainfall most frequently in September as well. The high frequency heavy rainfall zones generated from the first and second types of monsoon trough were different, and the second type of monsoon trough tended to bring heavy rainfall more easily. The divergence of the high-level South Asia high, and strong monsoon and monsoon trough on moderately low level were a prerequisite for the occurrence of heavy rainfall, but establishment of monsoon trough at different locations led to different system configurations of rainfall. The occurrence of heavy rainfall in the first type of monsoon trough was highly related to the structure and shear line location of monsoon trough. The monsoon transferred the water vapor and energy to the trough zone, and the convergence on the low level and the divergence on the high level of monsoon trough generated and enhanced the convection and ascending motion on low level, which led to heavy rainfall. The high frequency heavy rainfall area in the first type of monsoon trough corresponded to the strongest convergence area on the south of the trough and the right side of cyclone circulation. The occurrence of heavy rainfall in the second type of monsoon trough was related to the low-level jetstream on the north side of monsoon trough and the water vapor and energy on low level were transferred by low-level jet to Hainan Island and resulted in the intense convergence upward motion over the island, which led to the occurrence of heavy rainfall. The intensity distribution of rainfall was also highly related with the special bell-shaped terrain of Hainan Island. The high frequency heavy rainfall areas in the two types of monsoon trough were both well corresponding to the strong terrain effect area, but were obviously different due to the different low wind background on low level.
2022, 13(4): 358-366.
doi: 10.15886/j.cnki.rdswxb.2022.04.006
Abstract:
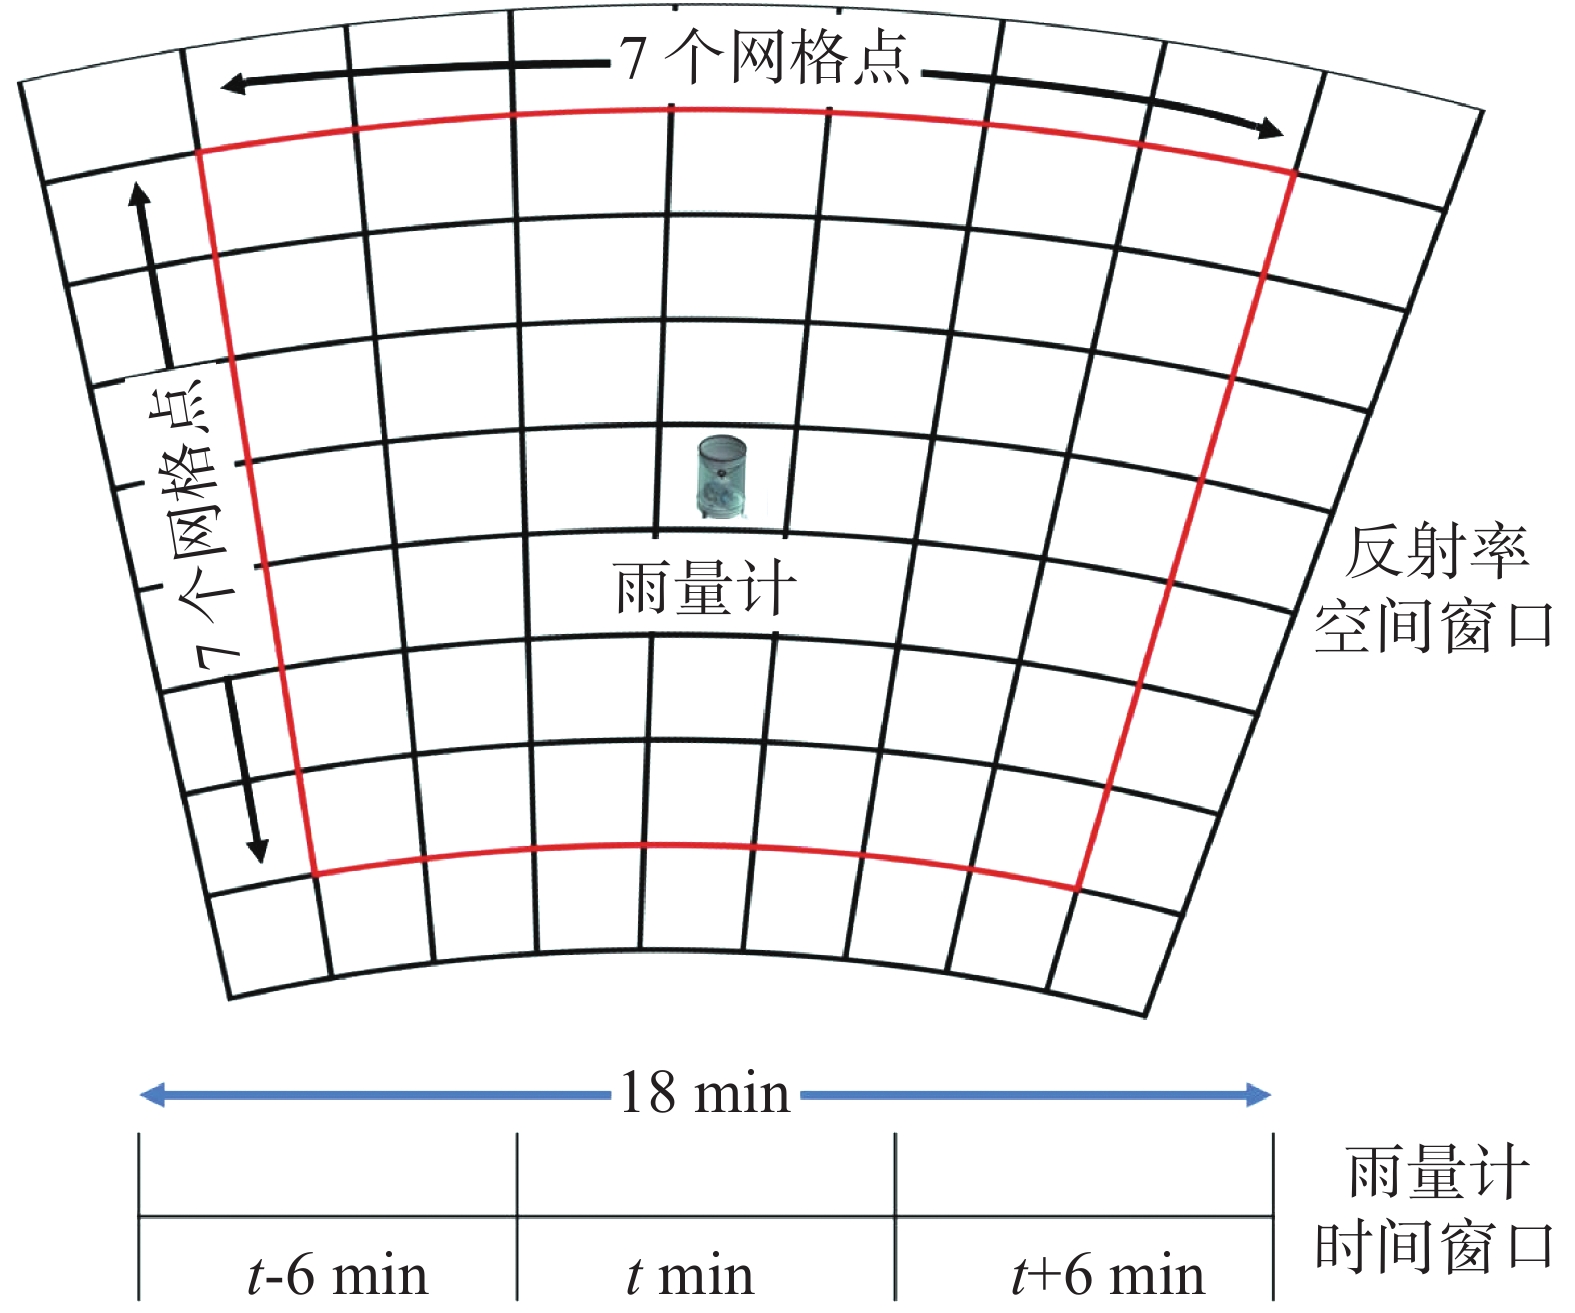
The Haikou Doppler radar volume scan composite elevation data and rainfall data from automatic meteorological rain gauges from Hainan Island collected from September to November in 2017—2018 was used to develop radar reflectivity Z and gauge rainfall R relationships (Z-R relationship) in various areas of Hainan Island for quantitative precipitation estimation by four matching methods: traditional matching method (TMM), probability matching method (PMM), window probability matching method (WPMM) and window correlation matching method (WCMM). And the errors of the four matching methods in hourly rainfall intensity and areal rainfall estimation were compared and analyzed. The results show that the four matching methods tend to overestimate the low rainfall events and underestimate the high rainfall events. The effect of rainfall estimation decreases with the increase of radar distance. PMM provides better result in estimating the Z-R relationships and much higher accuracy in quantitative estimation of precipitation than the other three matching methods. The mean absolute error of PMM in hourly rainfall intensity is less than 4 mm·h−1, and the minimum deviation of areal rainfall is only 2.1%.
The Haikou Doppler radar volume scan composite elevation data and rainfall data from automatic meteorological rain gauges from Hainan Island collected from September to November in 2017—2018 was used to develop radar reflectivity Z and gauge rainfall R relationships (Z-R relationship) in various areas of Hainan Island for quantitative precipitation estimation by four matching methods: traditional matching method (TMM), probability matching method (PMM), window probability matching method (WPMM) and window correlation matching method (WCMM). And the errors of the four matching methods in hourly rainfall intensity and areal rainfall estimation were compared and analyzed. The results show that the four matching methods tend to overestimate the low rainfall events and underestimate the high rainfall events. The effect of rainfall estimation decreases with the increase of radar distance. PMM provides better result in estimating the Z-R relationships and much higher accuracy in quantitative estimation of precipitation than the other three matching methods. The mean absolute error of PMM in hourly rainfall intensity is less than 4 mm·h−1, and the minimum deviation of areal rainfall is only 2.1%.
2022, 13(4): 367-375.
doi: 10.15886/j.cnki.rdswxb.2022.04.007
Abstract:
Based on the data on automatic soil moisture in Hainan Province from 2013 to 2018, the threshold values of different soil elements at different soil layers were obtained by using statistical analysis, and a quality control scheme suitable for automatic soil moisture in Hainan Province was formulated. The quality control scheme was applied to the soil moisture data on an hourly basis from the automatic stations in 2019 and was found to have a good applicability in the quality control of automatic observation data on soil moisture in Hainan Province. The quality control scheme had an annual monthly availability rate of above 90%, and its average availability rate is above 97% except in September. This scheme reduced the false detection rate and missed detection rate, compared with the current audit software RASM.
Based on the data on automatic soil moisture in Hainan Province from 2013 to 2018, the threshold values of different soil elements at different soil layers were obtained by using statistical analysis, and a quality control scheme suitable for automatic soil moisture in Hainan Province was formulated. The quality control scheme was applied to the soil moisture data on an hourly basis from the automatic stations in 2019 and was found to have a good applicability in the quality control of automatic observation data on soil moisture in Hainan Province. The quality control scheme had an annual monthly availability rate of above 90%, and its average availability rate is above 97% except in September. This scheme reduced the false detection rate and missed detection rate, compared with the current audit software RASM.
2022, 13(4): 376-381.
doi: 10.15886/j.cnki.rdswxb.2022.04.008
Abstract:
It is very important to improve rubber yield by avoiding the impact of meteorological disasters effectively and making full use of the advantages of climate resources to tap the rubber production potential of rubber tree. The impacts of climate factors on the global distribution of rubber plantations and the northern boundary for rubber plantation in China, the impact of meteorological disasters (typhoon and cold injury) on rubber plantations in the rubber producing areas in China, the distribution of rubber planting areas with climatic suitability in China, and the differences and reasons of rubber production capacity in China were summarized and analyzed from the perspective of climatic factors, based on which some suggestions are put forward to ensure stable and high rubber yield of rubber plantations in China, such as reasonably choosing areas with climatic suitability for rubber planting, strengthening research and development on high yielding cultivation with resistance to typhoon, cold and drought, guaranteeing a given strategic rubber planting area with high climatic suitability in the layout of rubber plantation industry, promoting rubber-based farming in rubber plantations, and enhancing the meteorological service in rubber production to reduce the impact of extreme weather and climate events on rubber production.
It is very important to improve rubber yield by avoiding the impact of meteorological disasters effectively and making full use of the advantages of climate resources to tap the rubber production potential of rubber tree. The impacts of climate factors on the global distribution of rubber plantations and the northern boundary for rubber plantation in China, the impact of meteorological disasters (typhoon and cold injury) on rubber plantations in the rubber producing areas in China, the distribution of rubber planting areas with climatic suitability in China, and the differences and reasons of rubber production capacity in China were summarized and analyzed from the perspective of climatic factors, based on which some suggestions are put forward to ensure stable and high rubber yield of rubber plantations in China, such as reasonably choosing areas with climatic suitability for rubber planting, strengthening research and development on high yielding cultivation with resistance to typhoon, cold and drought, guaranteeing a given strategic rubber planting area with high climatic suitability in the layout of rubber plantation industry, promoting rubber-based farming in rubber plantations, and enhancing the meteorological service in rubber production to reduce the impact of extreme weather and climate events on rubber production.
2022, 13(4): 382-390.
doi: 10.15886/j.cnki.rdswxb.2022.04.009
Abstract:
Climatic characteristics and changes of low temperature process during the safe fertility-sensitive period of two-line hybrid rice seed production in four cities in southern Hainan Island were statistically analyzed by using the methods of linear tendency estimation and wavelet analysis based on the daily mean temperature of these areas from 1961 to 2020, so as to provide reference for the arrangement of rice seed production in winter. The results show the annual average number of low-temperature days in the safe fertility-sensitive period of two-line hybrid rice seed production in the four cities is 3.6 days in the descending order of Dongfang > Ledong > Lingshui and Sanya. In recent 60 years, the maximum number of average low temperature days mainly occurred on March 26 and March 17, but in the last 10 years, it mainly occurred from March 24 to 26. The duration of most of the low-temperature processes is 3−7 days. The processes more than 10 days and less than 3 days have low probability, and only occurred in Dongfang and Lingshui. In recent 60 years, the frequency of low temperature processes and total days and maximum duration and occurrence range have showed significant linear reduction and shortening and decreasing trend. However, since 2010, frequency of low-temperature processes in some years is still more than that in normal years, and a large-scale low temperature process occurred in nearly half of the years, and a rare long-time low temperature process occurred in individual years. Under the background of climate warming, the low temperature climate risk has decreased from the highest level to the lowest level in some cities and some periods in recent 10 years. The annual average number of low temperature processes, total days and the longest duration in the four cities have significant characteristics of short-period oscillation. The low temperature climate risk from mid-March to mid-April should be fully considered in rice seed production in winter.
Climatic characteristics and changes of low temperature process during the safe fertility-sensitive period of two-line hybrid rice seed production in four cities in southern Hainan Island were statistically analyzed by using the methods of linear tendency estimation and wavelet analysis based on the daily mean temperature of these areas from 1961 to 2020, so as to provide reference for the arrangement of rice seed production in winter. The results show the annual average number of low-temperature days in the safe fertility-sensitive period of two-line hybrid rice seed production in the four cities is 3.6 days in the descending order of Dongfang > Ledong > Lingshui and Sanya. In recent 60 years, the maximum number of average low temperature days mainly occurred on March 26 and March 17, but in the last 10 years, it mainly occurred from March 24 to 26. The duration of most of the low-temperature processes is 3−7 days. The processes more than 10 days and less than 3 days have low probability, and only occurred in Dongfang and Lingshui. In recent 60 years, the frequency of low temperature processes and total days and maximum duration and occurrence range have showed significant linear reduction and shortening and decreasing trend. However, since 2010, frequency of low-temperature processes in some years is still more than that in normal years, and a large-scale low temperature process occurred in nearly half of the years, and a rare long-time low temperature process occurred in individual years. Under the background of climate warming, the low temperature climate risk has decreased from the highest level to the lowest level in some cities and some periods in recent 10 years. The annual average number of low temperature processes, total days and the longest duration in the four cities have significant characteristics of short-period oscillation. The low temperature climate risk from mid-March to mid-April should be fully considered in rice seed production in winter.
2022, 13(4): 391-396.
doi: 10.15886/j.cnki.rdswxb.2022.04.010
Abstract:
Qiongzhong is the main producing area of green orange in Hainan. Climate quality certification of green orange in Qiongzhong will enhance the added value and market competitiveness of the local green orange. According to the observation data of the national meteorological station of Qiongzhong County from 1981 to 2010 and regional automatic meteorological stations in 2020, climate quality certification indices for green orange were selected from three aspects: climate suitability of green orange planting, climate conditions in the growing season, and production and management conditions of enterprises, and a climate quality certification model was constructed based on the indices selected. The fruits of green orange harvested in November 2020 were evaluated and graded by using the climate quality certification model, and their certification score was 93.5, which is listed in the grade of "excellent".
Qiongzhong is the main producing area of green orange in Hainan. Climate quality certification of green orange in Qiongzhong will enhance the added value and market competitiveness of the local green orange. According to the observation data of the national meteorological station of Qiongzhong County from 1981 to 2010 and regional automatic meteorological stations in 2020, climate quality certification indices for green orange were selected from three aspects: climate suitability of green orange planting, climate conditions in the growing season, and production and management conditions of enterprises, and a climate quality certification model was constructed based on the indices selected. The fruits of green orange harvested in November 2020 were evaluated and graded by using the climate quality certification model, and their certification score was 93.5, which is listed in the grade of "excellent".
2022, 13(4): 397-403.
doi: 10.15886/j.cnki.rdswxb.2022.04.011
Abstract:
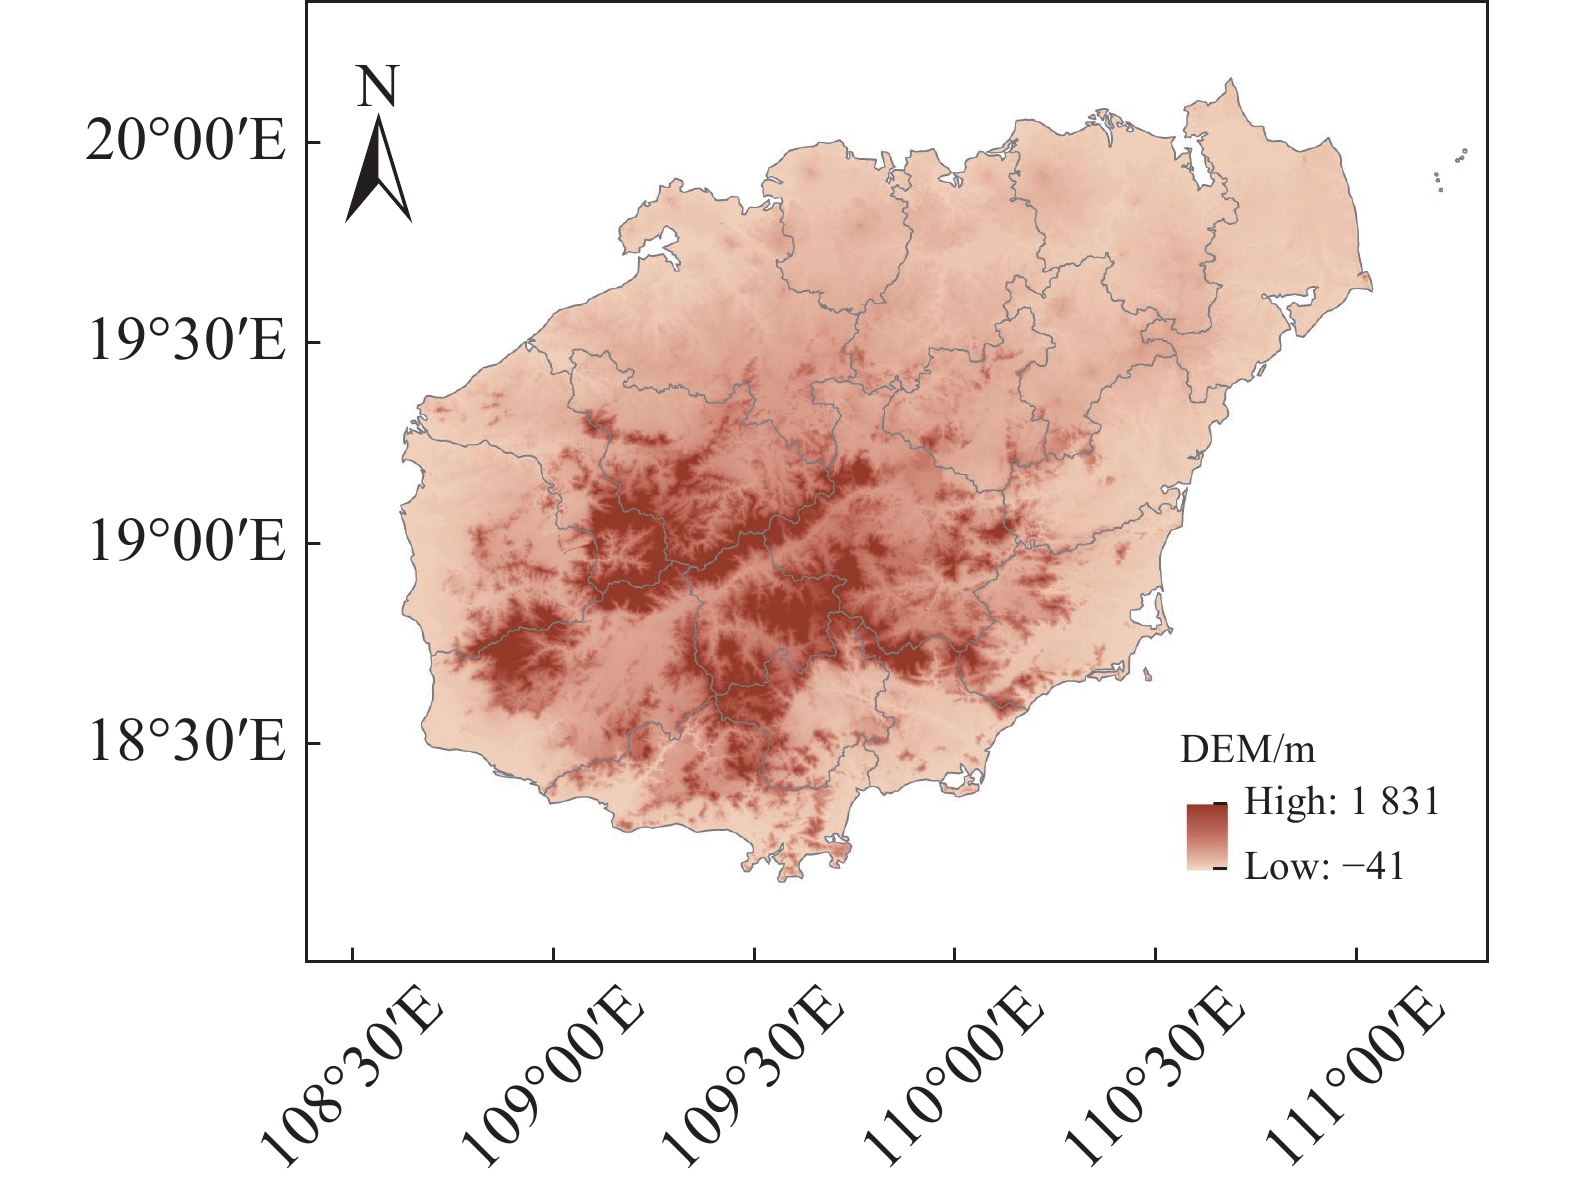
In order to provide theoretical basis for reasonable monitoring of vegetation ecological environment changes in Hainan Island, based on MODIS NDVI data and land cover data of Hainan Island in 2015 and 2017, the inversion technology of vegetation cover area in Hainan Island was studied by univariate linear fitting, root mean square error analysis and correlation coefficient analysis. The results indicated that the main type of land cover in Hainan Island was forest in 2015 which was mainly distributed in Wuzhishan mountains; Secondly, cultivated land was mainly distributed in Haikou, Lingao, Chengmai, Wenchang, Dongfang and other coastal areas; The vegetation coverage area (forest, grassland, shrub and wetland) accounted for 65.67% of the total area. The surface coverage in 2017 was similar to that in 2015. The vegetation coverage of Hainan Island is generally high, and the vegetation coverage of cities in the central mountainous area is higher than that of coastal cities. Wuzhishan has the highest vegetation coverage rate, followed by Qiongzhong and Baisha; Haikou had the lowest vegetation coverage, followed by Wenchang and Ding'an. The best threshold of NDVI vegetation coverage inversion in Hainan Island is 0.70, under this threshold, the spatial recognition rates of NDVI for vegetation cover in 2015 and 2017 reached 78.64% and 78.74% respectively; The best fitting regression model of vegetation coverage area and NDVI inversion value in Hainan Island was y=0.8988x+ 62708142.60, the correlation coefficient is 0.91 and the root mean square error accounted for 17.50% of the actual mean value, the error is reduced by 7.23% compared with the inversion value. The fitting deviation rate of vegetation coverage area in coastal cities was larger than that in inland cities.
In order to provide theoretical basis for reasonable monitoring of vegetation ecological environment changes in Hainan Island, based on MODIS NDVI data and land cover data of Hainan Island in 2015 and 2017, the inversion technology of vegetation cover area in Hainan Island was studied by univariate linear fitting, root mean square error analysis and correlation coefficient analysis. The results indicated that the main type of land cover in Hainan Island was forest in 2015 which was mainly distributed in Wuzhishan mountains; Secondly, cultivated land was mainly distributed in Haikou, Lingao, Chengmai, Wenchang, Dongfang and other coastal areas; The vegetation coverage area (forest, grassland, shrub and wetland) accounted for 65.67% of the total area. The surface coverage in 2017 was similar to that in 2015. The vegetation coverage of Hainan Island is generally high, and the vegetation coverage of cities in the central mountainous area is higher than that of coastal cities. Wuzhishan has the highest vegetation coverage rate, followed by Qiongzhong and Baisha; Haikou had the lowest vegetation coverage, followed by Wenchang and Ding'an. The best threshold of NDVI vegetation coverage inversion in Hainan Island is 0.70, under this threshold, the spatial recognition rates of NDVI for vegetation cover in 2015 and 2017 reached 78.64% and 78.74% respectively; The best fitting regression model of vegetation coverage area and NDVI inversion value in Hainan Island was y=0.8988x+ 62708142.60, the correlation coefficient is 0.91 and the root mean square error accounted for 17.50% of the actual mean value, the error is reduced by 7.23% compared with the inversion value. The fitting deviation rate of vegetation coverage area in coastal cities was larger than that in inland cities.
2022, 13(4): 404-409.
doi: 10.15886/j.cnki.rdswxb.2022.04.012
Abstract:
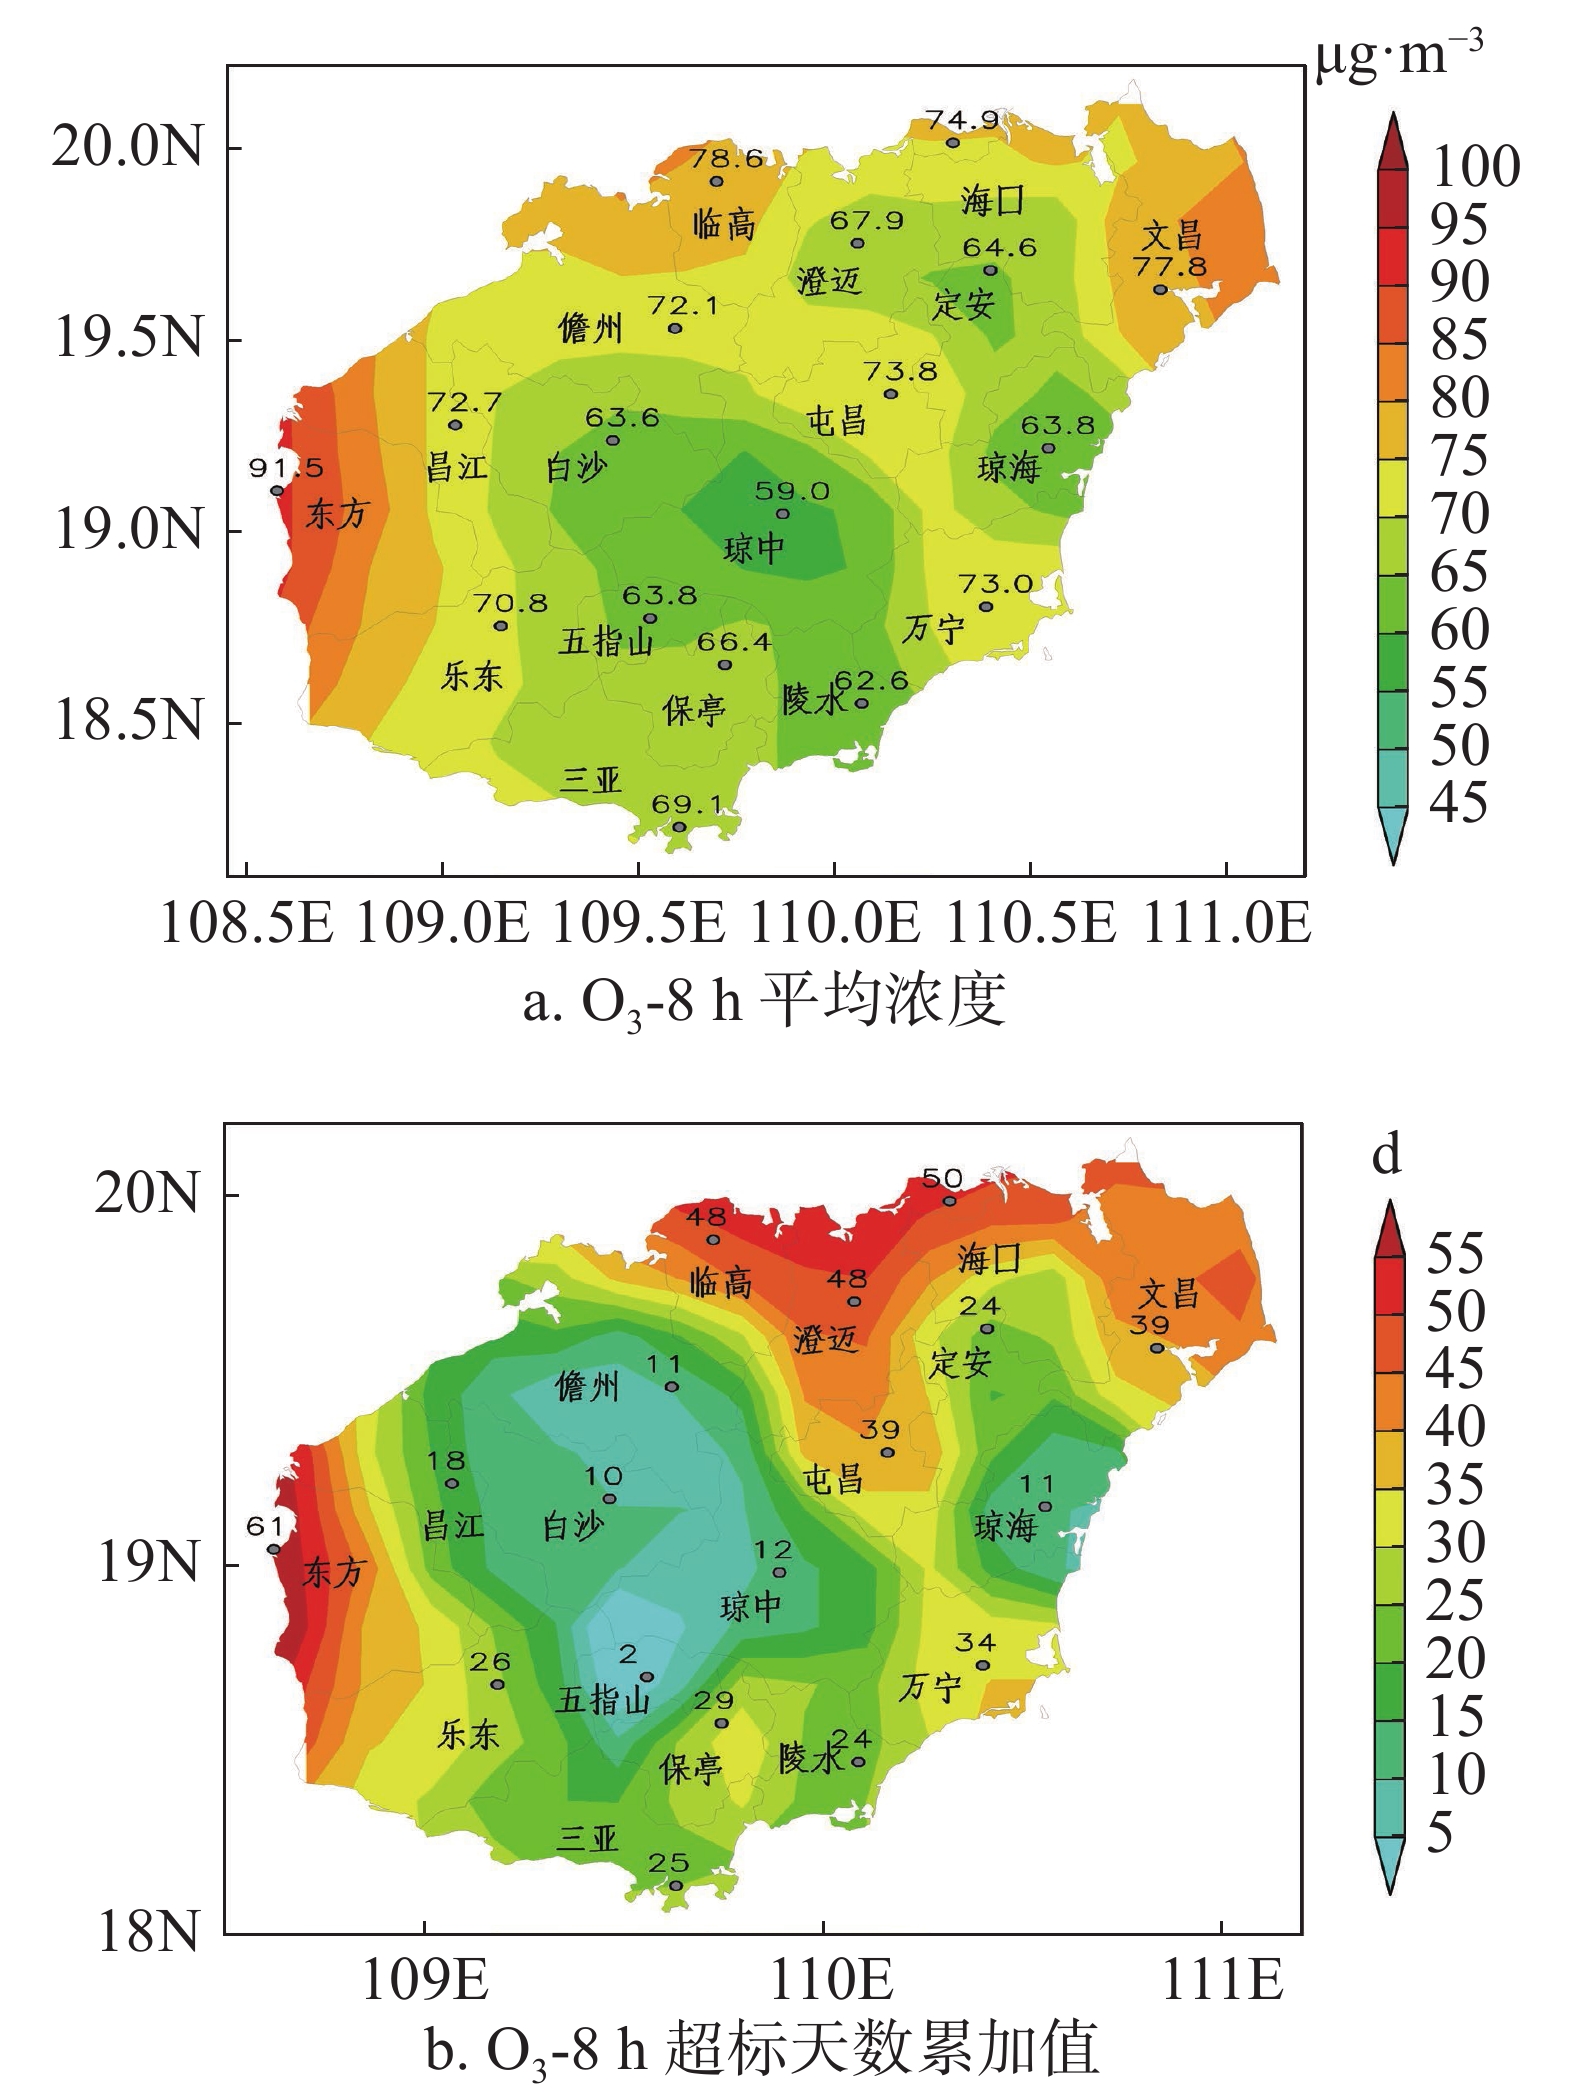
In recent years the concentration of urban ozone (O3) in Hainan Province has been stable relatively, but O3 pollution events have occurred frequently, and its source and characteristics have attracted the attention of government and local people. In this context the researches on O3 pollution in Hainan over the years from 2015 to 2020 were reviewed. The review showed that the running 8 h average O3 concentration (O3-8h) and the number of days exceeding the standard are higher in northern and western Hainan than in middle, eastern and southern Hainan, and their monthly variation is bimodal, with the maximum value appearing in October. Man-made emissions of nitrogen oxides (NOX) and volatile organic compounds (VOCS) are very important for formation of O3 that generates O3 pollution in Hainan Province. In addition, high temperature, low humidity, low wind speed and favorable wind direction will lead to elevation of O3 concentration, and climate change will also affect O3 pollution in Hainan Province.
In recent years the concentration of urban ozone (O3) in Hainan Province has been stable relatively, but O3 pollution events have occurred frequently, and its source and characteristics have attracted the attention of government and local people. In this context the researches on O3 pollution in Hainan over the years from 2015 to 2020 were reviewed. The review showed that the running 8 h average O3 concentration (O3-8h) and the number of days exceeding the standard are higher in northern and western Hainan than in middle, eastern and southern Hainan, and their monthly variation is bimodal, with the maximum value appearing in October. Man-made emissions of nitrogen oxides (NOX) and volatile organic compounds (VOCS) are very important for formation of O3 that generates O3 pollution in Hainan Province. In addition, high temperature, low humidity, low wind speed and favorable wind direction will lead to elevation of O3 concentration, and climate change will also affect O3 pollution in Hainan Province.
2022, 13(4): 410-415.
doi: 10.15886/j.cnki.rdswxb.2022.04.013
Abstract:
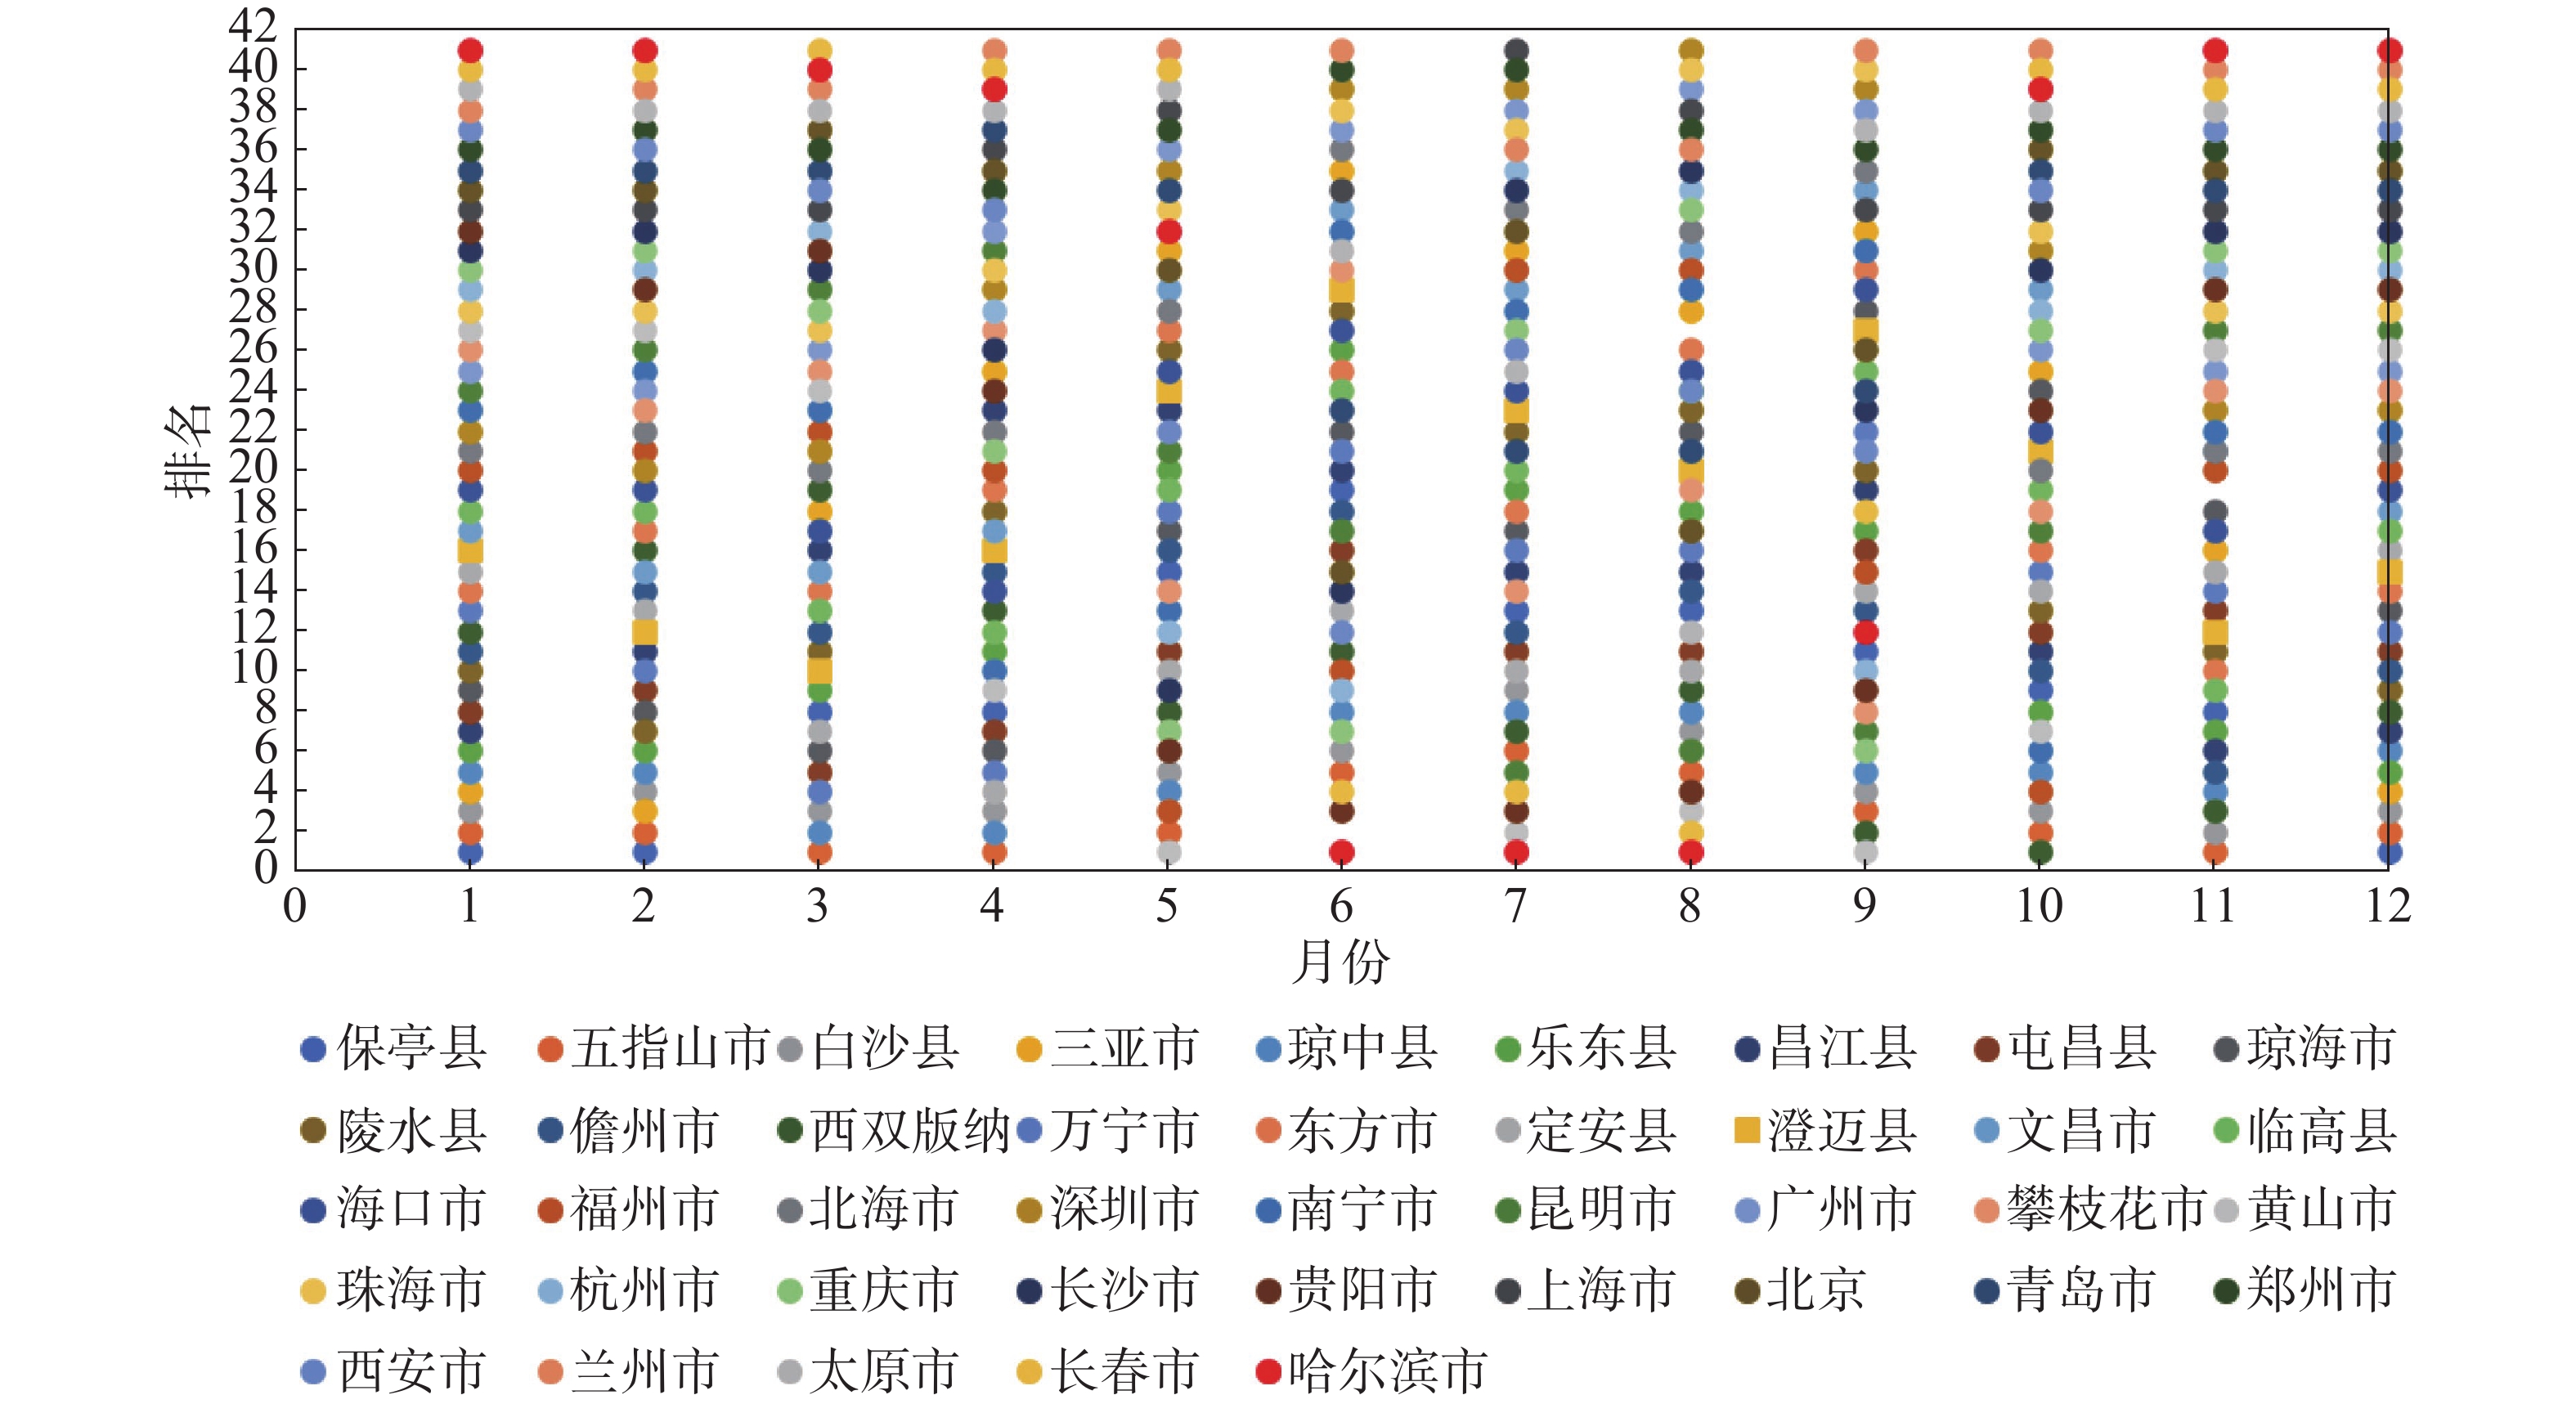
In order to evaluate quantitatively the climate conditions for health and wellbeing and their rank in Hainan, an index of climate suitable for health and wellbeing was constructed by using the weighted sum method. The index takes into account the natural resources closely related to climate suitable for health and wellbeing, such as climate conditions, air quality, ecological environment, etc. A statistical analysis was made of the monthly and seasonal index of climate suitable for health and wellbeing in 41 counties/cities including 18 counties/cities in Hainan province and other 23 major cities such as Beijing, Harbin, Guiyang, Xishuangbanna, Nanning and Kunming, etc. from 2016 to 2019. The results showed that the 18 counties/cities of Hainan ranked the top of the monthly index of climate suitable for health and wellbeing from January to December among the 41 counties/cities, especially from November to April. The climate conditions in the counties/cities of Hainan are better than those in other cities, especially in winter and spring. The climate conditions are the best in Wuzhishan, Qiongzhong and Baisha counties/cities, the central part of Hainan Island, in autumn, summer and spring, and the best in Wuzhishan, Baisha, Baoting, Sanya and Qiongzhong counties/cities of Hainan Island in descending order in winter. Baoting and Sanya are located in the south part of Hainan Island. In conclusion the climate conditions for health and wellbeing are optimum in Wuzhishan, Baisha and Qiongzhong counties/cities, the central part of Hainan Island.
In order to evaluate quantitatively the climate conditions for health and wellbeing and their rank in Hainan, an index of climate suitable for health and wellbeing was constructed by using the weighted sum method. The index takes into account the natural resources closely related to climate suitable for health and wellbeing, such as climate conditions, air quality, ecological environment, etc. A statistical analysis was made of the monthly and seasonal index of climate suitable for health and wellbeing in 41 counties/cities including 18 counties/cities in Hainan province and other 23 major cities such as Beijing, Harbin, Guiyang, Xishuangbanna, Nanning and Kunming, etc. from 2016 to 2019. The results showed that the 18 counties/cities of Hainan ranked the top of the monthly index of climate suitable for health and wellbeing from January to December among the 41 counties/cities, especially from November to April. The climate conditions in the counties/cities of Hainan are better than those in other cities, especially in winter and spring. The climate conditions are the best in Wuzhishan, Qiongzhong and Baisha counties/cities, the central part of Hainan Island, in autumn, summer and spring, and the best in Wuzhishan, Baisha, Baoting, Sanya and Qiongzhong counties/cities of Hainan Island in descending order in winter. Baoting and Sanya are located in the south part of Hainan Island. In conclusion the climate conditions for health and wellbeing are optimum in Wuzhishan, Baisha and Qiongzhong counties/cities, the central part of Hainan Island.
2022, 13(4): 416-421.
doi: 10.15886/j.cnki.rdswxb.2022.04.014
Abstract:
Hainan is a major tropical region in China. It has unique agricultural climate resources, which provide good foundation and prerequisite for the growth of tropical fruits, winter vegetables, nanfan seed industry and natural rubber. However, affected by the complicated and changeable weather and climate, climate change and special geographical environment, major agrometeorological disasters will also occur in Hainan, such as typhoon, drought, rainstorm, flood, cold injury caused by low temperature, heat injury caused by high temperature. The temporal and spatial distribution characteristics of the major agrometeorological disasters in Hainan and their control measures were reviewed and analyzed. The major agrometeorological disasters in Hainan gave serious impact to the agricultural production in Hainan, and they had an obvious spatio-temporal difference. It is suggested to strength the research on monitoring, assessment and warning of the agrometeorological disasters, and agricultural biotechnology to handle the influence of climate change on agricultural production, and to improve the capacity and level of Hainan in prevention and mitigation of the major agrometeorological disasters in agricultural production and rural areas for the healthy and stable development of agriculture in Hainan.
Hainan is a major tropical region in China. It has unique agricultural climate resources, which provide good foundation and prerequisite for the growth of tropical fruits, winter vegetables, nanfan seed industry and natural rubber. However, affected by the complicated and changeable weather and climate, climate change and special geographical environment, major agrometeorological disasters will also occur in Hainan, such as typhoon, drought, rainstorm, flood, cold injury caused by low temperature, heat injury caused by high temperature. The temporal and spatial distribution characteristics of the major agrometeorological disasters in Hainan and their control measures were reviewed and analyzed. The major agrometeorological disasters in Hainan gave serious impact to the agricultural production in Hainan, and they had an obvious spatio-temporal difference. It is suggested to strength the research on monitoring, assessment and warning of the agrometeorological disasters, and agricultural biotechnology to handle the influence of climate change on agricultural production, and to improve the capacity and level of Hainan in prevention and mitigation of the major agrometeorological disasters in agricultural production and rural areas for the healthy and stable development of agriculture in Hainan.


 Abstract
 FullText HTML
 PDF 7052KB






 Email alert
 RSS
RSS