


-
据估计,到2050年,全球将会有超过一半的耕地盐碱化[1]。我国是盐碱地大国之一,盐碱化的耕地面积大约9 913万hm2[2],还有234万hm2的沿海滩涂[3]。越来越严重的土壤盐渍化现象是影响植物生长、造成作物减产的主要非生物胁迫因子之一[4-6]。在盐胁迫条件下,植物种子的发芽降低[7],植株形态结构发生变化、光合能力受阻、各个时期的生长受到不同程度的抑制[7-8],生化物质的合成及物质代谢受到影响[4, 9-11]。选育和种植耐盐碱水稻新品种,已经成为保障盐碱稻区粮食生产的有效途径之一[12-14]。水稻(Oryza sativa L.)是一种对盐敏感的作物[15],不断加重的土壤盐渍化成为制约水稻安全生产的主要因素。耐盐水稻品种的获得首先是对现有水稻种质资源或品种进行耐盐性鉴定和筛选得到的[16-20]。研究发现,在水稻不同的生育期和发育阶段,受盐胁迫的影响不同,一般在初期生长阶段和生殖阶段表现出较强的敏感性[21-22]。幼苗期是水稻耐盐能力强弱的关键阶段,在某种程度上可以苗期作为全生育期耐盐性水平的参照[23]。本研究以耐盐性不同的30份水稻品种(系)为材料,利用人工盐池进行了水稻苗期的耐盐性鉴定试验,并运用相关性分析、主成分分析和隶属函数法等方法,对水稻耐盐性评价指标进行了筛选和耐盐性综合分析,旨在为水稻耐盐性鉴定和耐盐品种培育提供参考。
-
本试验在海南大学试验基地人工盐池进行,以海南大学热带作物学院水稻课题组自主选育的或引进的经田间耐盐性鉴定后选取的不同耐盐性的品种(系)为试验材料(表1)。
编号 品种(系) 来源 编号 品种 来源 No. Variety/line Source No. Variety/line Source 1 14-6 自主选育 16 50188-1 湖北 2 14-12 自主选育 17 50188-2 湖北 3 14-30 自主选育 18 41332 湖北 4 14-36 自主选育 19 15-18-1 湖南 5 14-39 自主选育 20 15-18-2 湖南 6 14-57 自主选育 21 16-1 广东 7 14-58-1 自主选育 22 16-2 广东 8 14-58-2 自主选育 23 16-4 广东 9 14-58-3 自主选育 24 16-7 广东 10 14-90 自主选育 25 16-8 江苏 11 14-776 自主选育 26 16-9 江苏 12 14-563 自主选育 27 16-10 江苏 13 F633 自主选育 28 16-11 广东 14 W01 自主选育 29 16-14 广东 15 W10 自主选育 30 9311 湖北 Table 1. Experimental materials and sources
-
供试材料于育苗盘中培育至两叶一心期,于2018−03−30分别移栽到3个试验池中。试验池规格为1.7 m×5.1 m,移栽前每池各施30 kg羊粪肥和300 g复合肥(N︰P2O5︰K2O=15︰15︰15)。移栽1周后,用食盐(NaCl)分别调节2个处理池的盐分浓度为0.3% (T1)和0.5% (T2),以NaCl浓度为0的作为对照池(CK)。盐胁迫处理期间,每日早晚用盐度计(台湾衡欣AZ8371)监测处理池盐分浓度的变化并适时添加NaCl或淡水维持处理池盐度。盐胁迫处理20 d后进行光合特性测定,并取样进行生理生化指标测定。
-
整株挖取样品植株,洗净泥土,带回实验室用毛巾吸干水分,选取10株水稻(其余材料用液氮速冻处理后放入−80 ℃保存备用)分离地上部分和地下部分,分别测量鲜质量后,于105 ℃烘箱中杀青30 min,然后80 ℃恒温下烘干至恒重,用千分之一电子天平称量干质量。
-
叶绿素总含量(TC)参照王旭等[24]的方法测定,过氧化物酶(POD)活性使用愈创木酚法(南京建成POD测定试剂盒)测定,丙二醛含量采用硫代巴比妥酸(TBA)法(南京建成MDA测定试剂盒)测定,可溶性糖含量使用蒽酮法(Solarbio公司的可溶性糖含量测定试剂盒)测定,可溶性蛋白含量使用西安赫特生物公司试剂盒提取后用BCA法测定,游离脯氨酸含量采用酸性茚三酮法测定。
-
用便携式光合测定系统(Li-6400型,Li-cor公司)测定光合指标,测量时光量子密度为1 200 μmol·m−2·s−1,使用前按说明书调试。水分利用率(WUE)为净光合速率(Pn)与蒸腾作用(Tr)的比值(Pn/Tr)。
-
使用Excel 2016和SPSS 20.0进行数据统计分析,在Pearson相关性、聚类之前所有数据均已转换为耐盐性系数。耐盐系数定义为在给定盐度水平条件下目标性状的观测值除以对照条件下该性状的观测值[25],使用因子分析进行主成分分析。所有指标的测量值均为3次重复的平均值。
式中:xj表示第j个因子的得分值,Xmin表示第j个因子得分的最小值,Xmax表示第j个因子得分的最大值。
式中:Wj表示第j个综合指标在所有综合指标中的权重,Pj表示经过主成分分析得到的水稻各品种(系)第j个综合指标的贡献率。
-
从表2可知,对于Pn,在0.3%盐浓度下,耐盐系数最大的是14-36和14-57,均为0.90,最小的是16-4,为0.48;在0.5%盐浓度下,耐盐系数最大的是14-36,为0.84。对于WUE,在0.3%盐浓度下,耐盐系数最大的是16-11,为1.04,最小的是15-18-2,为0.71;在0.5%浓度下,耐盐系数最大的是14-12,为0.98,最小的是14-58-1和16-9,为0.40。对于其他耐盐相关指标,如FW,DW,TC,MDA,SS,SP,Pro和POD等,在0.3%盐浓度下的耐盐系数值最大的分别是50188-1,14-39,14-57,15-18-1,16-4,16-10,14-58T和14-776,其值分别为0.97,1.34,0.98,4.08,3.05,2.80,4.18和1.58;耐盐系数值最小的分别是15-18-2,14-563,16-4,14-30,9311,14-58-1,14-58-1和16-7,其值分别为0.54,0.49,0.55,1.06,0.99,1.06,1.03和0.95。同样,对于FW,DW,TC,MDA,SS,SP,Pro和POD等耐盐相关指标,在0.5%盐浓度下,耐盐系数最大的分别是16-8(50188-1并列),14-57,14-58-2,15-18-1,50188-1,14-30,14-57和14-57,其值分别为0.88,0.95,0.83,6.95,4.88,3.54,8.41和2.56。由此可见,对于不同的耐盐指标,其对应的耐盐水稻品种(系)及盐敏感水稻品种(系)各不相同,不同品种(系)在苗期不同的盐浓度(0,0.3%,0.5%)处理下各个耐盐指标的表现不一致。在不同盐浓度处理下,30份品种(系)的Pn值的耐盐系数都表现为0.5%处理的低于0.3%处理的,说明随着盐浓度的升高各供试材料的Pn下降;对于WUE的耐盐系数,除14-90,16-11,14-776,W10等少数品系外,其他品种(系)也都随着盐浓度的升高其WUE降低;同样,除了少部分品种(系)外,其他品种(系)的FW,DW,TC等指标都随着盐浓度的升高而降低。但是,对于MDA,SS,SP,Pro等生理指标值,均随着盐浓度的升高而升高。此外,除16-7和50188-1外,POD值均在升高,但是没有像其他耐盐指标一样会随着盐浓度的升高呈一致性变化。
品种
NamePn WUE FW DW TC MDA SS SP Pro POD 0.3% 0.5% 0.3% 0.5% 0.3% 0.5% 0.3% 0.5% 0.3% 0.5% 0.3% 0.5% 0.3% 0.5% 0.3% 0.5% 0.3% 0.5% 0.3% 0.5% 14-6 0.88 0.83 0.95 0.93 0.94 0.85 0.98 0.88 0.71 0.32 1.82 2.52 1.59 2.29 1.31 1.35 2.04 6.42 1.32 1.65 14-12 0.93 0.84 0.99 0.98 0.68 0.59 0.90 0.73 0.59 0.48 1.92 2.07 1.06 2.22 1.48 1.51 2.09 4.08 1.26 1.49 14-30 0.84 0.55 0.92 0.68 0.59 0.36 0.97 0.93 0.79 0.54 0.08 2.13 1.07 1.17 2.16 3.54 1.73 4.24 1.33 2.03 14-36 0.90 0.87 0.97 0.96 0.76 0.53 0.69 0.55 0.90 0.47 1.37 2.28 1.35 2.74 1.38 1.67 2.57 6.47 1.14 1.55 14-57 0.90 0.72 0.95 0.83 0.84 0.61 1.05 0.95 0.98 0.64 1.09 2.25 1.80 3.08 1.45 1.81 3.45 8.41 1.16 2.56 14-58-1 0.55 0.18 0.82 0.40 0.64 0.41 0.78 0.46 0.65 0.30 1.35 2.77 1.20 1.77 1.06 1.23 1.03 4.48 1.02 1.58 14-58-2 0.80 0.67 0.94 0.93 0.94 0.87 0.93 0.80 0.90 0.83 1.14 2.15 1.63 2.65 1.35 2.00 3.32 5.10 1.21 1.97 14-58-3 0.83 0.62 0.93 0.92 0.88 0.74 0.92 0.78 0.87 0.75 1.93 1.73 1.63 1.94 1.31 2.13 4.18 5.64 1.05 1.73 14-90 0.84 0.42 1.03 0.75 0.72 0.53 0.92 0.65 0.88 0.62 2.05 2.82 1.03 1.15 1.23 1.47 2.34 5.11 1.13 1.83 14-776 0.84 0.80 0.92 0.92 0.62 0.32 0.50 0.50 0.66 0.52 2.12 5.58 1.00 1.54 1.06 1.50 2.62 5.17 1.58 2.33 16-1 0.68 0.62 0.76 0.75 0.70 0.71 0.59 0.58 0.80 0.63 2.31 5.09 1.11 1.36 1.29 1.44 1.39 4.23 1.17 1.98 16-2 0.71 0.40 0.92 0.89 0.90 0.84 0.92 0.86 0.70 0.66 1.85 2.54 2.00 4.15 1.66 2.58 1.81 5.49 1.14 1.78 16-4 0.48 0.35 0.81 0.76 0.96 0.62 0.75 0.58 0.55 0.54 2.30 2.18 3.05 3.64 1.87 2.68 1.47 3.97 1.15 1.68 16-7 0.55 0.53 0.77 0.76 0.64 0.56 0.53 0.52 0.88 0.71 2.12 4.91 1.01 1.42 1.58 2.05 1.67 6.06 0.95 1.44 16-8 0.54 0.30 0.90 0.56 0.89 0.88 0.93 0.66 0.98 0.64 2.01 4.67 1.12 1.35 1.37 1.67 1.63 4.31 1.06 1.39 14-563 0.71 0.65 0.95 0.92 0.49 0.54 0.49 0.40 0.59 0.45 1.62 2.86 1.19 1.85 1.47 2.07 2.04 6.89 1.18 1.49 F633 0.83 0.64 0.97 0.78 0.87 0.70 0.87 0.82 0.88 0.72 2.07 3.21 1.06 1.13 1.72 2.30 1.62 4.43 1.22 1.88 W01 0.87 0.84 0.97 0.95 0.79 0.75 0.79 0.75 0.93 0.65 1.51 2.08 1.04 2.78 1.96 3.21 1.76 4.67 1.03 1.95 W10 0.63 0.58 0.79 0.87 0.70 0.51 0.90 0.57 0.79 0.65 1.40 2.23 1.73 1.91 1.43 1.62 1.51 5.18 1.06 1.90 50188-2 0.58 0.36 0.96 0.74 0.63 0.54 0.85 0.69 0.76 0.63 1.96 2.48 1.17 2.12 1.27 1.65 1.49 3.67 1.06 1.74 16-14 0.61 0.40 0.84 0.61 0.80 0.74 0.72 0.46 0.34 0.30 2.57 5.53 2.36 2.88 1.60 1.90 1.78 4.69 1.15 1.70 15-18-2 0.50 0.16 0.71 0.45 0.54 0.39 0.70 0.44 0.75 0.42 1.63 2.96 1.87 1.88 1.13 1.21 2.42 4.69 1.22 1.99 9311.00 0.54 0.45 0.80 0.71 0.73 0.61 0.91 0.55 0.63 0.60 1.85 2.31 0.99 2.05 1.45 1.93 2.12 5.17 1.04 1.46 16-10 0.61 0.49 0.91 0.90 0.88 0.51 0.95 0.44 0.72 0.30 1.66 4.74 1.05 1.58 2.80 3.88 2.21 4.52 1.16 1.70 50188-1 0.85 0.69 0.91 0.90 0.97 0.88 0.89 0.88 0.97 0.69 1.51 2.83 2.60 4.88 1.28 1.71 1.67 4.87 0.98 1.42 14-39 0.67 0.55 0.96 0.91 0.92 0.75 1.34 0.79 0.91 0.82 2.47 5.16 1.38 1.61 1.27 1.43 2.10 4.69 1.12 1.67 15-18-1 0.64 0.53 0.90 0.87 0.78 0.59 0.80 0.71 0.90 0.56 4.08 6.95 1.02 1.05 1.39 1.86 1.91 4.69 1.16 1.70 41332 0.56 0.46 0.95 0.92 0.94 0.74 0.92 0.90 0.97 0.64 1.13 3.37 1.21 1.75 2.76 3.18 1.76 4.06 1.09 1.60 16-11 0.82 0.65 1.04 0.93 0.92 0.64 0.98 0.65 0.78 0.69 1.58 4.89 1.04 2.04 1.32 2.67 2.22 4.91 1.20 1.83 16-9 0.50 0.18 0.81 0.40 0.89 0.31 0.70 0.39 0.67 0.33 3.63 6.52 1.01 1.10 1.26 1.32 2.10 4.71 1.20 1.67 Average 0.71 0.54 0.90 0.80 0.78 0.62 0.84 0.66 0.78 0.57 1.87 3.46 1.41 2.10 1.52 2.02 2.07 5.03 1.15 1.76 CV 0.21 0.37 0.09 0.21 0.17 0.27 0.21 0.26 0.20 0.27. 0.39 0.43 0.37 0.44 0.28 0.35 0.32 0.20 0.11 0.15 注:Pn-净光合速率,WUE-水分利用效率,FW-地上鲜质量,DW-地上干质量,TC-叶绿素含量,MDA-丙二醛含量,Pro-脯氨酸含量,SS-可溶性糖含量,SP-可溶性蛋白含量,POD-过氧化物歧化酶,Average-平均数,CV-变异系数。
Note: Pn, net photosynthetic rate; WUE, water use efficiency; FW, shoot fresh weight; DW, shoot dry weight; TC, chlorophyll content; MDA, malondialdehyde content; Pro, proline content; SS, soluble sugar content; SP, soluble protein content; POD, peroxidase activity; Average, mean value; CV, coefficient of variation.Table 2. Relative values of physiological indices of the rice under salt stress
从各指标耐盐系数的变异系数值来看(表2),除了脯氨酸(Pro)外,其他耐盐系数的变异系数值均表现为0.5%盐处理大于0.3%盐处理。综上所述,对于30个水稻品种(系)来说,同一品种的不同耐盐指标变化不同,在不同浓度下每个耐盐指标的耐盐系数变化范围也不同,且各指标值的变化没有一致性。因此,仅根据单一指标、单一浓度难以有效判定水稻品种(系)的耐盐性大小。
-
在0.3%盐浓度下,对各耐盐指标之间的相关性进行了分析,从表3可知,只有Pn和WUE,DW与WUE、FW有显著相关性,其余指标间无显著相关性。从表4可知,在0.5%盐浓度下,Pn与WUE呈极显著正相关,与DW,Pro呈显著正相关;WUE与FW,DW,TC呈显著正相关;FW与DW,TC,SS呈极显著正相关;DW与TC呈极显著正相关,与MDA呈显著负相关;MDA与SS呈显著负相关。其中,相关性最强的是Pn与WUE,其相关系数达到0.789,为极显著正相关,说明水稻植株在盐胁迫条件下进行光合作用合成有机物时,与各品种的水分利用效率是密切相关的,POD和SP与其他耐盐相关指标之间均不存在相关关系。结合前面的分析结果可知,在0.3%盐浓度下的指标值有些接近对照的,耐盐指标的变异系数除了Pro外,其余的均为0.3%盐浓度小于0.5%的。在相关性分析中,30个水稻品种(系)在0.3%盐浓度下各耐盐指标之间相关性不紧密,只有Pn和WUE,DW与WUE,FW有显著相关性,其余的无显著相关性,但0.5%盐浓度下各指标有着不同程度的相关性。因此,在下面的实验中,笔者选用0.5%的盐浓度进行耐盐性综合评价与分析。
指标 Indices Pn WUE FW DW TC MDA SS SP Pro POD Pn 1 WUE 0.702** 1 FW 0.083 0.278 1 DW 0.203 0.431* 0.548** 1 TC 0.276 0.301 0.280 0.355 1 MDA −0.352 −0.206 0.148 −0.208 −0.197 1 SS −0.097 −0.247 0.266 0.069 −0.227 −0.058 1 SP −0.111 0.122 0.236 0.158 0.056 −0.296 −0.035 1 Pro 0.436* 0.288 0.163 0.180 0.225 −0.109 0.023 −0.157 1 POD 0.355 0.193 −0.162 −0.145 −0.296 −0.004 −0.146 −0.079 0.218 1 注:*表示在0.05水平上显著相关,**表示在0.01水平上显著相关,下同。
Note:* indicates a significant correlation at the 0.05 level; ** indicates a significant correlation at the 0.01 level, similarly hereinafter.Table 3. Correlation of relative values of indicators of the rice under the 0.3% NaCl treatment
指标 Indices Pn WUE FW DW TC MDA SS SP Pro POD Pn 1 WUE 0.827** 1 FW 0.268 0.407* 1 DW 0.395* 0.450* 0.557** 1 TC 0.253 0.417* 0.474** 0.548** 1 MDA −0.233 −0.231 −0.164 −0.385* −0.177 1 SS 0.194 0.286 0.471** 0.296 0.103 −0.432* 1 SP 0.106 0.316 0.086 0.24 0.084 −0.131 0.075 1 Pro 0.405* 0.273 0.036 0.090 0.003 −0.193 0.204 −0.175 1 POD 0.208 0.067 −0.250 0.221 0.138 −0.05 −0.043 0.057 0.256 1 Table 4. Correlation of relative values of indexes of the rice under the 0.5% NaCl treatment
根据苗期各耐盐指标的耐盐系数相关性分析结果可以看出,多数耐盐指标之间存在不同程度的相关性,即各指标耐盐系数的信息有不同程度的重叠。水稻苗期的耐盐能力是一个复杂的性状,根据单一指标无法进行精准的分析,所以需要对其进行综合分析。
-
在0.5%盐浓度下,由于多数耐盐相关指标之间存在明显的相关性,而SP和POD与其他指标之间不存在显著相关性,所以在后面的分析中剔除这2个指标,对其他存在相关性的8个指标进行了主成分分析(表5)。结果显示,苗期前4个综合指标的贡献率分别为41.36%,16.48%,14.36%和9.39%,累计贡献率达到81.59%,说明这4个综合指标反映了绝大部分信息。第1主成分贡献率最大,达到41.36%。与第1主成关系密切的指标有WUE,DW,Pn,FW等,与第2主成分关系较密切的指标有Pro,Pn和TC等,与第3主成分关系较为密切的是SS,MDA等,与第4主成分关系较为密切的有MDA。可见,前4个主成分包含了8个耐盐相关指标的所有信息,说明用其来评价水稻耐盐性的可靠性高。这样就把原来的8个耐盐相关指标转换成4个相互独立的综合指标,同时根据各综合指标的贡献率大小进行下一步分析。
综合指标
Comprehensive indicesPn WUE FW DW TC MDA SS Pro 累计贡献率/%
Cumulative contribution rateCI1 0.727 0.804 0.692 0.764 0.613 −0.511 0.554 0.356 41.363 CI2 0.481 0.263 −0.437 −0.328 −0.455 −0.063 −0.027 0.712 57.842 CI3 0.335 0.342 −0.049 0.035 0.333 0.594 −0.661 −0.126 72.201 CI4 0.004 0.074 0.430 −0.219 −0.221 0.562 0.380 0.055 81.586 Table 5. Coefficients and contribution rates of comprehensive indices of the rice at the seedling stage
-
在0.5%盐浓度下,利用材料和方法中的公式计算出权重分别为50.70%,20.20%,17.60%,11.50%,及其各指标的隶属函数值和D值,根据D值对30份试验材料进行耐盐性综合指标排名(D值越大,耐盐性越强)。从表6中可知,按耐盐性综合指标排名,耐盐性较强的5个供试材料是14-57,14-6,14-36,W01,14-58-2;耐盐性较弱的5个供试材料是16-8,50188-2,16-9,15-18-2,14-58-1,但在0.3%盐浓度下,各品种(系)计算出的D值比0.5%盐浓度大,且大部分品种(系)之间D值相差较小,因此,采用0.5%盐浓度评价更好。根据全生育期田间耐盐试验结果,该结果与各材料的耐盐性实际情况基本吻合。
品种
VarietyCI1 CI2 CI3 CI4 UC11 UC22 UC33 UC44 D 耐盐性排名
Rank of salt tolerance14−6 1.07 1.25 −0.43 0.72 0.87 0.77 0.34 0.64 0.728 2 14−12 0.60 0.45 0.16 −0.63 0.75 0.57 0.50 0.38 0.629 12 14−30 −0.28 −0.30 0.07 −2.60 0.54 0.38 0.48 0.00 0.436 23 14−36 0.60 2.16 −0.38 0.05 0.75 0.99 0.36 0.51 0.705 3 14−39 0.51 −1.09 1.60 0.36 0.73 0.18 0.89 0.57 0.631 11 14−57 1.37 1.65 −0.89 −0.45 0.94 0.87 0.22 0.41 0.736 1 14−58−1 −1.89 −0.08 −1.70 −0.67 0.16 0.43 0.00 0.37 0.211 30 14−58−2 1.39 −0.83 0.08 −0.14 0.94 0.25 0.48 0.47 0.666 5 14−58−3 1.00 −0.14 0.10 −0.97 0.85 0.42 0.49 0.31 0.638 9 14−90 −0.37 −0.11 0.22 −1.25 0.52 0.43 0.52 0.26 0.471 21 14−563 −0.09 2.18 −0.13 0.18 0.59 1.00 0.42 0.53 0.637 10 14−776 −0.50 1.58 1.61 0.17 0.49 0.85 0.89 0.53 0.639 8 16−1 −0.30 −0.58 1.22 0.65 0.54 0.31 0.79 0.63 0.546 19 16−2 1.14 −0.85 −1.54 1.00 0.88 0.24 0.04 0.69 0.585 14 16−4 −0.12 −0.78 −1.70 0.30 0.58 0.26 0.00 0.56 0.412 25 16−7 −0.33 0.47 0.98 0.17 0.53 0.57 0.72 0.53 0.574 15 16−8 −0.54 −1.81 0.26 0.75 0.48 0.00 0.53 0.65 0.411 26 16−9 −2.56 0.17 0.06 0.56 0.00 0.50 0.47 0.61 0.254 28 16−10 −0.96 0.87 0.41 0.89 0.38 0.67 0.57 0.67 0.507 20 16−11 0.29 −0.05 1.16 0.61 0.68 0.44 0.77 0.62 0.641 7 16−14 −0.99 −0.09 −0.85 2.60 0.37 0.43 0.23 1.00 0.433 24 F633 0.36 −0.87 0.99 −0.99 0.70 0.24 0.73 0.31 0.564 16 W01 1.15 −0.01 −0.02 −0.10 0.89 0.45 0.45 0.48 0.676 4 W10 0.09 0.45 0.03 −1.04 0.63 0.57 0.47 0.30 0.551 18 50188−1 1.63 −0.84 −1.33 1.55 1.00 0.24 0.10 0.80 0.665 6 50188−2 −0.32 −1.13 −0.43 −1.06 0.53 0.17 0.34 0.30 0.401 27 15−18−1 −0.48 −0.20 2.00 1.01 0.50 0.40 1.00 0.69 0.589 13 15−18−2 −1.72 −0.16 −1.44 −0.74 0.20 0.41 0.07 0.36 0.238 29 9311 −0.23 −0.05 −0.63 −0.55 0.56 0.44 0.29 0.39 0.467 22 41332 0.48 −1.26 0.54 −0.37 0.73 0.14 0.60 0.43 0.552 17 CR/% 41.36 16.48 14.36 9.39 Wj/% 50.70 20.20 17.60 11.50 注:CR−表示贡献率,Wj−表示权重,CI−表示综合指标值,UC−表示隶属函数值,Dj−表示综合评价值。
Note: CR, contribution rate; Wj, weight;CI,comprehensive indices;UC ,membership function value;D,comprehensive evaluation value.Table 6. Comprehensive index value, weight, contribution rate, membership function value and comprehensive evaluation value of the rice at the seedling stage
-
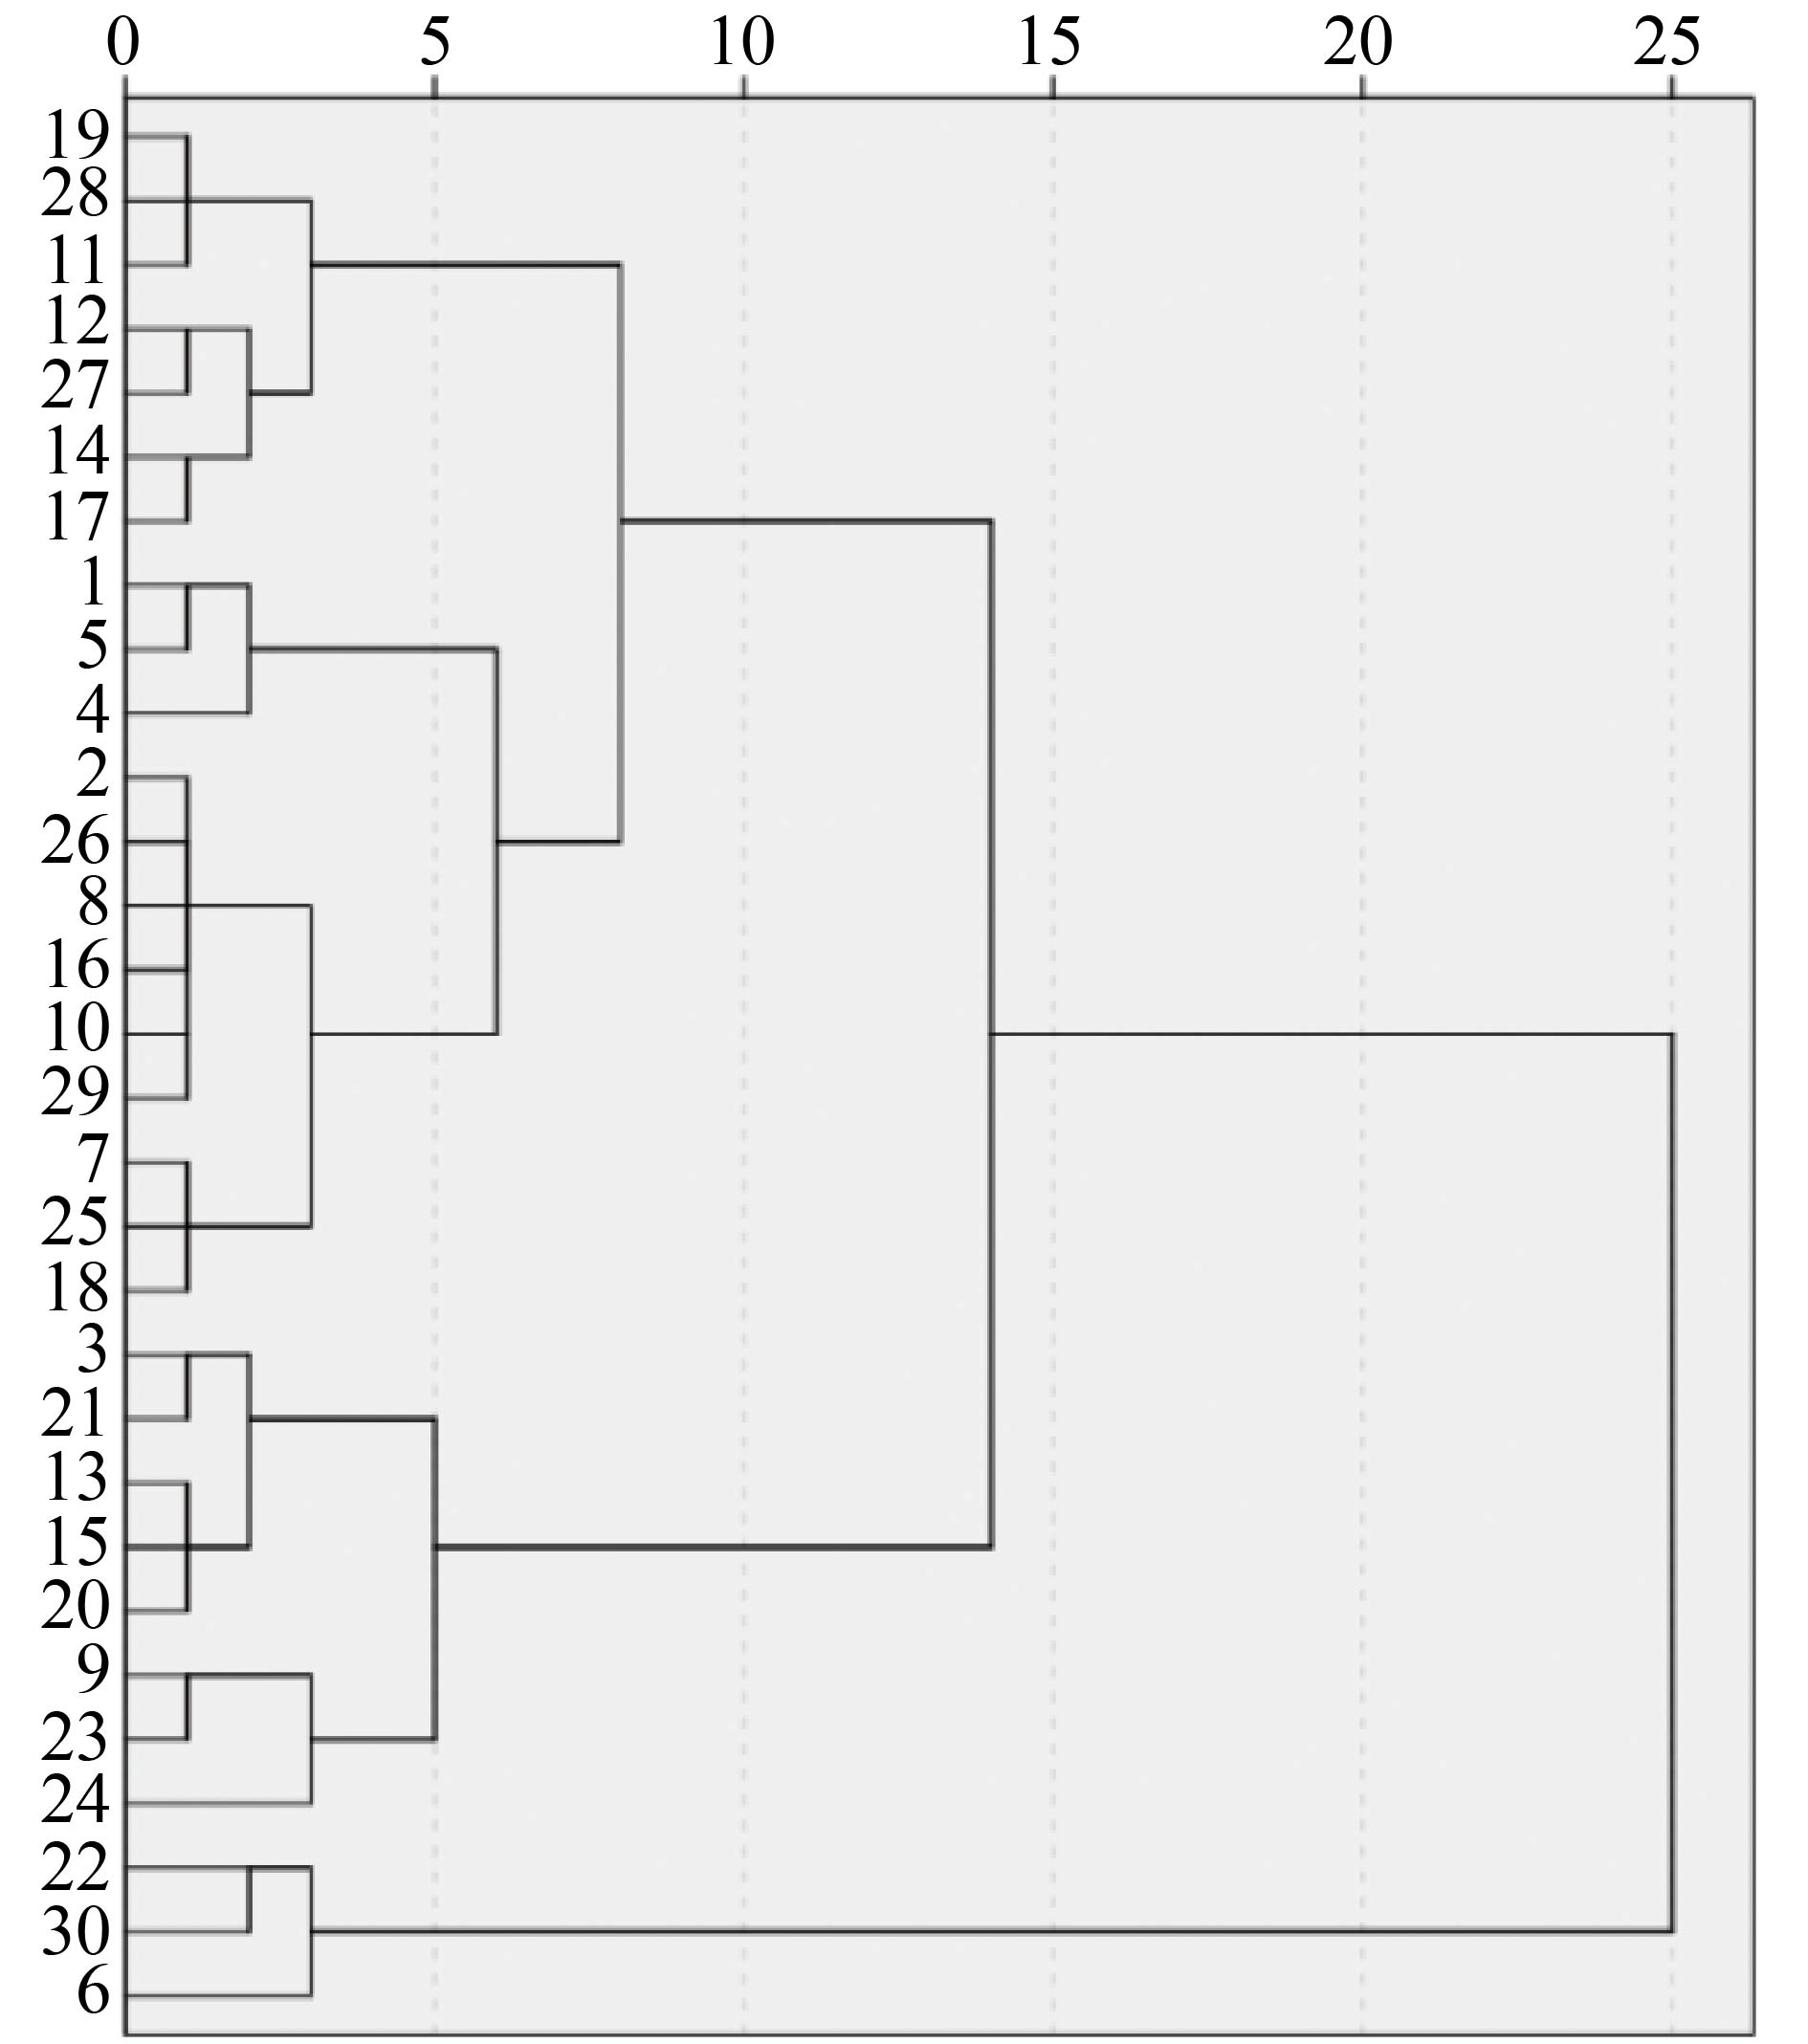
在0.3%盐浓度下聚类结果没有0.5%盐浓度的分级明显,因此,在0.5%盐浓度下,根据30份水稻品(系)综合评价结果(D值)进行了聚类分析(图1)。以欧式距离10为界限,把30个水稻品种聚类为3类,并结合耐盐性综合指标D值排名,将供试材料区分为以下3类:耐盐品种:W10,41332,16-1,16-2,15-18-1,16-7,F633,14-6,14-57,14-36,14-12,14-39,14-58-3,14-563,14-776,16-11,14-58-2,50188-1和W01;中间品种:14-30,16-14,16-4,16-8,50188-2,50188-1,14-90,9311和16-10;盐敏感品种:15-18-2,16-9和14-58-1。
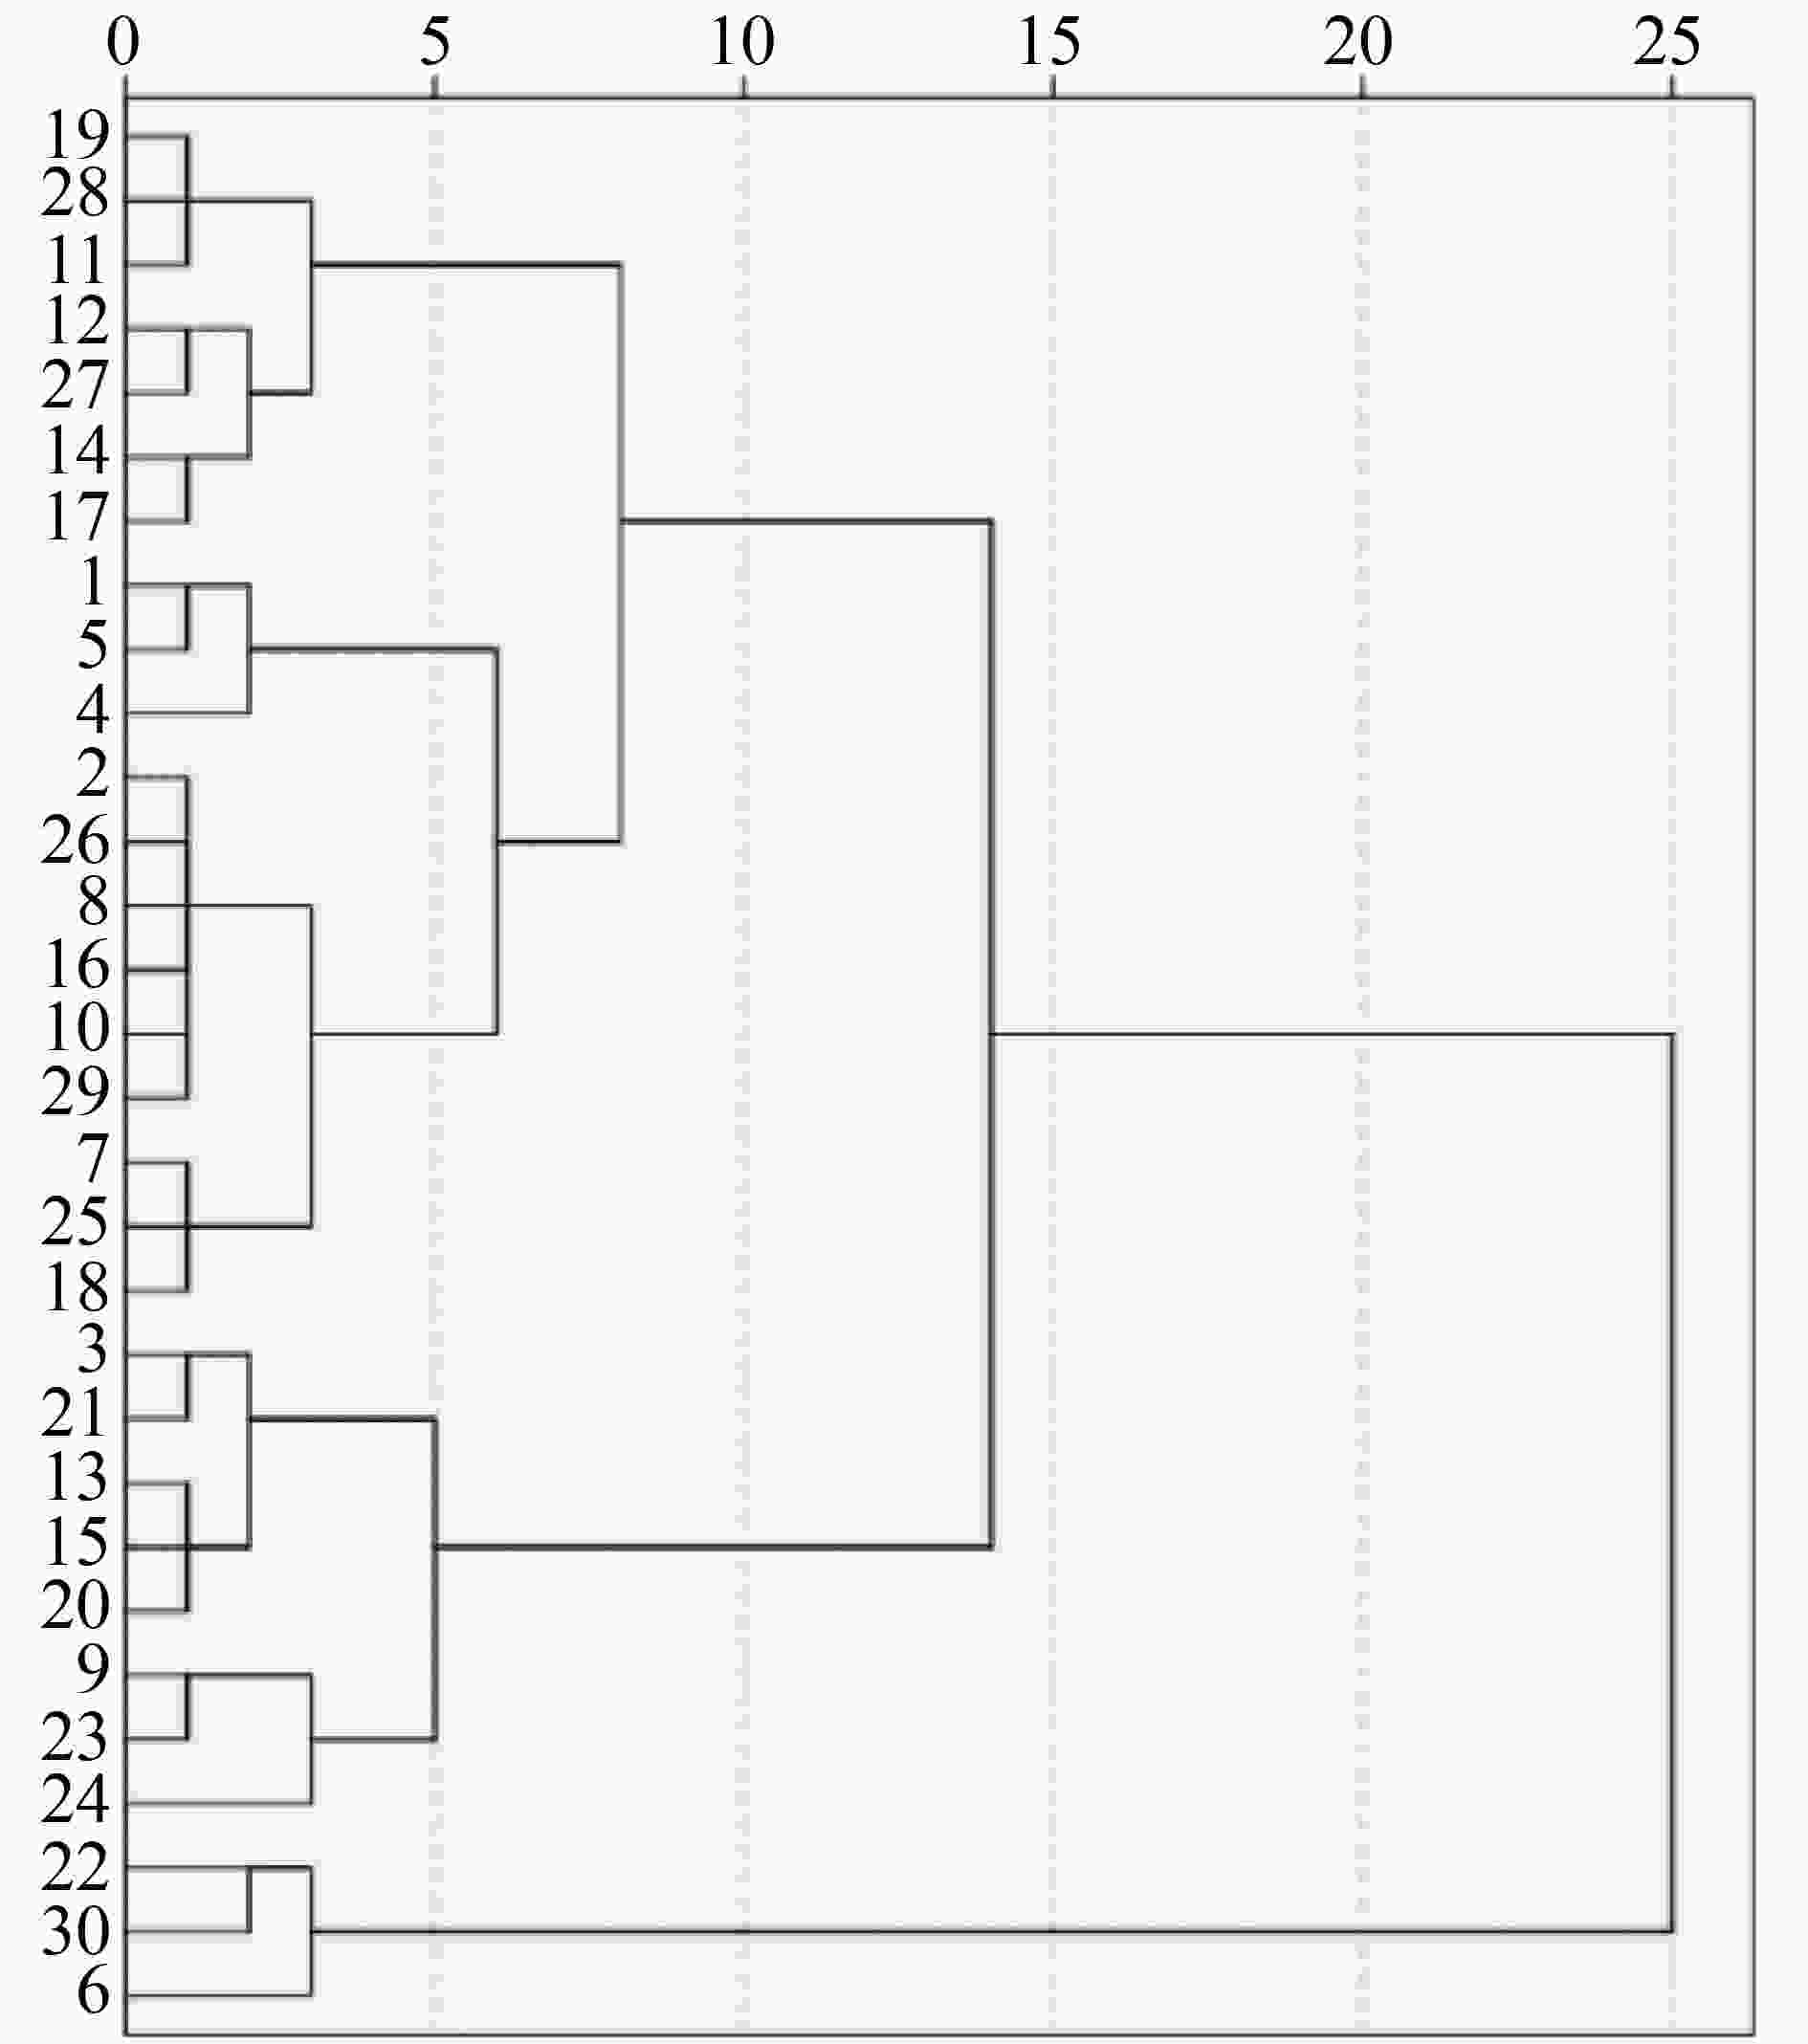
Figure 1. Systematic clustering of different rice varieties/lines
-
由于苗期指标繁多,因此需要挑选有效的耐盐指标进行评价,运用逐步回归分析,以D为因变量,其耐盐系数为自变量,建立可用于水稻苗期耐盐性评价的数学模型,筛选苗期可靠的耐盐性指标。在0.5%盐浓度下进行逐步回归分析,得到的回归方程为:D=−0.028+0.333X1+0.377X2+0.157X3,其中,回归方程的决定系数R2=0.991,P=0.000 1,X1,X2,X3分别代表WUE,Pn,FW。
从表7中可以看出,在苗期,各水稻品种(系)的估计精度均达到90%以上,说明Pn,WUE,FW的耐盐系数对水稻品种(系)综合耐盐性有着显著影响,但在0.3%盐浓度下对Pn,WUE,FW进行分析发现,预测精度仅在3%到13%之间。所以,在0.5%盐浓度下,Pn,WUE,FW在苗期评价水稻耐盐性可靠性高。
品种
Variety/line苗期 Seedling stage 品种
Variety/line苗期 Seedling stage 原始
Primary
value预测值
Predicted
value预测精度
Evaluation
accuracy/%原始
Primary
value预测值
Predicted
value预测精度
Prediction
accuracy/%14-6 0.73 0.73 99.97 14-563 0.64 0.61 95.47 14-12 0.63 0.65 96.97 F633 0.56 0.58 96.73 14-30 0.44 0.46 93.99 W01 0.68 0.72 93.03 14-36 0.70 0.70 99.73 W10 0.55 0.56 98.34 14-57 0.74 0.70 94.46 50188-2 0.40 0.44 90.39 14-58-1 0.21 0.23 92.13 16-14 0.43 0.44 97.78 14-58-2 0.67 0.67 99.34 15-18-2 0.24 0.24 97.88 14-58-3 0.64 0.63 98.54 9311 0.47 0.47 98.53 14-90 0.47 0.46 98.28 16-10 0.51 0.54 94.15 14-776 0.64 0.63 98.57 50188-1 0.67 0.67 99.31 16-1 0.55 0.57 96.24 14-39 0.63 0.60 95.19 16-2 0.58 0.55 94.25 15-18-1 0.59 0.55 94.09 16-4 0.41 0.43 94.53 41332 0.55 0.57 97.07 16-7 0.57 0.53 92.86 16-11 0.64 0.63 97.84 16-8 0.41 0.41 99.67 16-9 0.25 0.23 91.40 Table 7. Predicted values of physiological and biochemical indexes of the rice at the seedling stage
-
通过对水稻苗期进行盐胁迫处理,笔者研究了不同耐盐性水稻品种(系)的相关耐盐指标。对比0.3%盐浓度和0.5%盐浓度下水稻的耐盐性,结果显示,0.5%盐浓度下对水稻的耐盐性评价更好。在0.5%盐胁迫条件下,所有供试水稻材料叶片的Pn,WUE,TC均表现为显著性降低,并造成生物量(地上部鲜质量和质量)的降低,这与大多数研究结果一致[26-28)。另一方面,一些与代谢生理相关的指标,如MDA,SS,SP,Pro,POD等在盐胁迫处理后都不同程度地增加。水稻植株受盐胁迫后,细胞膜受到过氧化伤害,导致丙二醛含量增高,丙二醛的积累常作为叶片细胞膜受损程度的指标[29]。为了维持细胞膜的正常功能,植物会通过增加POD等氧化还原酶活性,增加Pro,SS,SP等渗透调节物质的含量以减轻盐胁迫造成的伤害[30-31]。本试验结果表明,尽管游离脯氨酸含量与净光合作用速率之间存在显著性相关关系,但总体来看,水稻苗期与代谢生理相关的指标与生长相关指标之间相关性较差,POD和SP与其他耐盐相关指标之间均不存在相关关系。最后,笔者用逐步回归分析把D值与预测D值的精度达到90%以上的指标进行选择,选出了3个(Pn,WUE,FW)对评价水稻苗期耐盐性有重要参考意义的指标。
在水稻的不同生育期和发育阶段,受盐胁迫的影响不同[21-22]。幼苗期是水稻耐盐能力强弱的关键阶段,水稻苗期的生理指标与水稻的耐盐性存在相关性[27],某种程度上可以苗期作为全生育期耐盐性水平的参照[23]。在水稻苗期耐盐性评价方面,已经有通过黄/死叶评价的目测法[32]、相对耐盐力法[33]、耐盐指数法[34]、主成分分析法[35]等评价方法。正如本研究结果中指出的,各指标的耐盐系数变化范围及各品种(系)的变化规律都表现出不一致,任何方法如果凭借单一的评价指标都难以准确地判断水稻品种的耐盐性。本研究在对30个耐盐性不同的水稻品种(系)进行单指标耐盐性评价的基础上,通过相关性分析筛选出相关性显著的耐盐指标,既避免了根据单一指标对水稻耐盐性评价的不确定性,也避免了由于评价指标过多,造成评价指标在某种程度上的重叠[36]。笔者通过主成分分析和隶函数法等方法,对30个水稻品种(系)在苗期的不同耐盐指标进行了分析和聚类,将参试水稻品种(系)分成了3类,分别为耐盐型、中间型和盐敏感型。
Identification and Evaluation of Salt Tolerance of 30 Rice Varieties/Lines
doi: 10.15886/j.cnki.rdswxb.2020.03.009
- Received Date: 2019-05-14
- Rev Recd Date: 2019-06-02
- Available Online: 2019-11-28
- Publish Date: 2020-09-24
-
Key words:
- Rice seedling /
- salt tolerance /
- evaluation indices /
- membership function
Abstract: Thirty rice varieties/lines with different salt tolerance were treated with NaCl at concentrations of 0 (CK), 0.3% and 0.5% at the seedling stage, and their salt tolerance index was determined, based on which their salt tolerance was analyzed and evaluated by using correlation analysis, principal component analysis and membership function. The results showed that the growth related indexes of the 30 varieties/lines above ground under salt stress, such as fresh weight (FW), dry weight (DW), net photosynthetic rate (Pn), water use efficiency (WUE) and chlorophyll content (TC), declined to some extents, while the indexes related to physiological metabolism, such as malondialdehyde (MDA) content, soluble sugar (SS) content, soluble protein (SP) content, free proline (Pro) content, peroxidase (POD) activity, etc, were elevated. These rice varieties/lines had higher variation in coefficients of salt tolerance of all the indexes, except Pro content, under the 0.5% NaCl treatment than under the 0.3% NaCl treatment, indicating that these varieties/lines under the 0.5% NaCl treatment displayed the highest difference in salt tolerance among all the treatments. All the indexes of the rice under the 0.5% NaCl treatment were used for correlation analysis to select the salt tolerance indexes of high significance from all the indexes for evaluation, based on which D value was calculated by using the membership function. The results showed that 5 lines, 14-57, 14-6, 14-36, W01, and 14-58-2, were highly tolerant of salt and that anther 5 lines, 16-8, 50188-2, 16-9, 15-18-2, and 14- 58-1, were low in salt tolerance. The stepwise regression analysis showed that the net photosynthetic rate (Pn), water use efficiency (WUE) and fresh weight (FW) of the leaves were the three most important indexes for evaluation of the salt tolerance of rice, based on which the estimation accuracy of salt tolerance of each rice variety/line were more than 90%. According to the comprehensive evaluation results, the 30 rice varieties/lines were divided into three categories, salt tolerant, moderately salt tolerant and salt sensitive, by using system clustering.
| Citation: | GU Xiao, WU Fugui, LIU Huifang, NIE Jiajun, GAO Hong, MA Qilin. Identification and Evaluation of Salt Tolerance of 30 Rice Varieties/Lines[J]. Journal of Tropical Biology, 2020, 11(3): 314-323. doi: 10.15886/j.cnki.rdswxb.2020.03.009

|
 DownLoad: