

-
山地生态系统在短垂直距离内拥有较强的环境异质性,是探究生物多样性格局及其潜在生态学过程的理想研究系统[1-2]。海拔梯度变化可通过直接改变温度、湿度等微气候条件,也可通过调控植被类型来间接改变栖息地环境,最终改变昆虫物种分布与群落组成差异[3],因此,生物多样性海拔梯度格局研究长期以来是生态学、生物地理学和保护生物学研究领域的热点之一[4-5]。
蝴蝶因生命周期短、对环境变化敏感且易于观测和鉴定,被广泛用作生物多样性动态监测对象[6-8],其分布现状、生活史与保护模式也备受关注[9]。目前,有关生物多样性海拔梯度格局研究已覆盖全球主要山脉,如东喜马拉雅[10]、安第斯山脉[11],以及秦岭[12]和高黎贡山[1]等。这些研究揭示了蝴蝶多样性与海拔梯度间的紧密联系,但其分布格局(如单调递减、单峰)因研究类群和系统不同而有所差异。例如,东喜马拉雅山脉蝴蝶丰富度随海拔呈单调递减趋势[10];而广东梅县阴那山蝴蝶物种数、丰富度指数随海拔呈先增后减的单峰格局,峰值出现在401~600 m海拔区间[13]。同时,研究焦点也从不同海拔群落的物种丰富度变化(α多样性)延伸至物种组成差异(β多样性),以更深入视角确定生物多样性海拔梯度格局和解析群落构建的潜在生态学过程[3]。此外,温度、湿度与植物资源对蝴蝶多样性的影响已被多项研究证实:东喜马拉雅山脉的研究发现,蝴蝶丰富度主要受年均温驱动[10];秦岭西段的调查发现,环境温度24~30℃、湿度70%~85%时蝴蝶群落结构更稳定,且较高的植被异质性可显著维持其多样性[12];巴西塞拉多地区的研究则指出,植物多样性和气候因子共同影响蝴蝶物种多样性海拔梯度格局[14]。
然而,上述研究较多以陆地型山地为对象,针对热带岛屿型山地系统的研究仍相对匮乏。与陆地型山地相比,热带岛屿型山地拥有独特的生物地理历史、更高的物种特有性,且因地理隔离可能导致更强的扩散限制和不同的群落构建机制[15],其多样性格局及驱动机制可能不同于陆地山地模式。海南热带雨林国家公园作为中国保存最完好的热带岛屿型山地之一,不仅生态系统完整、植被垂直带谱清晰[16],更因孤立的地理属性与连续的生境梯度,为检验陆地型山地生物多样性海拔梯度格局的普适性和揭示热带岛屿型山地独特的生物多样性形成机制提供了理想的研究系统。
截止目前,海南热带雨林国家公园有关蝴蝶的研究集中于资源勘查[17-18],多样性分布格局及影响因子鲜有报道。本研究以海南热带雨林国家公园霸王岭片区为研究区域,于2024年11月至2025年6月在海拔300~1 100 m梯度设置24条样线,系统调查蝴蝶与蜜源植物的数量、物种丰富度及群落组成,并同步记录其影响因子如海拔、温度、湿度的变化。本研究聚焦蝴蝶群落α多样性(物种丰富度、个体数)与β多样性(不同海拔群落物种组成差异),旨在(1)揭示霸王岭片区蝴蝶多样性海拔梯度格局,检验其是否符合经典的陆地型山地物种多样性海拔梯度格局;(2)明确平均温度、平均湿度与蜜源植物对蝴蝶α、β多样性的相对重要性;(3)评估环境过滤与生物相互作用在霸王岭片区蝴蝶群落构建的作用。研究结果有助于理解霸王岭片区蝴蝶多样性维持机制,并为海南热带雨林国家公园蝴蝶多样性保护与管理提供科学依据。
-
海南热带雨林国家公园是中国设立的第一批国家公园,属岛屿型热带雨林,也是中国分布最集中、保存最完好、连片面积最大的热带雨林[19]。霸王岭片区位于海南省昌江黎族自治县,总面积约880 km2,其中核心保护区为690 km2。霸王岭片区的生物资源丰富,已记录野生维管植物约2 523种,陆生脊椎动物约416种、昆虫2 100余种;该区域属热带海洋性季风气候,年均温约21.3℃,年降水量达1 657 mm。该片区拥有从低地沟谷雨林到高山苔藓矮林的完整垂直带谱,是研究生物多样性沿海拔梯度分布格局的理想研究系统;同时,该片区也是极危物种海南长臂猿全球唯一分布地,生物本底资料相对丰富,人为干扰较少,有利于解析蝴蝶多样性海拔梯度格局的构建机制。
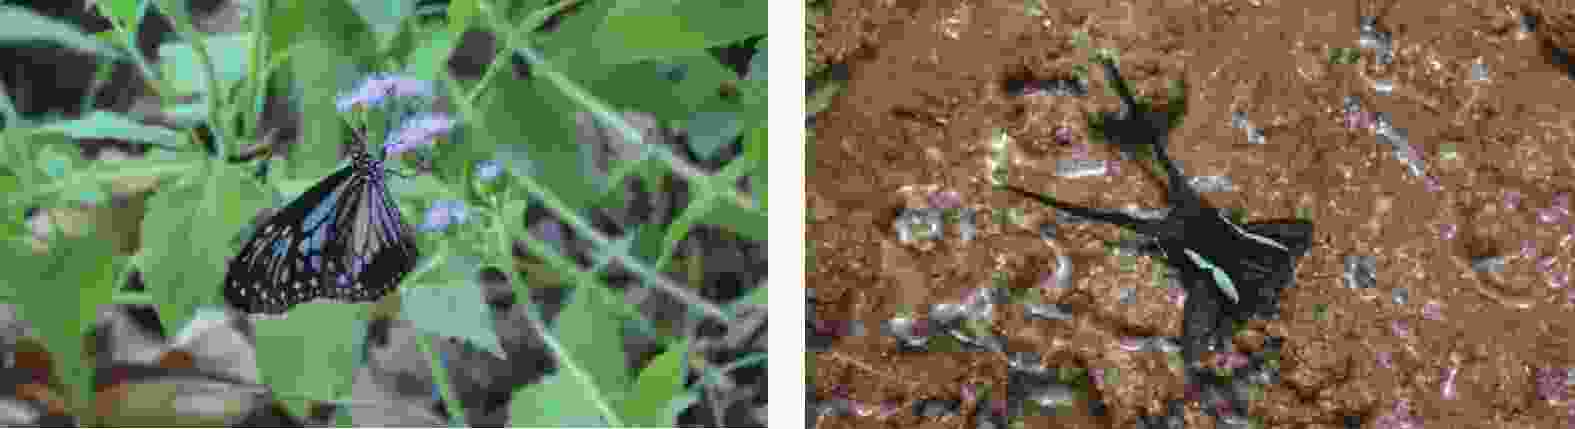
图 1 拍摄到黑绢斑蝶(蛱蝶科)吸食蜜源植物假臭草(左)和绿带燕凤蝶(凤蝶科)在溪流旁摄取水(右)
Figure 1. Images captured a butterfly Tirumala melanea (Nymphalidae)feeding on a nectar plant Praxelis clematidea (left)and a butterfly Lamproptera meges (Papilionidae)exhibiting water imbibition at the stream margin (right)
-
本研究采用样线法(line-transect method)对海拔300~1 100 m范围内蝴蝶多样性进行调查。以100 m为海拔间隔,将300~1 100 m海拔范围划分为8个连续的海拔调查区间,在每个100 m海拔区间内,结合山体地形,植被类型的典型性与野外采样可达性,均匀设置3条长度1 000 m的调查样线(表1)。调查人员于2024-11-26—2025-06-27沿上述样线调查时(约1 km·h-1),记录样线两侧宽3 m、上方5 m范围内所见的蝴蝶种类及其个体数。
表 1 各样线海拔、温度、湿度、蜜源植物个体数和丰富度、蝴蝶个体数、丰富度和调查覆盖度
Table 1. Elevation, temperature, humidity, individuals and richness of nectar plants, and individuals, richness and sample coverage of butterfly species for each transect
样线
Transect海拔区间
Elevational range海拔/m
Elevation/m蝴蝶个体数
Butterfly individuals蝴蝶丰富度
Butterfly richness蜜源植物丰富度
Nectarplant richness温度/℃
Temperature/℃湿度/%
Humidity/%调查覆盖度
Sample coverageS1 300~400 378 1 289 55 22 22.780 28.2 0.997 S2 386 503 48 30 22.188 26.1 0.994 S3 395 1 068 54 31 / / 0.993 S4 400~500 417 395 41 18 22.280 26.1 0.990 S5 446 416 35 26 / / 0.981 S6 480 325 33 23 22.178 28.7 0.985 S7 500~600 517 595 45 27 22.126 29.0 0.997 S8 548 596 52 24 21.755 31.8 0.990 S9 580 561 42 23 21.336 30.0 0.995 S10 600~700 616 472 45 43 21.199 27.2 0.994 S11 645 790 47 41 20.623 28.1 0.998 S12 680 651 59 44 21.513 30.2 0.989 S13 700~800 715 768 51 37 20.879 29.9 0.996 S14 748 669 45 35 21.052 32.2 0.996 S15 783 749 48 27 20.789 32.5 0.997 S16 800~900 815 579 43 35 19.767 32.0 0.998 S17 848 635 43 33 20.368 34.0 0.995 S18 882 656 50 34 20.333 28.0 0.994 S19 900~1 000 917 511 43 40 / / 0.996 S20 949 563 43 28 19.455 31.3 0.993 S21 982 607 43 42 18.116 35.3 0.995 S22 1 000~1 100 1 011 739 39 32 19.895 37.3 0.997 S23 1 026 775 46 32 19.828 37.6 0.994 S24 1 041 570 34 34 18.919 31.4 0.997 注:“/”表示因设备损坏而缺失的数据。 Note: “/” indicates data not available due to equipment failure. 对于无法现场识别的个体,使用捕虫网(网口直径38 cm,网深70 cm)进行捕获,用数码相机(佳能SX70HS)拍摄前后翅正反面和触角等关键形态特征后原地释放。物种鉴定参考inaturalist网站[20],物种分科参考《中国蝴蝶生活史图鉴》[21]。所有调查均在天气晴朗、风力微弱(小于3级)且日间气温较高的时段(9:00—16:00)进行,以便提高蝴蝶物种多样性覆盖度。为避免调查顺序对蝴蝶多样性的影响,所有样线采用随机顺序进行调查,研究周期内所有样线均调查10次,平均每次间隔约13 d。
-
为探究植物资源对蝴蝶多样性的影响,本研究在进行每条蝴蝶样线调查的同时,记录样线两侧3 m范围内所有蜜源植物的种类与数量。蜜源植物包括能为以花蜜、花粉为主要营养来源的访花动物(如蝴蝶)提供可利用的花蜜、花粉或其他甜汁类分泌物的植物,蜜源植物的物种鉴定主要参考《海南植物志》[22]和《中国植物志》[23]。本研究中的“蜜源植物丰富度(richness of nectar plant, RichN)”定义为每条样线两侧3 m范围内记录到的所有蜜源植物的物种数。
-
除蜜源植物多样性之外,海拔(elevation)、温度(temperature)和湿度(humidity)也可能对蝴蝶多样性产生影响[11]。本研究以奥维互动地图v10.3.6(北京元生华网软件有限公司,精度± 4 m)记录每条样线起点和终点海拔,取每条样线起点、终点海拔的算术平均值作为该样线的海拔。以每条样线上该算术平均值所在点为基准,使用土壤温湿度测量仪(TMS, TOMST company, Czech Republic)监测调查期间该点温度和湿度的变化,将该点温度和湿度的算术平均值作为该样线的平均温度(以下简称温度)和平均湿度(以下简称湿度)用于后续数据分析。
-
本研究所有数据分析均在R 4.5.1软件中进行[24]。先使用iNEXT软件包[25]计算各样线蝴蝶物种调查覆盖度以评估其群落调查完整性。为减少稀有物种对群落多样性分析的干扰以期提升模型稳健性,本研究剔除了所有样线累计个体数少于3的物种[26]。
为探究蝴蝶群落α多样性(物种丰富度和总个体数)的驱动因素,本研究构建了以海拔、温度、湿度、蜜源植物丰富度为自变量的线性和非线性回归模型。分析前所有线性模型的残差均通过Shapiro-Wilk检验进行正态性检验,同时计算方差膨胀因子(VIF)检验多重共线性,确保所有纳入模型的变量VIF < 10。利用MuMIn软件包[27],基于修正的赤池信息量准则(AICc)进行模型选择。此外,为检验线性假设是否成立,使用mgcv软件包构建了广义加性模型(GAM)[28](REML拟合),判断上述自变量与多样性指数是否存在显著非线性关系。
为探究沿海拔梯度蝴蝶群落物种组成和蜜源植物物种组成的变化,使用betapart软件包[29]计算Sørensen多群落和成对群落相异性指数(βSOR和βsor)、物种周转(βSIM和βsim)和嵌套(βSNE和βsne)组分;其中,βSOR = βSIM + βSNE, βsor = βsim + βsne。为解析影响因子对蝴蝶群落组成的影响,使用vegan软件包[30]进行Mantel检验;先将影响因子转换成欧氏距离矩阵,再检验其与成对蝴蝶群落相异性指数的相关性。
-
本研究共记录蝴蝶15 482头,隶属5科202种。各样线的蝴蝶累计个体数325~1 289头,调查覆盖度为0.981~0.998(表1),显示本研究中24条样线调查完整性较好。
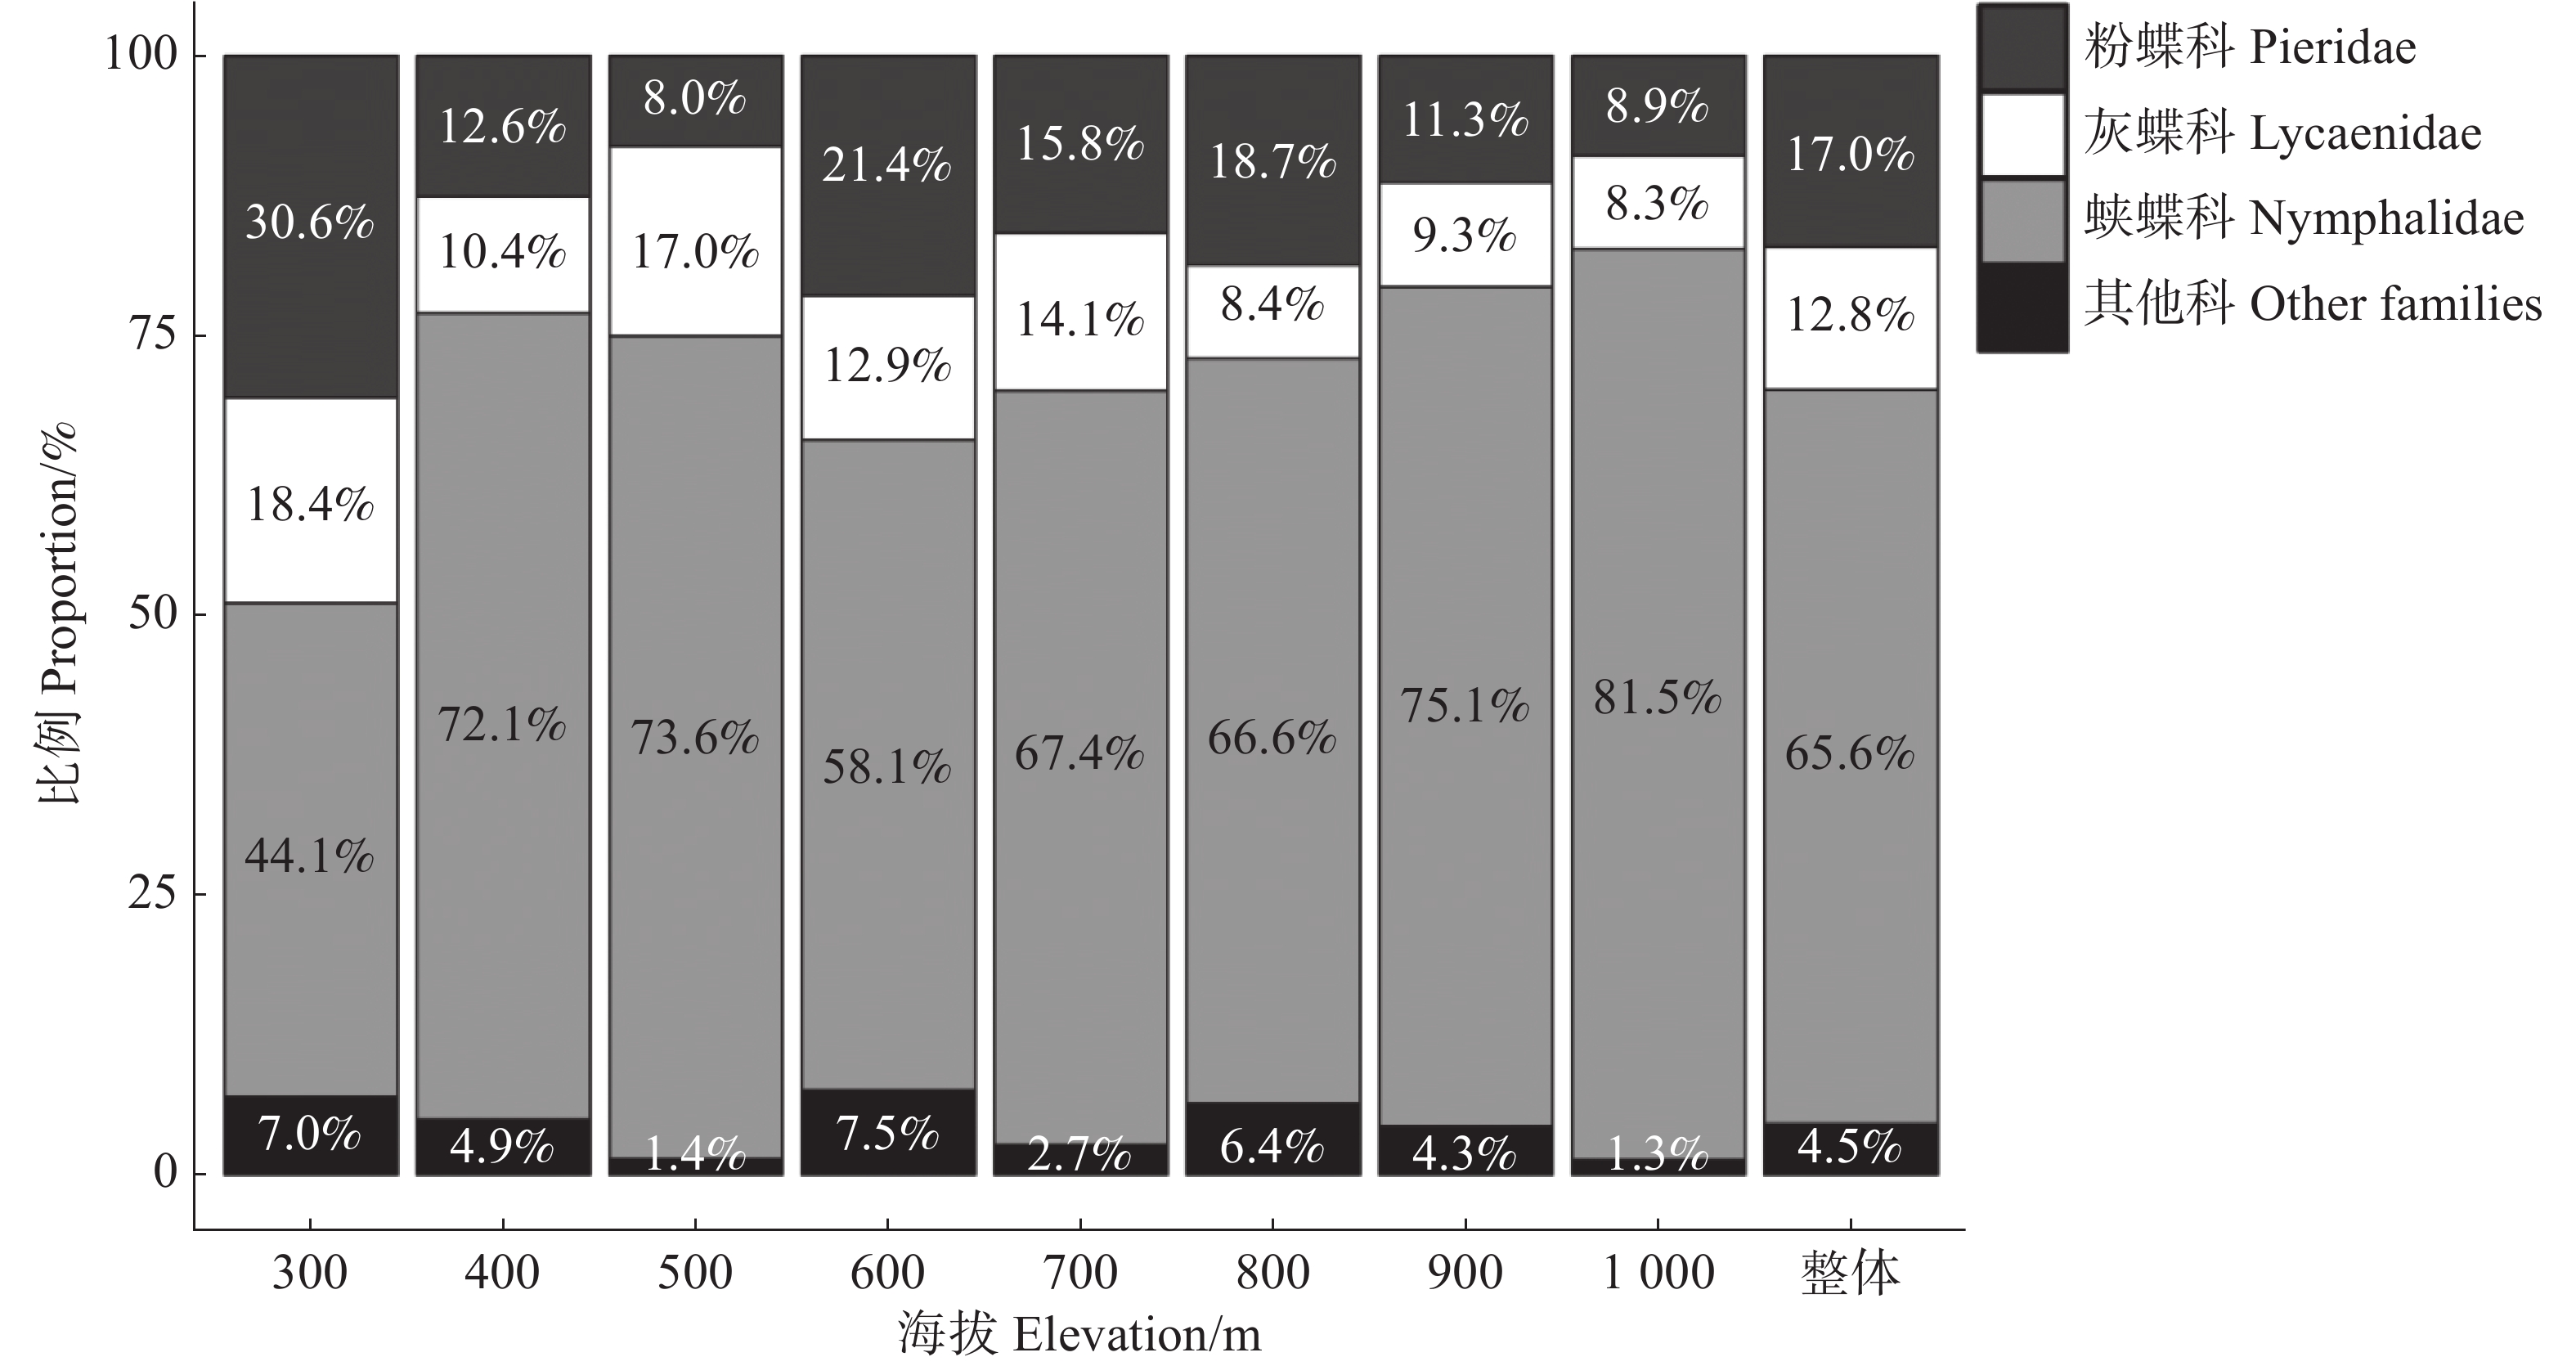
调查到的蝴蝶以蛱蝶科(Nymphalidae)、粉蝶科(Pieridae)和灰蝶科(Lycaenidae)为主,其个体数占蝴蝶总数的比例分别为65.6%、17.0%和12.8%,其他科为凤蝶科(Papilionidae)和弄蝶科(Hesperiidae),占比共计4.5%(图2)。
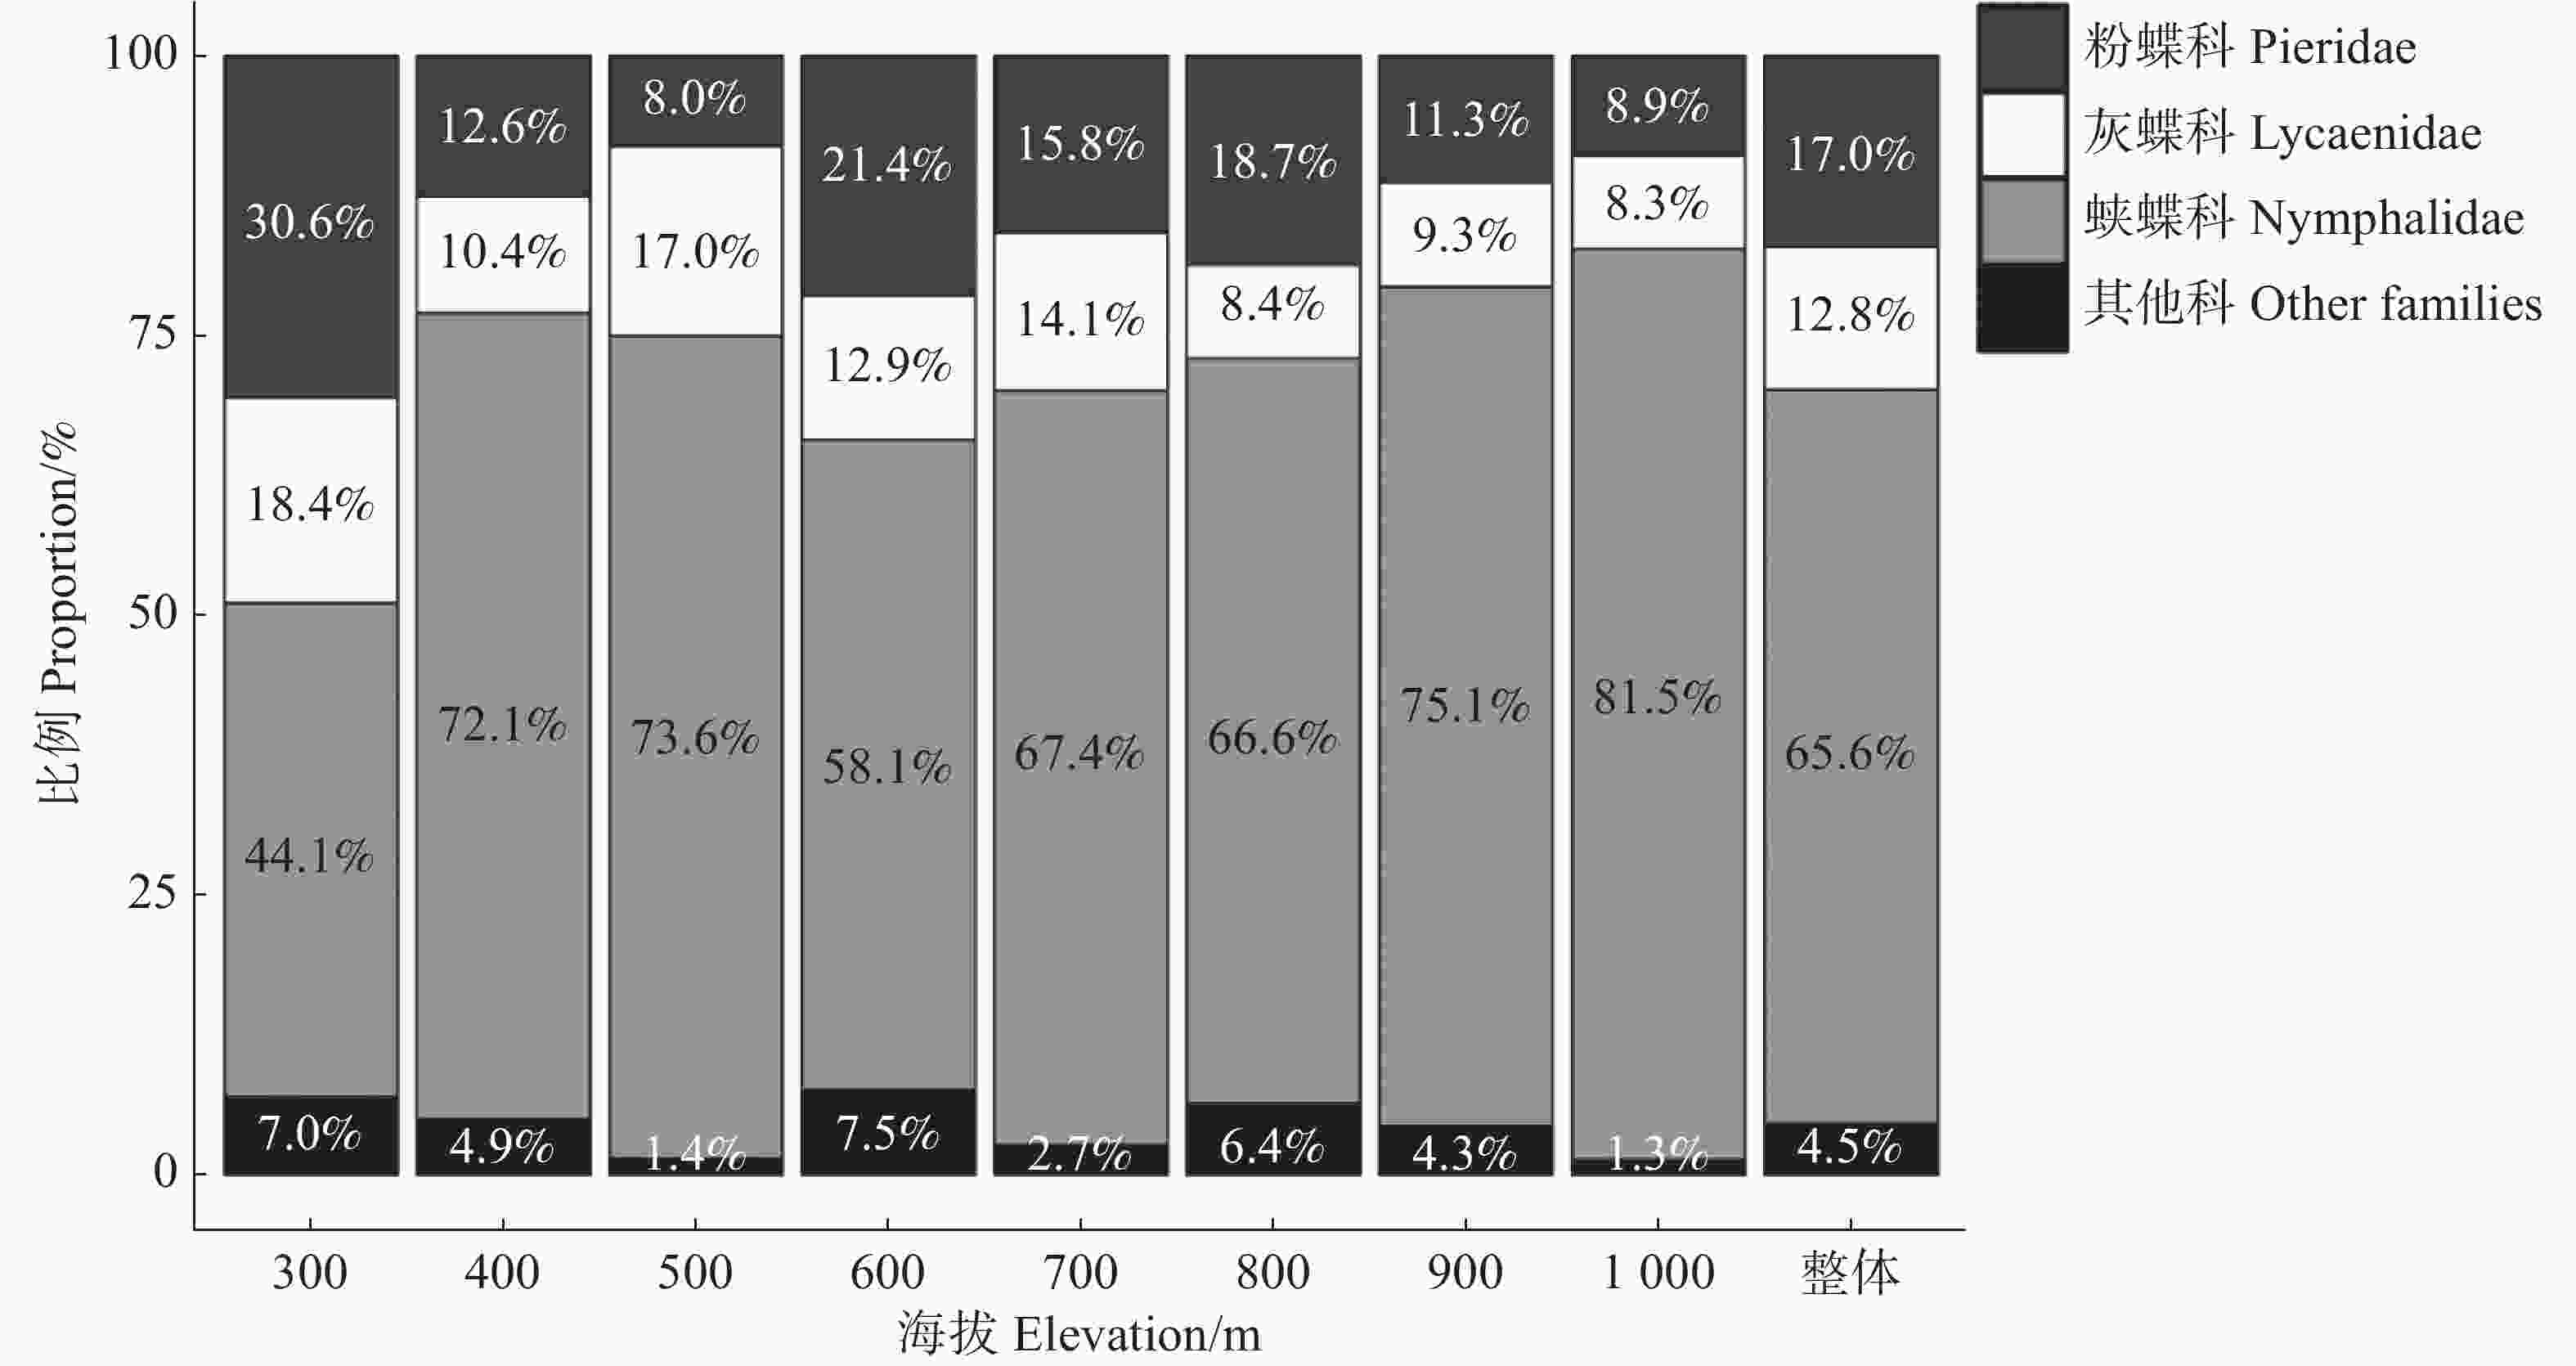
图 2 不同海拔科级蝴蝶个体数的比例
Figure 2. Proportion of butterfly individuals at family level within elevation
-
模型选择结果显示,在解释蝴蝶物种丰富度时,同时包含温度(temperature)和蜜源植物丰富度(RichN)组合的模型具有最低的AICc值和最高的权重(表2)。多变量线性回归进一步证实,温度和蜜源植物丰富度均对蝴蝶物种丰富度有显著的正影响,模型整体解释度为24.3%(表3)。广义加性模型分析结果与多元线性分析的结果一致。
表 2 蝴蝶物种丰富度影响因子的模型选择结果
Table 2. Model selection results for factors influencing butterfly richness
模型 Model AICc ΔAICc 权重 Weight 温度(temperature)+ 蜜源植物丰富度(RichN) 137.6 0.00 0.445 空模型(null, intercept only) 139.8 2.23 0.146 温度(temperature) 140.1 2.49 0.128 表 3 蝴蝶物种丰富度单变量与多变量回归模型
Table 3. Univariate and multivariate regression models for butterfly richness
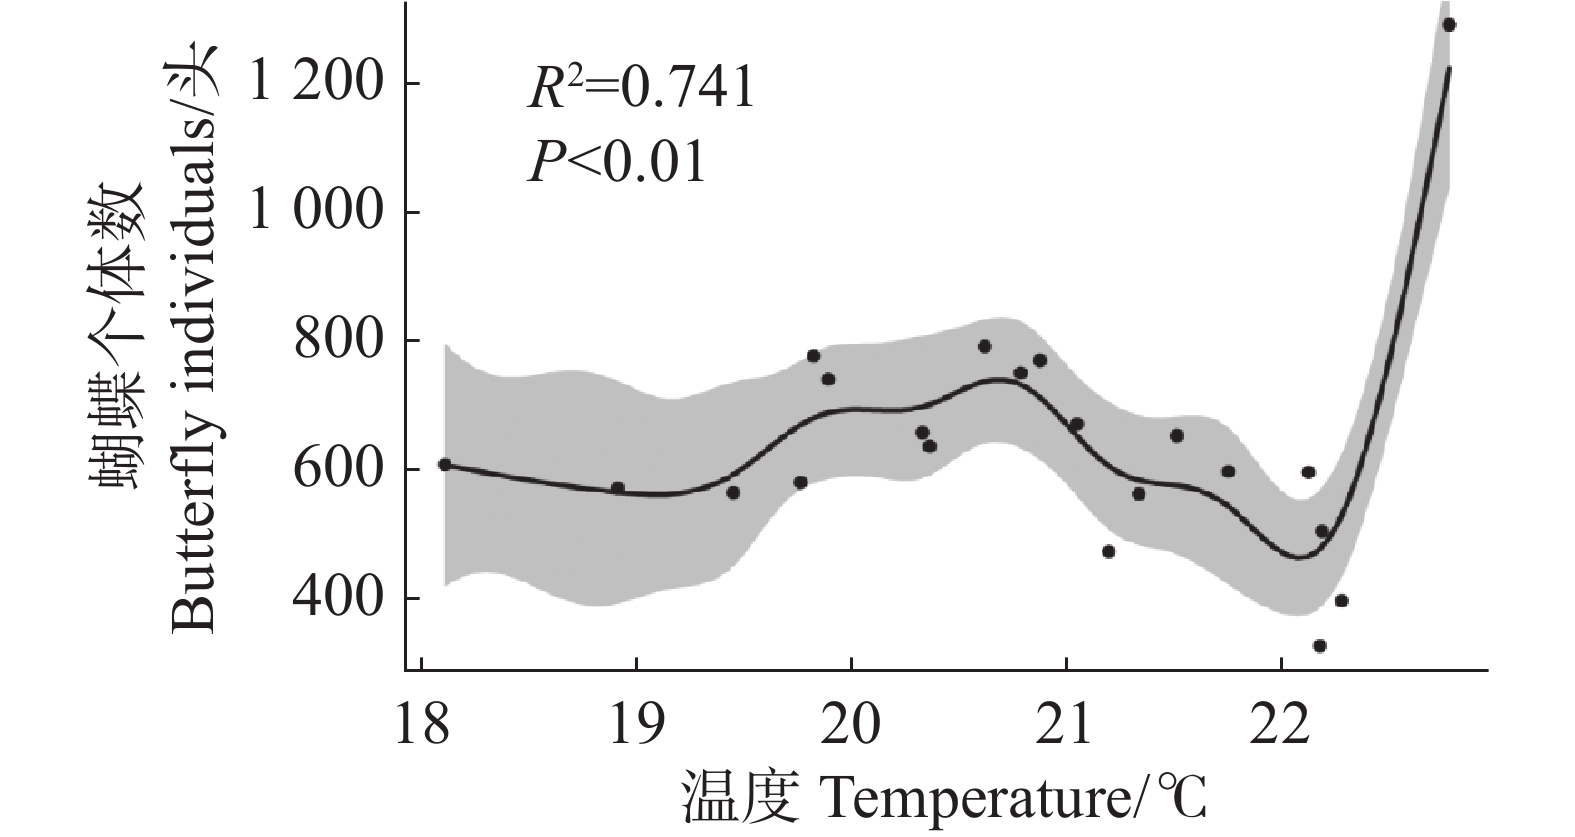
单变量模型 Univariate model 多变量模型 Multivariate model 回归系数 Coefficient P R² 回归系数 Coefficient P R² 蜜源植物丰富度(RichN) 0.185 0.339 −0.002 0.446 0.031 温度(temperature) 1.707 0.139 0.065 3.097 0.016 0.031 0.243 对于蝴蝶总个体数,模型选择结果显示零模型具有最低的AICc值和最高的权重(表4)。简单线性回归分析显示,所有影响因子与蝴蝶总个体数之间均不存在显著的线性关系(表5)。广义加性模型分析显示,温度对蝴蝶总个体数存在显著的非线性影响(edf = 7.031,P < 0.01),模型解释度为74.1%(图3)。
表 4 蝴蝶个体数影响因子的模型选择结果
Table 4. Model selection for factors influencing butterfly individuals
模型Mode AICc ΔAICc 权重Weight 空模型(null, intercept only) 283.9 0.00 0.612 湿度(humidity) 285.9 1.97 0.228 温度(temperature) 286.6 2.69 0.160 表 5 蝴蝶个体数与影响因子的简单线性回归分析结果
Table 5. Simple linear regression between butterfly individuals and influencing factors
回归系数 Coefficient P R2 海拔(elevation) 0.034 0.869 −0.051 温度(temperature) 8.291 0.821 −0.050 湿度(humidity) 1108.0 0.409 −0.015 蜜源植物丰富度
(RichN)0.785 0.897 −0.052 
图 3 温度与蝴蝶个体数的非线性关系
Figure 3. Nonlinear relationship between temperature and butterfly individuals
-
Sørensen多群落相异性指数结果显示,蝴蝶群落间总物种组成相异性(βSOR)为0.887,其中物种周转组分(βSIM)占总β多样性的98.1%。
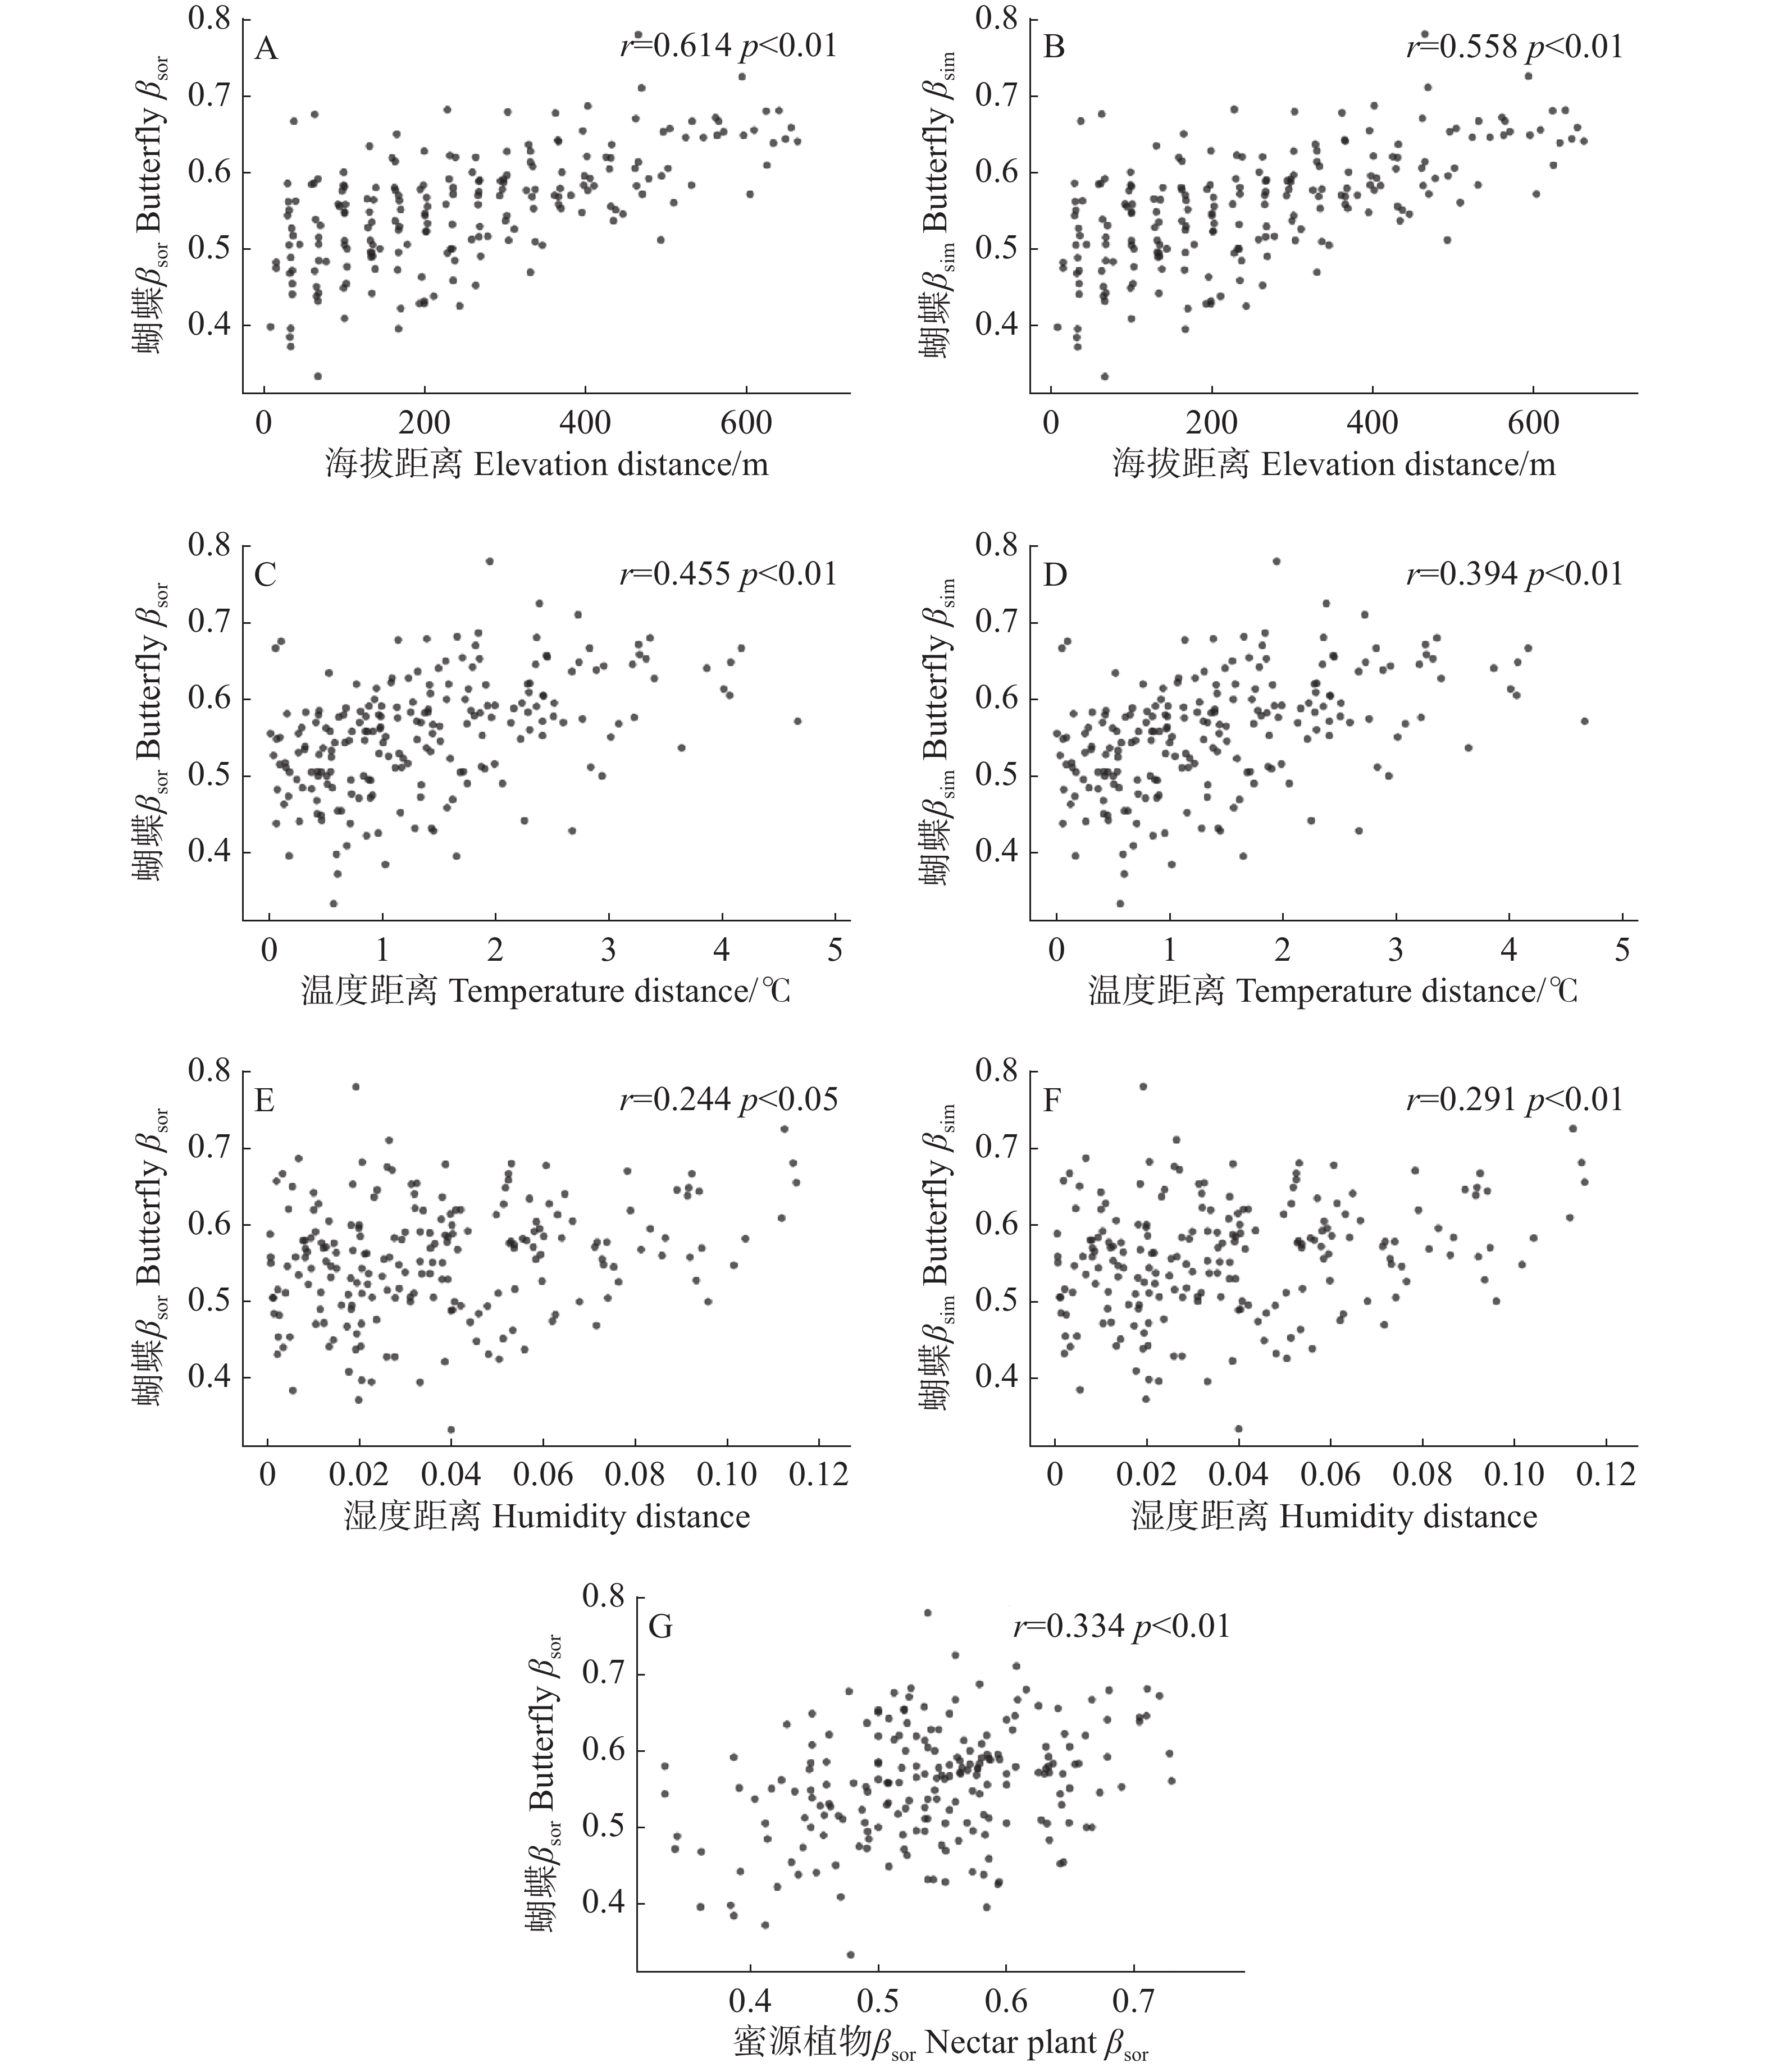
Mantel检验显示,海拔(r = 0.558, P < 0.01)、温度(r = 0.394, P < 0.01)和湿度(r = 0.291, P < 0.01)与蝴蝶群落βsim呈显著正相关;海拔(r = 0.614, P < 0.01)、温度(r = 0.455, P < 0.01)、湿度(r = 0.244, P < 0.05)和蜜源植物βsor(r = 0.334, P < 0.01)与蝴蝶群落βsor呈显著正相关;蝴蝶群落βsne与所有影响因子均无显著相关(图4)。
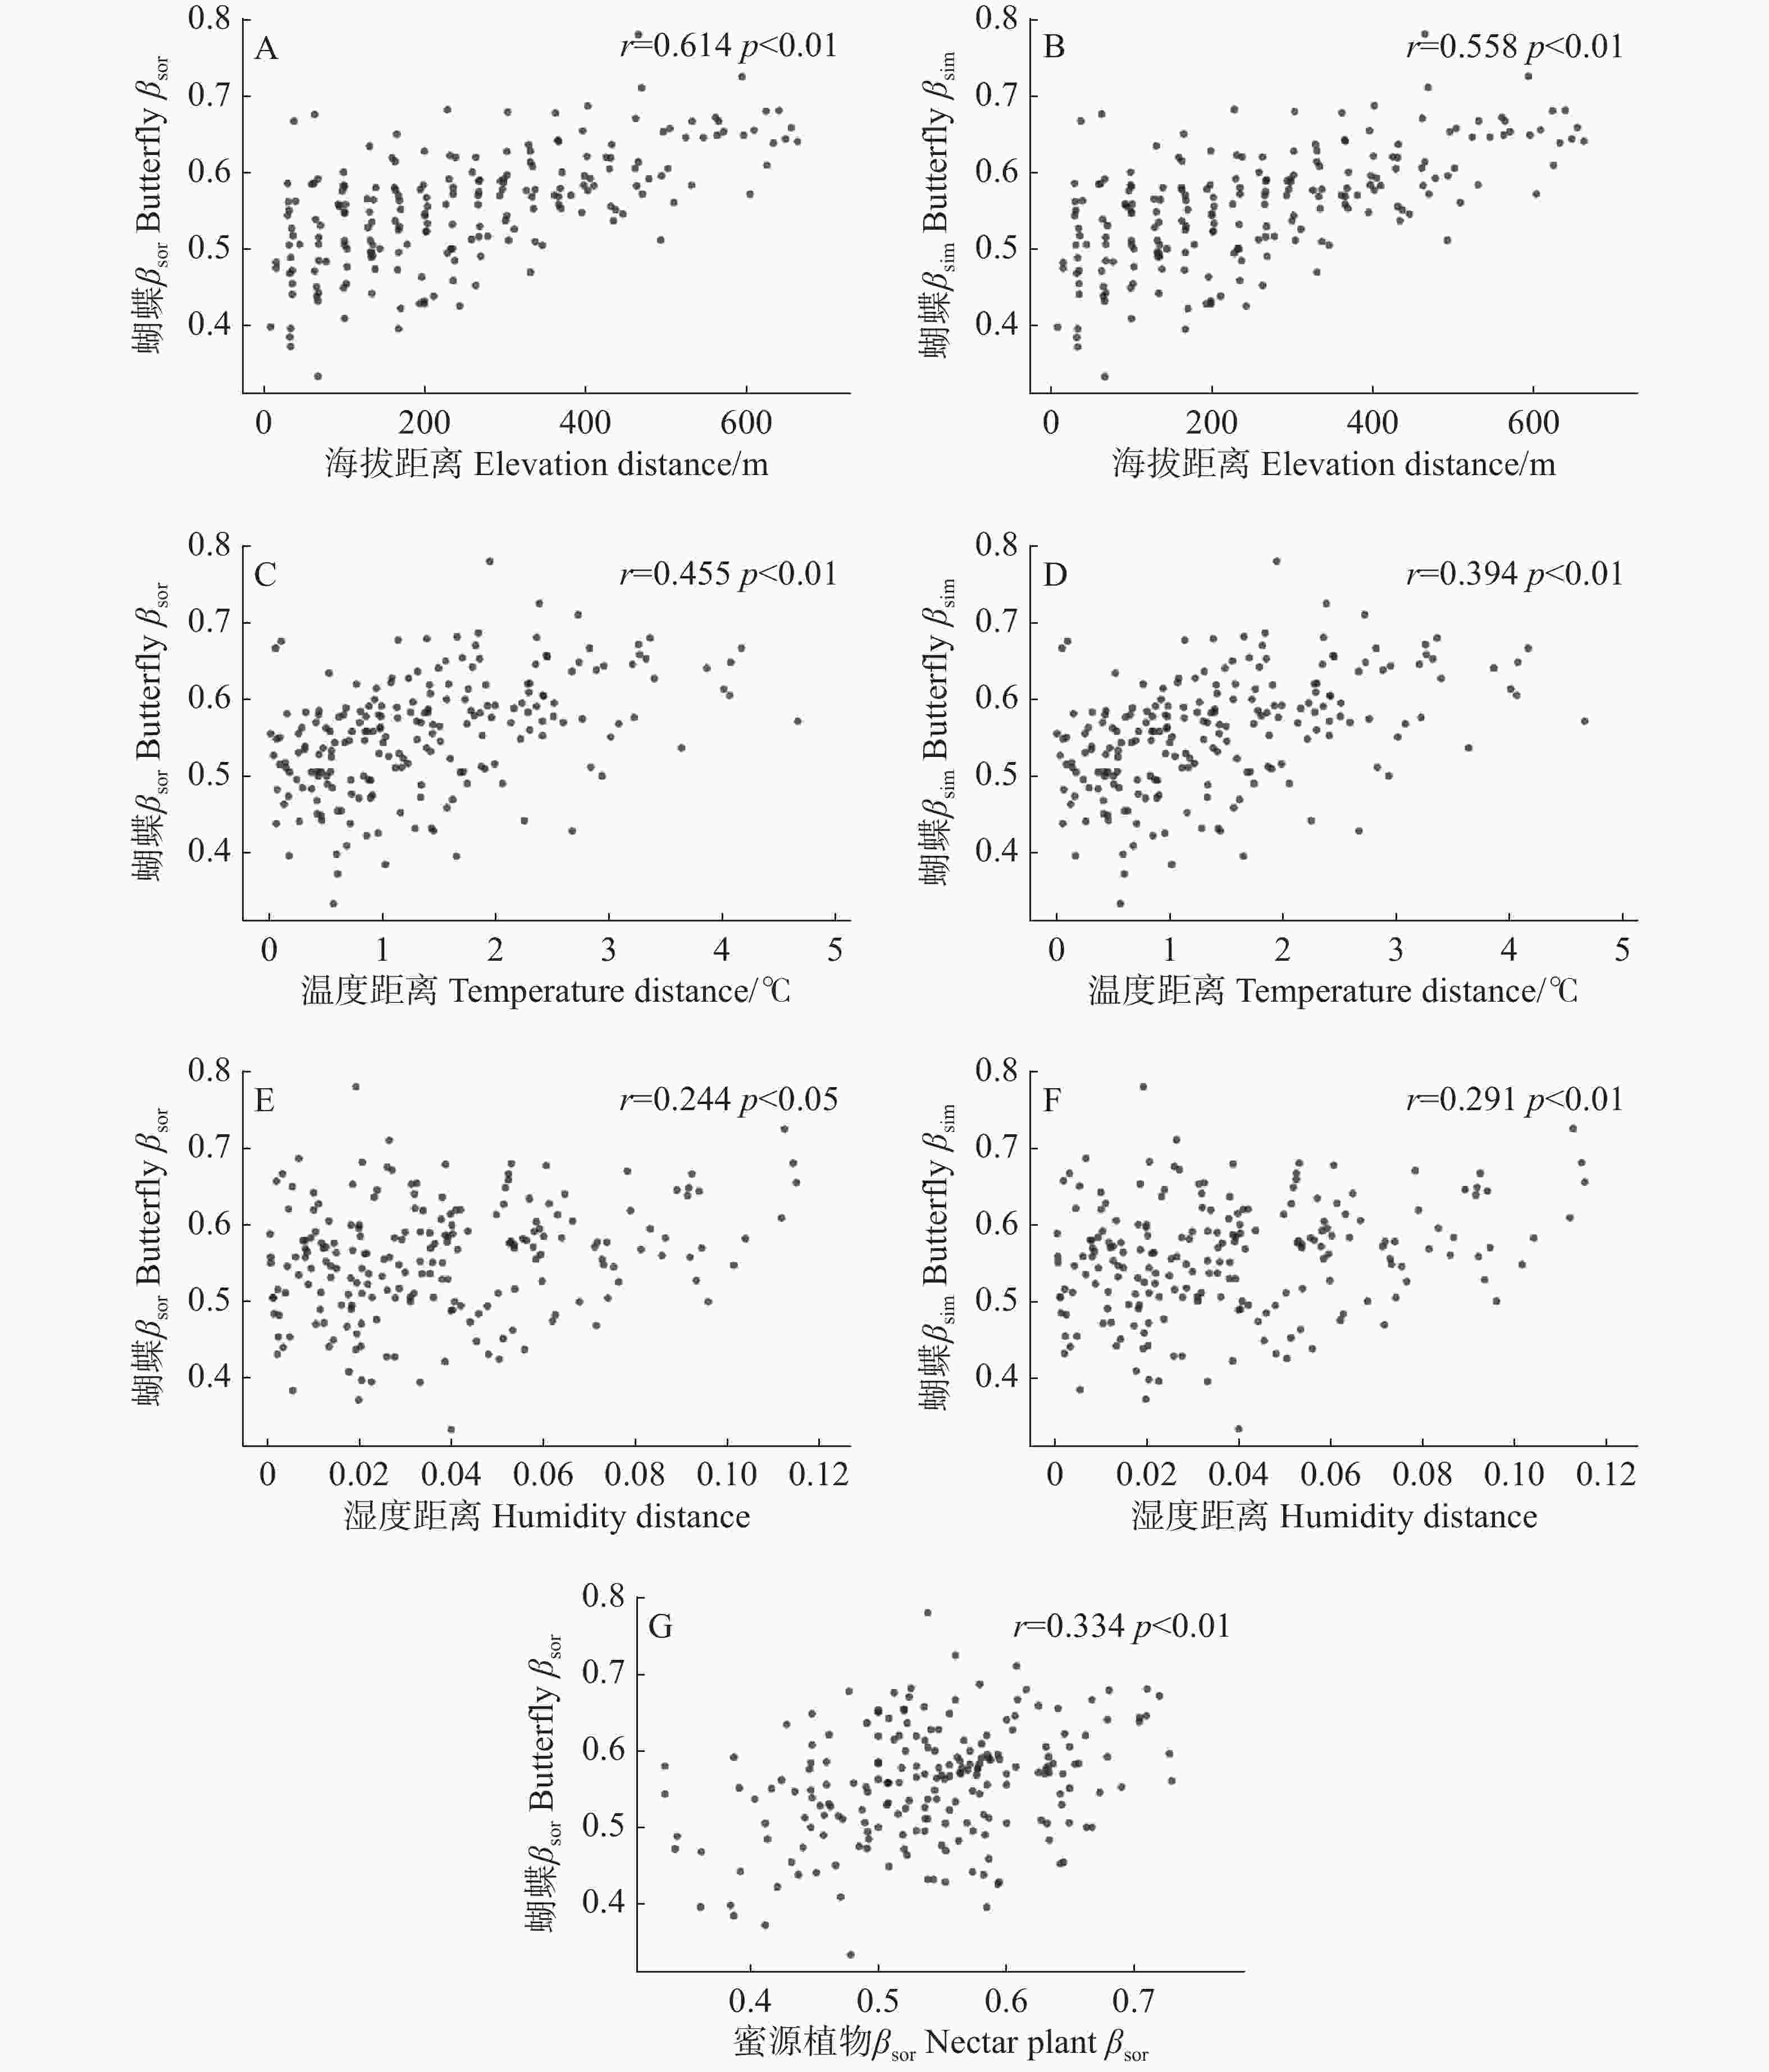
图 4 蝴蝶群落相异性指数βsor(A、C、E)、物种周转βsim(B、D、F)与影响因子距离矩阵(海拔、温度、湿度)及蜜源植物相异性指数βsor(G)显著性相关分析结果
Figure 4. Significant results of Mantel tests between butterfly community dissimilarity index βsor (A, C, E), species turnover βsim (B, D, F), and distance of influencing factors (elevation, temperature, humidity)and nectar plant βsor (G)
-
本研究发现,海拔本身与蝴蝶物种丰富度及个体数均未呈现显著的直接线性或非线性关系,其生态效应可能主要通过改变热量条件和蜜源植物间接实现[31]。霸王岭片区海拔效应的弱化,凸显了在热带岛屿山地生态系统的特殊性:海拔作为复合背景梯度,通过与温度、植物资源的紧密耦合,间接塑造蝴蝶多样性格局[32]。本研究结果表明,海拔对海南热带雨林国家公园霸王岭片区山地蝴蝶多样性的调控依赖具体影响因子的中介作用,其通过调控温度、蜜源植物丰富度间接塑造蝴蝶的多样性格局。
模型选择与多变量回归结果均显示,温度与蜜源植物丰富度共同驱动了霸王岭片区的蝴蝶物种丰富度。温度作为关键的热量指标,直接影响蝴蝶的生理代谢与生存阈值[33]。阿尔卑斯山的研究证实低温环境通过环境过滤作用排除非耐低温型物种,调控蜜蜂群落丰富度[34]。蜜源植物的关键作用可能源于其提供的双重资源:既为成蝶提供花蜜(能量来源),也为蝴蝶幼虫提供寄主植物(繁殖基础),通过创造多样化生态位支撑物种共存[35]。西班牙热带海岸带的研究也指出,植物作为食物资源直接影响蝴蝶物种的分布与多样性[36],进一步印证了蜜源植物资源在蝴蝶物种丰富度中的决定作用。
与物种丰富度不同,蝴蝶个体数仅与温度呈显著非线性增加,与其他影响因子无显著线性关系。这一结果可能与蝴蝶的生理特性有关。Kingsolver等[37]在野外监测蝴蝶的飞行时发现,大多数蝴蝶需要维持较高的体温才能飞行,这通常依赖外部热源(如太阳辐射)来实现。亚马逊地区的蝴蝶群落在高温和中等降雨的月份具有最高的蝴蝶物种丰富度和个体数[38]。这些结论为本研究结果中温度对蝴蝶个体数非线性决定提供了机制支撑,进一步验证温度是决定蝴蝶个体数的关键影响因子之一。
-
本研究明确,海拔是塑造霸王岭片区蝴蝶β多样性空间格局的核心因素之一,其通过整合温度、湿度、蜜源植物β多样性形成强烈的环境筛选,驱动蝴蝶群落以物种周转为主要生态过程的β多样性分异。这与Dewan等[39]在东喜马拉雅300~3 000 m梯度的发现高度呼应,两地均证实海拔介导的环境异质性是群落分异的核心,且物种周转贡献远超地理隔离效应。蜜源植物群落βsim对蝴蝶βsim未表现出显著影响,其仅对蝴蝶总β多样性(βsor)存在极显著正向效应,且该效应的作用强度显著低于海拔、温度对蝴蝶对应β多样性指数的驱动效应,蜜源植物βsor虽对蝴蝶βsor存在显著影响(r = 0.334, P < 0.01),但其作用强度低于海拔(r = 0.614, P < 0.01)与温度(r = 0.455, P < 0.01)的效应,这与Zellweger等[40]对欧洲中部山地的研究结论一致:该研究证实植物β多样性虽能提升蝴蝶β多样性的预测精度,但以温度为核心的影响因子与海拔通过环境过滤作用驱动的群落分异,仍是蝴蝶β多样性形成的首要动力,植物群落的更替更多是环境筛选作用下的伴随结果。综上所述,海拔作为复合环境梯度载体,其整合的温度、湿度和蜜源植物β多样性等要素形成的环境筛选效应共同塑造了海南热带雨林国家公园霸王岭片区蝴蝶群落β多样性海拔梯度格局。
-
本研究发现,海南热带雨林国家公园霸王岭片区温度与蜜源植物丰富度共同塑造蝴蝶群落物种丰富度,蝴蝶个体数仅与温度呈显著非线性增加;海拔通过整合温度、湿度和蜜源植物β多样性形成环境筛选,主导以物种周转为核心的蝴蝶群落β多样性分异,表明各海拔带均对霸王岭片区蝴蝶多样性有独特贡献。本研究可为海南热带雨林国家公园蝴蝶物种多样性保护提供一定参考。
致谢:本研究得到了海南热带雨林国家公园综合调查与监测(二期)海南热带雨林国家公园资源本底综合调查与监测项目-野生动物资源调查的经费支持。海南热带雨林国家公园霸王岭分局对本研究予以大力支持,海南大学热带农林学院曾驰博士在野外调查期间提出的建设性意见。
海南热带雨林国家公园霸王岭片区蝴蝶多样性海拔梯度格局及影响因子
DOI: 10.15886/j.cnki.rdswxb.20250173
 CSTR: 32425.14.j.cnki.rdswxb.20250173
Diversity patterns of butterfly assemblages along an elevational gradient and influencing factors in the Bawangling region of Hainan Tropical Rainforest National Park
-
摘要: 为探究海南热带雨林国家公园蝴蝶多样性沿海拔梯度格局及影响因子,在霸王岭片区沿海拔300~1 100 m梯度设置了24条样线,于2024年11月至2025年6月系统调查了样线上蝴蝶和蜜源植物物种个体数、物种丰富度、物种组成、物种周转和物种嵌套,并同步测量了海拔,监测了温度、湿度的变化。结果表明:10次调查记录到蝴蝶5科202种,共15,482头。温度和蜜源植物丰富度是决定霸王岭片区蝴蝶物种丰富度的关键因素,而蝴蝶个体数仅与温度存在显著的非线性关系;蝴蝶β多样性主要由物种周转主导,海拔、湿度和蜜源植物是驱动这一过程的重要影响因子,表明各海拔区间均对霸王岭片区蝴蝶多样性有独特贡献。研究结果深化了霸王岭片区蝴蝶多样性维持机制的认识,可为海南热带雨林国家公园的蝴蝶多样性保护提供参考。Abstract: To explore the distribution patterns of butterfly diversity and influencing factors along an elevational gradient in Hainan Tropical Rainforest National Park, 24 line transects were establised along a 300–
1100 m gradient in the Bawangling region to make a systematical survey of the number of individuals, species richness, species composition, species turnover and species nestedness of butterflies and nectar plants within each transect from November 2024 to June 2025. The elevation and variations in temperature and humidity were simultaneously monitored for each transect. A total of15482 butterfly individuals belonging to 202 species and 5 families were recorded during 10 surveys. The results showed that temperature and nectar plant richness were the key influencing factors determining the butterfly richness in the Bawangling region, while the number of butterfly individuals only exhibited a significant non-linear increasing with temperature. Butterfly β-diversity was primarily driven by species turnover, which was determined by distance of elevation, temperature, humidity and nectar plant. This suggested that each elevation makes its unique contribution to butterfly diversity of the Bawangling region. These findings deepen the understanding of the mechanisms structuring butterfly diversity in the Bawangling region and provide a scientific basis for conservation of butterfly diversity in Hainan Tropical Rainforest National Park. -
图 2 不同海拔科级蝴蝶个体数的比例
Fig. 2 Proportion of butterfly individuals at family level within elevation
图 3 温度与蝴蝶个体数的非线性关系
注:阴影部分代表95%置信区间,方程为butterfly $ \text{individuals = 642.24 + s(temperature) + ε} $,butterfly$ \text{individuals} $为蝴蝶个体数,$ \text{s(temperature)} $代表温度的平滑项,$ \text{ε} $代表残差。
Fig. 3 Nonlinear relationship between temperature and butterfly individuals
Note: The shaded area represents the 95% confidence interval. The equation is butterfly $ \text{individuals} $ = 642.24 + s (temperature)+ ε, where butterfly $ \text{individuals} $ denotes total butterfly $ \text{individuals} $ for each transect. s (temperature)denotes the smooth term for temperature, and ε denotes the residual.
图 4 蝴蝶群落相异性指数βsor(A、C、E)、物种周转βsim(B、D、F)与影响因子距离矩阵(海拔、温度、湿度)及蜜源植物相异性指数βsor(G)显著性相关分析结果
Fig. 4 Significant results of Mantel tests between butterfly community dissimilarity index βsor (A, C, E), species turnover βsim (B, D, F), and distance of influencing factors (elevation, temperature, humidity)and nectar plant βsor (G)
表 1 各样线海拔、温度、湿度、蜜源植物个体数和丰富度、蝴蝶个体数、丰富度和调查覆盖度
Table 1 Elevation, temperature, humidity, individuals and richness of nectar plants, and individuals, richness and sample coverage of butterfly species for each transect
样线
Transect海拔区间
Elevational range海拔/m
Elevation/m蝴蝶个体数
Butterfly individuals蝴蝶丰富度
Butterfly richness蜜源植物丰富度
Nectarplant richness温度/℃
Temperature/℃湿度/%
Humidity/%调查覆盖度
Sample coverageS1 300~400 378 1 289 55 22 22.780 28.2 0.997 S2 386 503 48 30 22.188 26.1 0.994 S3 395 1 068 54 31 / / 0.993 S4 400~500 417 395 41 18 22.280 26.1 0.990 S5 446 416 35 26 / / 0.981 S6 480 325 33 23 22.178 28.7 0.985 S7 500~600 517 595 45 27 22.126 29.0 0.997 S8 548 596 52 24 21.755 31.8 0.990 S9 580 561 42 23 21.336 30.0 0.995 S10 600~700 616 472 45 43 21.199 27.2 0.994 S11 645 790 47 41 20.623 28.1 0.998 S12 680 651 59 44 21.513 30.2 0.989 S13 700~800 715 768 51 37 20.879 29.9 0.996 S14 748 669 45 35 21.052 32.2 0.996 S15 783 749 48 27 20.789 32.5 0.997 S16 800~900 815 579 43 35 19.767 32.0 0.998 S17 848 635 43 33 20.368 34.0 0.995 S18 882 656 50 34 20.333 28.0 0.994 S19 900~1 000 917 511 43 40 / / 0.996 S20 949 563 43 28 19.455 31.3 0.993 S21 982 607 43 42 18.116 35.3 0.995 S22 1 000~1 100 1 011 739 39 32 19.895 37.3 0.997 S23 1 026 775 46 32 19.828 37.6 0.994 S24 1 041 570 34 34 18.919 31.4 0.997 注:“/”表示因设备损坏而缺失的数据。 Note: “/” indicates data not available due to equipment failure.  下载: 导出CSV
表 2 蝴蝶物种丰富度影响因子的模型选择结果
Table 2 Model selection results for factors influencing butterfly richness
模型 Model AICc ΔAICc 权重 Weight 温度(temperature)+ 蜜源植物丰富度(RichN) 137.6 0.00 0.445 空模型(null, intercept only) 139.8 2.23 0.146 温度(temperature) 140.1 2.49 0.128
下载: 导出CSV
表 3 蝴蝶物种丰富度单变量与多变量回归模型
Table 3 Univariate and multivariate regression models for butterfly richness
单变量模型 Univariate model 多变量模型 Multivariate model 回归系数 Coefficient P R² 回归系数 Coefficient P R² 蜜源植物丰富度(RichN) 0.185 0.339 −0.002 0.446 0.031 温度(temperature) 1.707 0.139 0.065 3.097 0.016 0.031 0.243
下载: 导出CSV
表 4 蝴蝶个体数影响因子的模型选择结果
Table 4 Model selection for factors influencing butterfly individuals
模型Mode AICc ΔAICc 权重Weight 空模型(null, intercept only) 283.9 0.00 0.612 湿度(humidity) 285.9 1.97 0.228 温度(temperature) 286.6 2.69 0.160
下载: 导出CSV
表 5 蝴蝶个体数与影响因子的简单线性回归分析结果
Table 5 Simple linear regression between butterfly individuals and influencing factors
回归系数 Coefficient P R2 海拔(elevation) 0.034 0.869 −0.051 温度(temperature) 8.291 0.821 −0.050 湿度(humidity) 1108.0 0.409 −0.015 蜜源植物丰富度
(RichN)0.785 0.897 −0.052
下载: 导出CSV
-
[1] 易浪, 董亚坤, 苗白鸽, 等. 云南高黎贡山地区蝴蝶群落多样性[J]. 生物多样性, 2021, 29(7): 950−959. https://doi.org/10.17520/biods.2020486 doi: 10.17520/biods.2020486 [2] 刘鹏, 春批边姆, 张庆, 等. 哈巴雪山不同海拔梯度哺乳动物群落谱系及功能多样性[J]. 生态学报, 2025, 45(7): 3461−3473. https://doi.org/10.20103/j.stxb.202401020012 doi: 10.20103/j.stxb.202401020012 [3] Villaseñor-Amador D, Benites P, Sandoval-Becerra F M, et al. Unravelling high insect diversity and community turnover along a tropical-temperate elevation gradient: a metabarcoding approach [J]. PLoS One, 2025, 20(7): e0327884. https://doi.org/10.1371/journal.pone.0327884 doi: 10.1371/journal.pone.0327884 [4] 孙昊田, 陈文武, 郝永荣, 等. 秦岭潏河不同海拔和环境因子对生物多样性及群落结构的影响[J]. 生态学杂志, 2023, 42(11): 2702−2711. https://doi.org/10.13292/j.1000-4890.202311.019 doi: 10.13292/j.1000-4890.202311.019 [5] 臧建成, 宋美成, 黄智, 等. 西藏色季拉山(阳坡)不同海拔土壤动物群落多样性时空分布特征[J]. 中国农业大学学报, 2023, 28(5): 189−199. https://doi.org/10.11841/j.issn.1007-4333.2023.05.17 doi: 10.11841/j.issn.1007-4333.2023.05.17 [6] Nowicki P, Settele J, Henry P Y, et al. Butterfly monitoring methods: the ideal and the real world [J]. Israel Journal of Ecology & Evolution, 2008, 54(1): 69−88. https://doi.org/10.1560/IJEE.54.1.69 doi: 10.1560/IJEE.54.1.69 [7] Kumar S, Simonson S E, Stohlgren T J. Effects of spatial heterogeneity on butterfly species richness in Rocky Mountain National Park, CO, USA [J]. Biodiversity and Conservation, 2009, 18(3): 739−763. https://doi.org/10.1007/s10531-008-9536-8 doi: 10.1007/s10531-008-9536-8 [8] Forister M L, McCall A C, Sanders N J, et al. Compounded effects of climate change and habitat alteration shift patterns of butterfly diversity [J]. Proceedings of the National Academy of Sciences of the United States of America, 2010, 107(5): 2088−2092. https://doi.org/10.1073/pnas.0909686107 doi: 10.1073/pnas.0909686107 [9] Pinkert S, Farwig N, Kawahara A Y, et al. Global hotspots of butterfly diversity are threatened in a warming world [J]. Nature Ecology & Evolution, 2025, 9(5): 789−800. https://doi.org/10.1038/S41559-025-02664-0 doi: 10.1038/S41559-025-02664-0 [10] Acharya B K, Vijayan L. Butterfly diversity along the elevation gradient of Eastern Himalaya, India [J]. Ecological Research, 2015, 30(5): 909−919. https://doi.org/10.1007/s11284-015-1292-0 doi: 10.1007/s11284-015-1292-0 [11] Cómbita J L, Giraldo C E, Escobar F. Environmental variation associated with topography explains butterfly diversity along a tropical elevation gradient [J]. Biotropica, 2022, 54(1): 146−156. https://doi.org/10.1111/btp.13040 doi: 10.1111/btp.13040 [12] 张超, 李娟, 程海云, 等. 秦岭西段地区蝴蝶群落多样性与环境因子相关性[J]. 生物多样性, 2023, 31(1): 215−240. https://doi.org/10.17520/biods.2022272 doi: 10.17520/biods.2022272 [13] 李保铨, 李柳红, 周露露, 等. 广东梅县阴那山省级自然保护区蝶类多样性及其区系分析[J]. 林业调查规划, 2024, 49(1): 51−57. https://doi.org/10.3969/j.issn.1671-3168.2024.01.010 doi: 10.3969/j.issn.1671-3168.2024.01.010 [14] Beirão M V, Neves F S, Fernandes G W. Climate and plant structure determine the spatiotemporal butterfly distribution on a tropical mountain [J]. Biotropica, 2021, 53(1): 191−200. https://doi.org/10.1111/btp.12860 doi: 10.1111/btp.12860 [15] 李歌, 凌少军, 陈伟芳, 等. 昌化江河谷隔离对海南岛特有植物盾叶苣苔遗传多样性的影响[J]. 广西植物, 2020, 40(10): 1505−1513. https://doi.org/10.11931/guihaia.gxzw201808024 doi: 10.11931/guihaia.gxzw201808024 [16] Wang G Q, Scherson R A, Vera D, et al. Spatial patterns and drivers of native plant diversity in Hainan, China [J]. Journal of Systematics and Evolution, 2024, 62(4): 603−620. https://doi.org/10.1111/jse.13017 doi: 10.1111/jse.13017 [17] 陈天鹏. 海南岛蝴蝶生物多样性研究[D]. 广州: 华南农业大学, 2021. https://doi.org/10.27152/d.cnki.ghanu.2021.001366 [18] 谭舜云. 海南省鹦哥岭自然保护区蝶类资源调查与多样性研究[D]. 广州: 华南农业大学, 2021. https://doi.org/10.27152/d.cnki.ghanu.2021.000964 [19] 国家林业和草原局(国家公园管理局), 海南省人民政府. 海南热带雨林国家公园规划(2019-2025年)[Z]. 北京: 国务院, 2020. (查阅网上资料, 未找到出版信息及页码信息, 请确认出版信息并且补充页码信息) [20] iNaturalist. iNaturalist [DB/OL]. [2026-02-17]. https://www.inaturalist.org/observations. [21] 朱建青, 谷宇, 陈志兵, 等. 中国蝴蝶生活史图鉴[M]. 重庆: 重庆大学出版社, 2018. (查阅网上资料, 未找到页码信息, 请补充) [22] 陈焕镛. 海南植物志[M]. 北京: 科学出版社, 1964. (查阅网上资料, 未找到页码信息, 请补充) [23] 中国科学院中国植物志编辑委员会. 中国植物志[M]. 北京: 科学出版社, 2004. (查阅网上资料, 未找到页码信息, 请补充) [24] R Core Team. R: a language and environment for statistical computing [CP/OL]. (2025-06-13) [2025-11-09]. http://www.R-project.org/.(查阅网上资料,未找到更新信息,请确认) [25] Chao A N, Gotelli N J, Hsieh T C, et al. Rarefaction and extrapolation with Hill numbers: a framework for sampling and estimation in species diversity studies [J]. Ecological Monographs, 2014, 84(1): 45−67. https://doi.org/10.1890/13-0133.1 doi: 10.1890/13-0133.1 [26] Poos M S, Jackson D A. Addressing the removal of rare species in multivariate bioassessments: the impact of methodological choices [J]. Ecological Indicators, 2012, 18: 82−90. https://doi.org/10.1016/j.ecolind.2011.10.008 doi: 10.1016/j.ecolind.2011.10.008 [27] Bartoń K. MuMIn: multi-model inference [CP/OL]. (2025-04-01) [2025-11-09]. https://doi.org/10.32614/cran.package.mumin.(查阅网上资料,未找到更新信息,请确认) [28] Wood S N. Generalized additive models: an introduction with R [M]. 2nd ed. New York: Chapman and Hall/CRC, 2017.(查阅网上资料,未找到页码信息,请补充) https://doi.org/10.1201/9781315370279 [29] Baselga A. Partitioning the turnover and nestedness components of beta diversity [J]. Global Ecology and Biogeography, 2010, 19(1): 134−143. https://doi.org/10.1111/j.1466-8238.2009.00490.x doi: 10.1111/j.1466-8238.2009.00490.x [30] Dixon P. Vegan, a package of R functions for community ecology [J]. Journal of Vegetation Science, 2003, 14(6): 927−930. https://doi.org/10.1111/j.1654-1103.2003.tb02228.x doi: 10.1111/j.1654-1103.2003.tb02228.x [31] Pires A C V, Barbosa M, Beiroz W, et al. Altitudinal variation in butterfly community associated with climate and vegetation [J]. Anais da Academia Brasileira de Ciencias, 2020, 92(S2): e20190058. https://doi.org/10.1590/0001-3765202020190058 doi: 10.1590/0001-3765202020190058 [32] Gallou A, Baillet Y, Ficetola G F, et al. Elevational gradient and human effects on butterfly species richness in the French Alps [J]. Ecology and Evolution, 2017, 7(11): 3672−3681. https://doi.org/10.1002/ece3.2803 doi: 10.1002/ece3.2803 [33] Molleman F, Moore M E, Halali S, et al. Larval growth rate is not a major determinant of adult wing shape and eyespot size in the seasonally polyphenic butterfly Melanitis leda [J]. PeerJ, 2024, 12: e18295. https://doi.org/10.7717/peerj.18295 doi: 10.7717/peerj.18295 [34] Hoiss B, Krauss J, Potts S G, et al. Altitude acts as an environmental filter on phylogenetic composition, traits and diversity in bee communities [J]. Proceedings of the Royal Society B: Biological Sciences, 2012, 279(1746): 4447−4456. https://doi.org/10.1098/rspb.2012.1581 doi: 10.1098/rspb.2012.1581 [35] Dennis R L H, Shreeve T G, van Dyck H. Habitats and resources: the need for a resource-based definition to conserve butterflies [J]. Biodiversity & Conservation, 2006, 15(6): 1943−1966. https://doi.org/10.1007/s10531-005-4314-3 doi: 10.1007/s10531-005-4314-3 [36] Sánchez-Dávila J, Traveset A, Colom P. Effects of food availability on butterfly diversity and network specialization across altitudinal levels in a Mediterranean landscape [J]. Biodiversity and Conservation, 2024, 33(1): 239−256. https://doi.org/10.1007/s10531-023-02745-1 doi: 10.1007/s10531-023-02745-1 [37] Kingsolver J G. Thermal ecology of Pieris butterflies (Lepidoptera: Pieridae): a new mechanism of behavioral thermoregulation [J]. Oecologia, 1985, 66(4): 540−545. https://doi.org/10.1007/bf00379347 doi: 10.1007/bf00379347 [38] Checa M F, Barragán A, Rodríguez J, et al. Temporal abundance patterns of butterfly communities (Lepidoptera: Nymphalidae) in the Ecuadorian Amazonia and their relationship with climate [J]. Annales de la Société Entomologique de France(N. S. ), 2009, 45(47): 470−486. https://doi.org/10.1080/00379271.2009.10697630 doi: 10.1080/00379271.2009.10697630 [39] Dewan S, Sanders N J, Acharya B K. Turnover in butterfly communities and traits along an elevational gradient in the eastern Himalaya, India [J]. Ecosphere, 2022, 13(3): e3984. https://doi.org/10.1002/ecs2.3984 doi: 10.1002/ecs2.3984 [40] Zellweger F, Roth T, Bugmann H, et al. Beta diversity of plants, birds and butterflies is closely associated with climate and habitat structure [J]. Global Ecology and Biogeography, 2017, 26(8): 898−906. https://doi.org/10.1111/geb.12598 doi: 10.1111/geb.12598 -

 点击查看大图
计量
- 文章访问数: 52
- HTML全文浏览量: 37
- 被引次数: 0
