


-
天然橡胶是重要的战略物资,橡胶树(Hevea brasiliensis)作为中国热带地区核心经济林树种,是天然橡胶产业稳定发展的根基 [1]。长期单一化经营造成胶园林下植被结构单一、生物多样性衰减,同时引发土壤退化问题。相关调查显示,海南大面积胶园土壤综合肥力处于中等偏下水平 [2];伴随种植年限增加,胶园土壤有机碳与氮储量持续下降 [3],土壤地力衰退已成为橡胶园可持续经营的关键制约因素。
林下间作绿肥能够增加有机质输入、促进养分归还、改良土壤结构、提升土壤质量 [4-6],是改善胶园土壤地力的有效途径。豆科绿肥固氮能力突出,干物质积累快、养分周转效率高,可依靠生物固氮以及根系、残体归还,提升土壤有机质与氮素供给 [7-9]。田菁(Sesbania cannabina)耐贫瘠、耐盐碱,生长速率快、抗逆性强 [10],翻压还田后可补充土壤有机质与矿质养分 [11-12],在橡胶园林下绿肥应用中具备良好潜力。对于以翻压还田为利用方式的田菁,生长期生物量及其氮、磷、钾养分积累量,是评判其养分归还潜力的核心指标。已有研究证实,不同绿肥品种在生物量生产、养分积累与腐解释放特征上存在显著差异 [13-14];即使同一绿肥作物,不同品系因遗传背景分化,生长与养分积累能力也不尽相同。因此,除品系固有遗传特性外,胶园林下微环境对田菁相关性状的影响仍有待深入研究。
橡胶树冠层遮阴会改变林下作物的光资源供给,形成显著的空间异质性。已有研究表明,遮阴可改变一年生豆科饲草的光截获能力、农艺性状与营养品质,进而调控植株生长和光合生理过程 [15-16]。在胶园林弱光环境下,田菁光截获与光合碳同化受限,会抑制生物量积累;而植株养分积累由生物量与组织养分浓度共同决定,生物量降低会进一步影响单株氮、磷、钾养分总积累量,且不同田菁品系抵御弱光胁迫、维持物质积累的能力存在差异。目前,橡胶园绿肥相关研究多聚焦于绿肥翻压后的土壤改良效应与养分释放规律 [17-18]。虽有研究证实,胶园冠层光环境与林下作物产量紧密相关 [19],但针对田菁生长期生物量、养分积累对胶园林下光照条件的响应研究仍较为匮乏,缺少不同田菁品系在真实林下光环境下的综合比较评价。
因此,本研究选取幼龄、成龄橡胶园林下间作田菁为试验材料,对比4个田菁品系的形态特征、干物质积累及氮磷钾养分积累规律;分析成龄胶园林下相对照度与田菁生长、养分积累的关联关系;并采用熵权 TOPSIS 法对各品系进行综合评价,旨在为橡胶园林下田菁适宜品系筛选与空间配置提供理论依据。
-
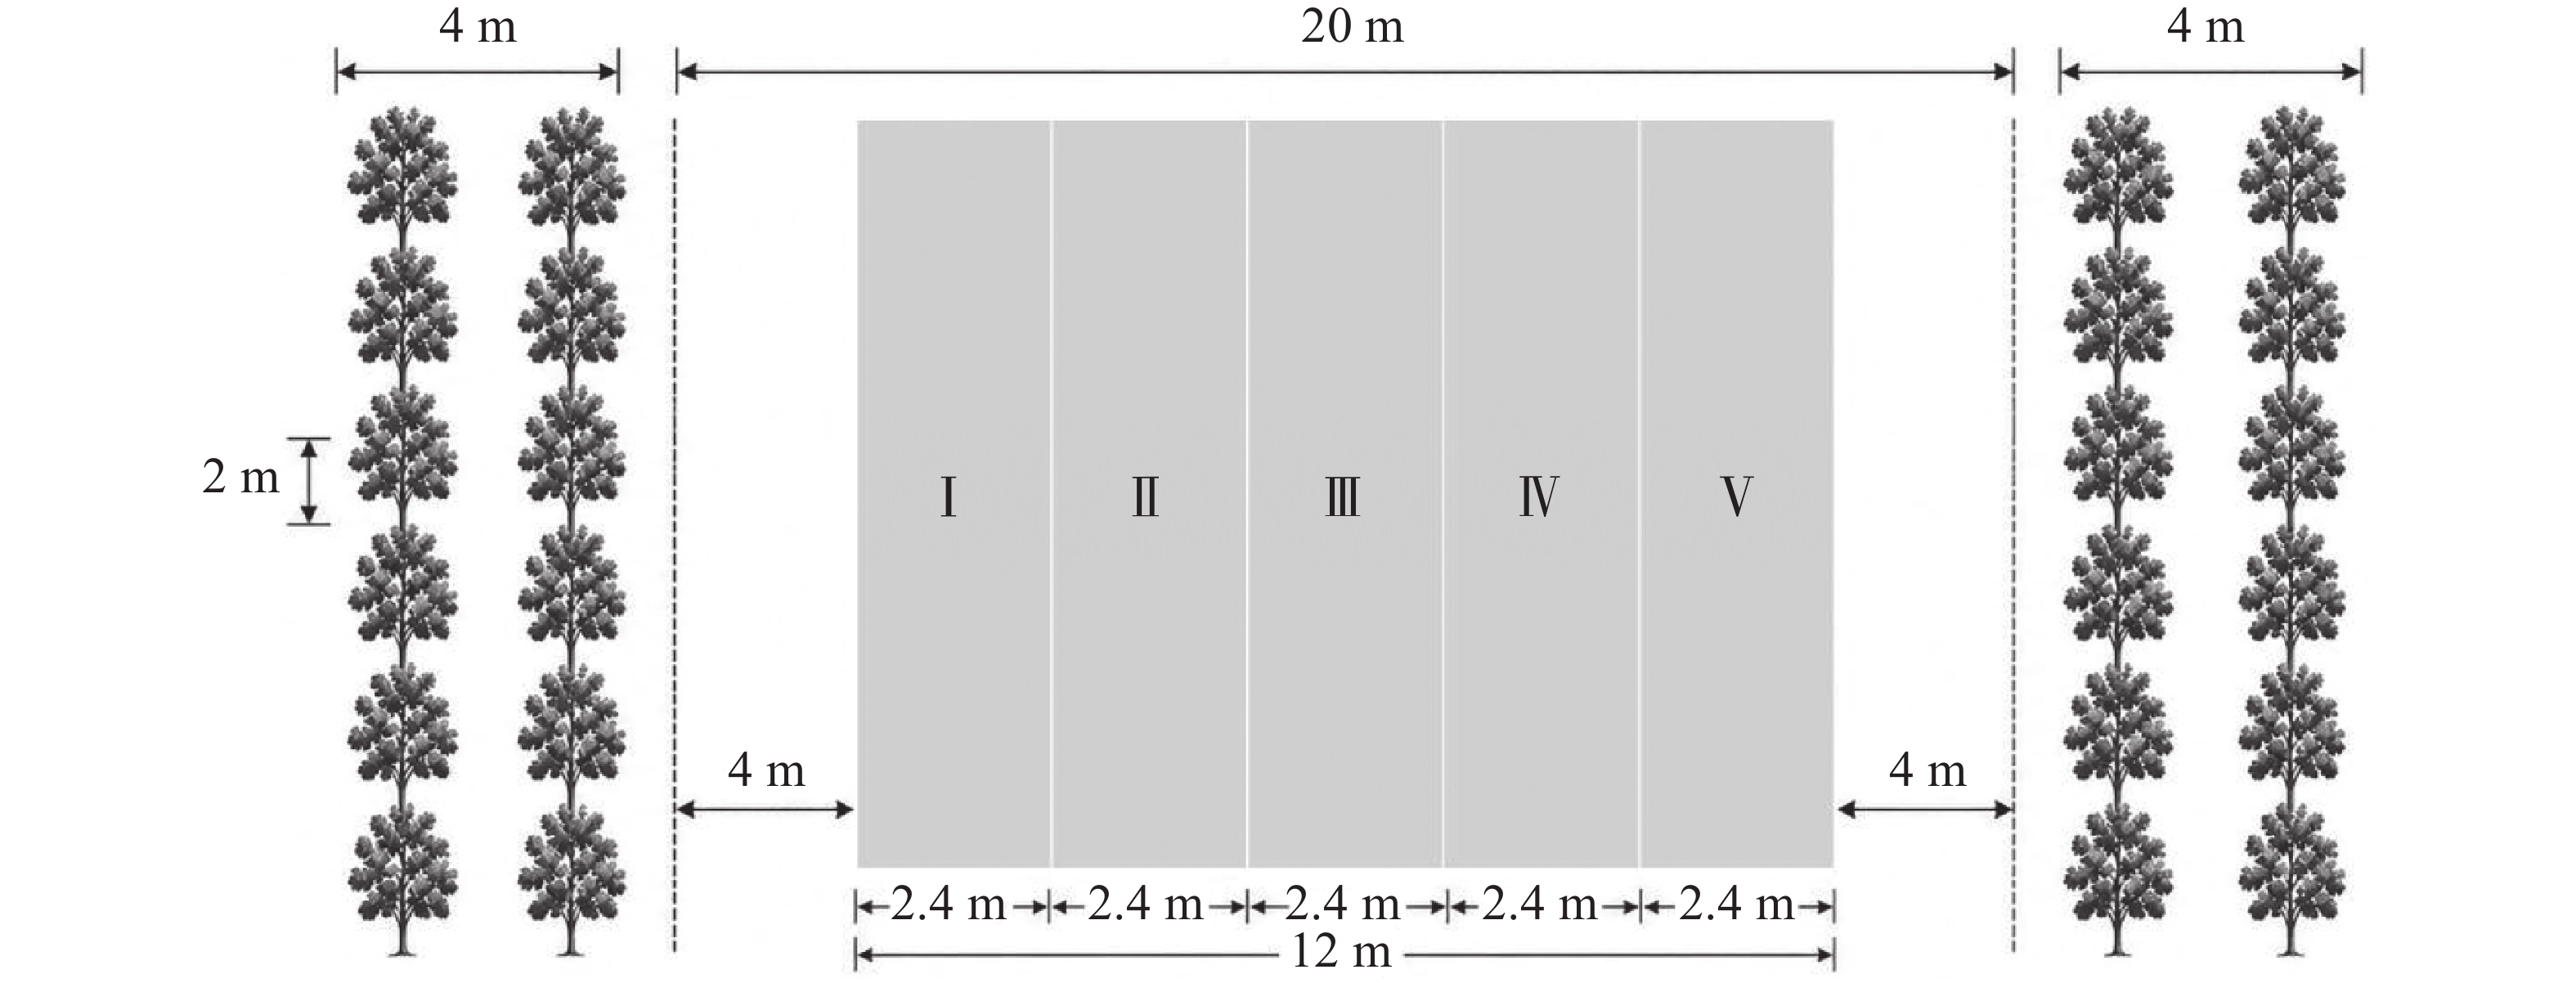
试验于2025年8月至12月在海南儋州中国热带农业科学院3队基地进行。试验区属热带季风气候,年平均气温23.4℃,年降雨量为1 607 mm。供试幼龄和成龄胶园土壤类型均为砖红壤,地形均为平地。供试橡胶树品种均为‘热研917’,采用宽窄行种植模式,宽行20 m,窄行4 m,株距2 m。幼龄胶园橡胶树于2024年8月,树行呈南北走向,平均树高约3.5 m,冠层尚未郁闭,林下光照较充足;成龄胶园于2016年9月定植,树行呈东西走向,平均树高约12 m,已形成明显的冠层遮蔽,林下光照相对较弱[19]。
-
供试作物为绿肥田菁(Sesbania cannabina),选用‘6055’、‘6070’、‘6113’和‘8001’共4个品系。根据前期材料的田间观察,综合种子萌发表现、早期生长势、株型及生物量形成潜力选取上述品系:‘6055’和‘6113’出苗表现及早期生长势较好,‘8001’株型相对矮且紧凑、具有较好的生物量形成潜力,‘6070’株型直立。田菁种子由中国科学院遗传与发育生物学研究所提供,2025年8月20日统一播种。
-
幼龄胶园和成龄胶园分别设置试验,每个胶园为1个独立供试地块。从图1可知,在每一胶园内设置3个重复,每个区组包含‘6055’、‘6070’、‘6113’和‘8001’共4个品系小区,各品系在区组内随机排列,构成以品系为处理的随机完全区组设计。每个品系在每个胶园内有3个小区重复,每个胶园共12个小区,两个胶园共24个小区。小区面积为60 m2(12 m × 5 m),株行距为0.4 m × 0.4 m。
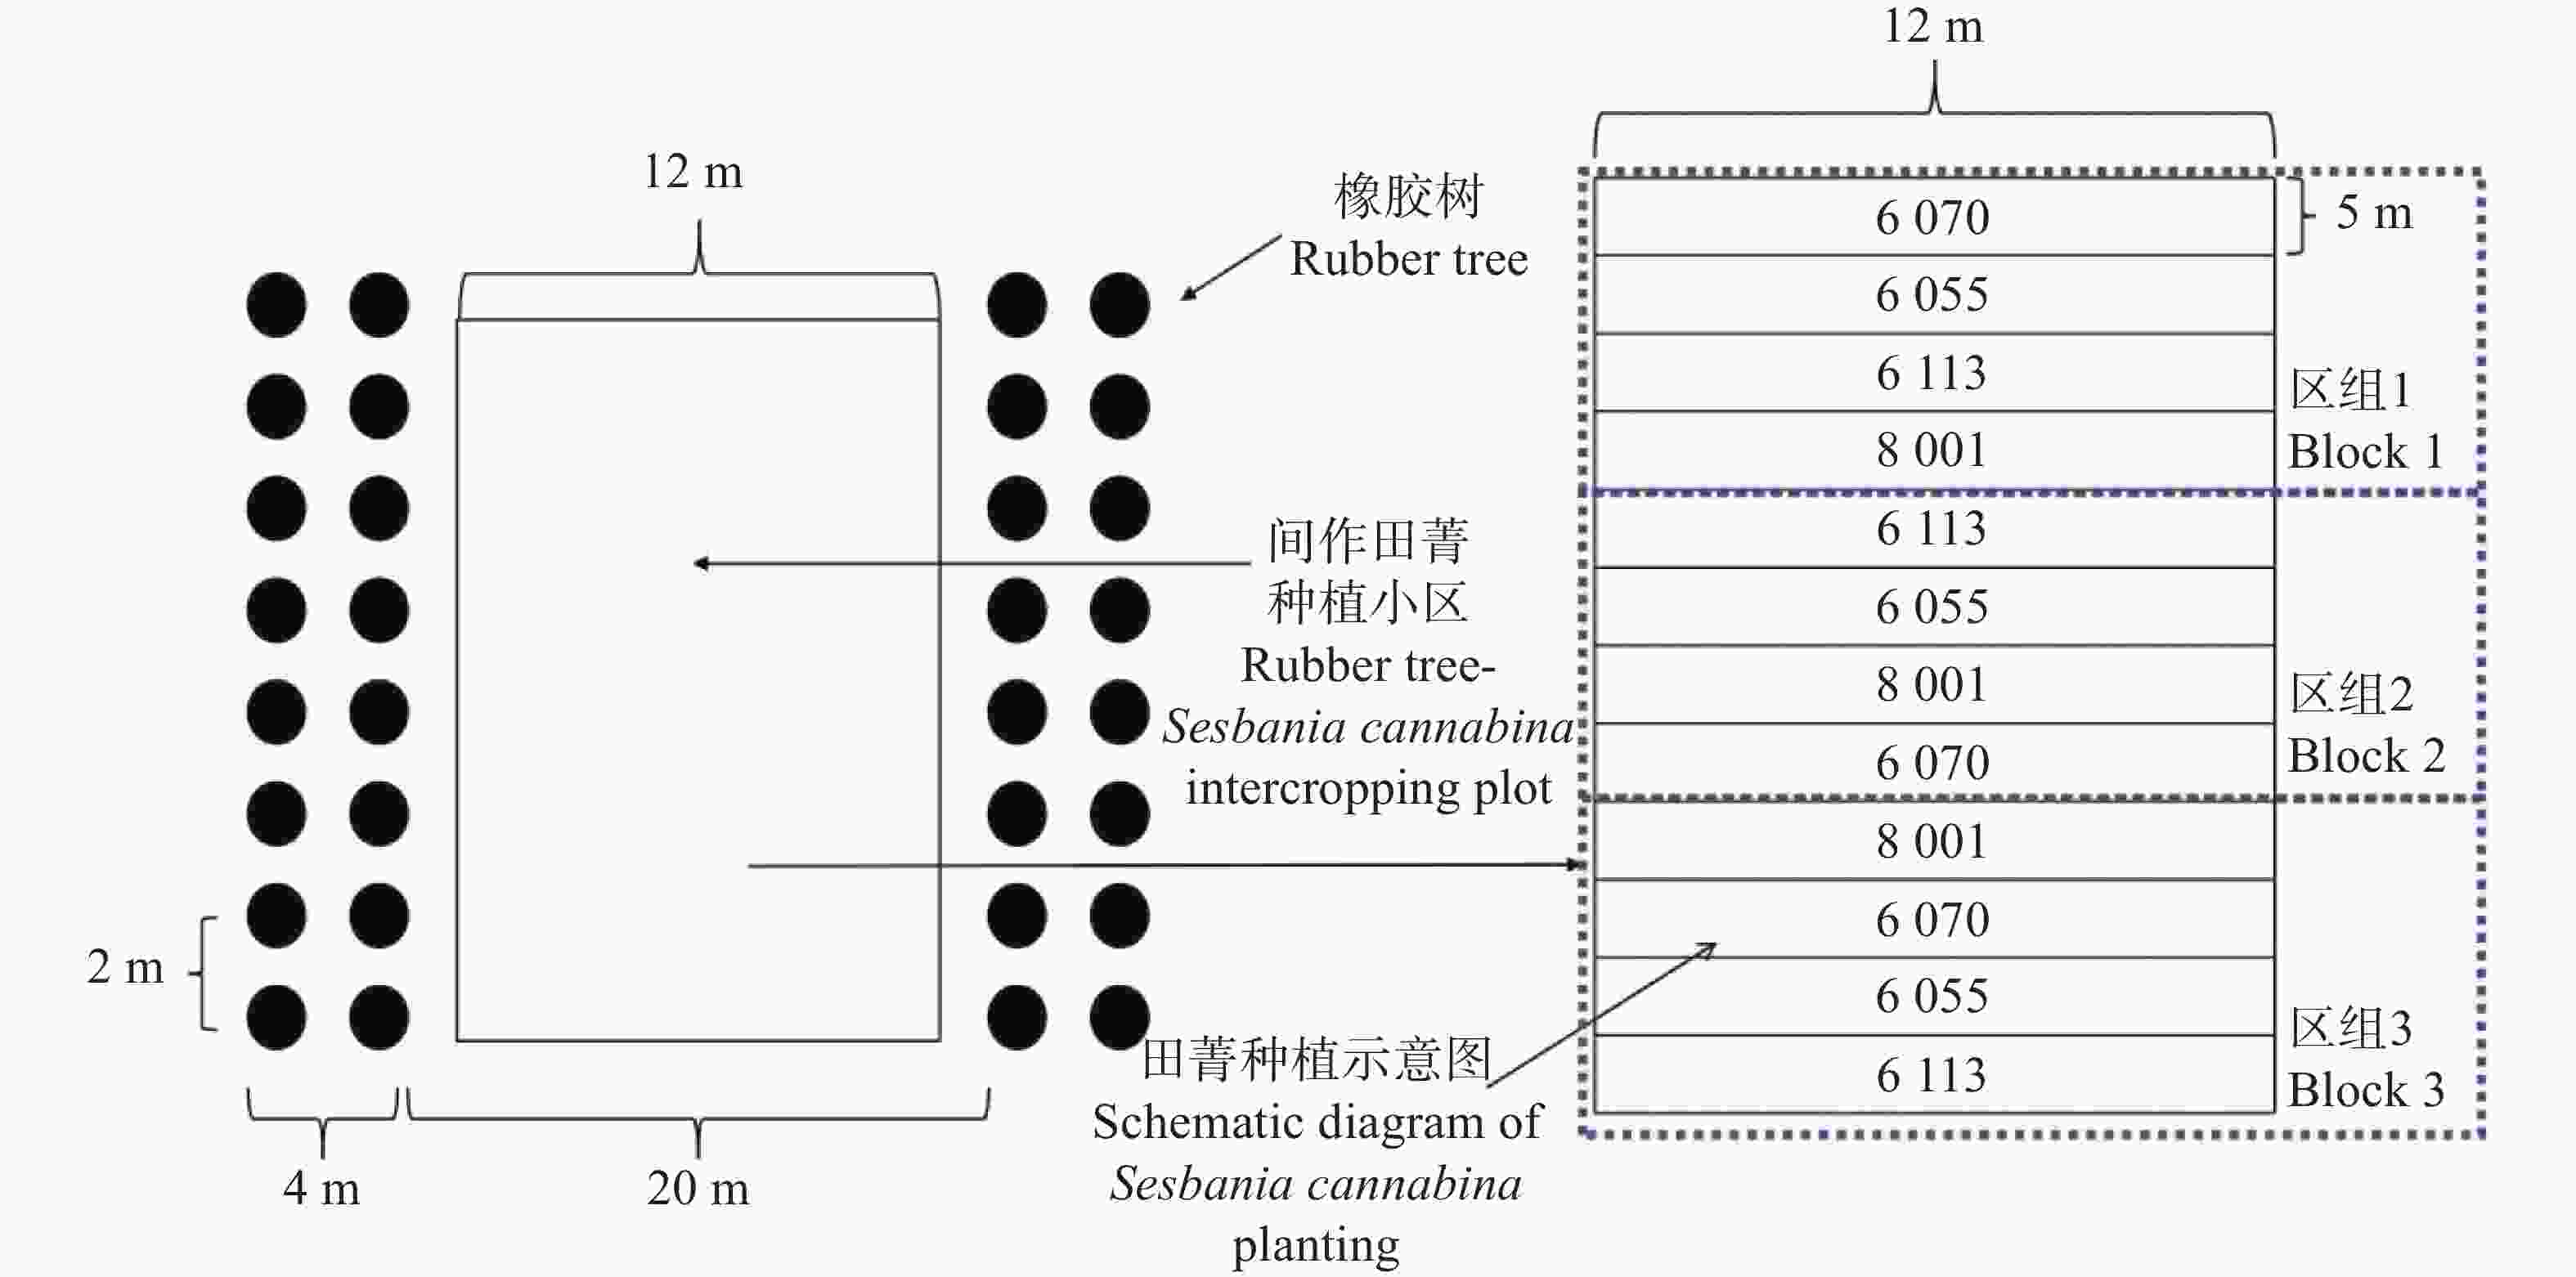
图 1 田菁各品系的小区分布
Figure 1. Plot distribution of different S. cannabina lines
从图2可知,在每个小区内沿垂直于橡胶树行方向划分5个固定空间条带,编号为Ⅰ~Ⅴ,用于观察不同相对树行位置的林下环境及田菁生长差异。条带并非随机施加的光照处理。其中,Ⅰ和Ⅴ靠近两侧橡胶树行,Ⅲ位于宽行中部,Ⅱ和Ⅳ位于二者之间。每个条带随机选取6株田菁作为植株亚样本,6株测定取平均值后形成1个条带观测值。因此,每个胶园包含12个独立品系小区、60个条带观测值。本研究幼龄和成龄处理均仅选取1个胶园地块,小区重复不构成林龄层级的独立地块重复,因此林龄比较仅用于描述两个供试地块的观测差异。
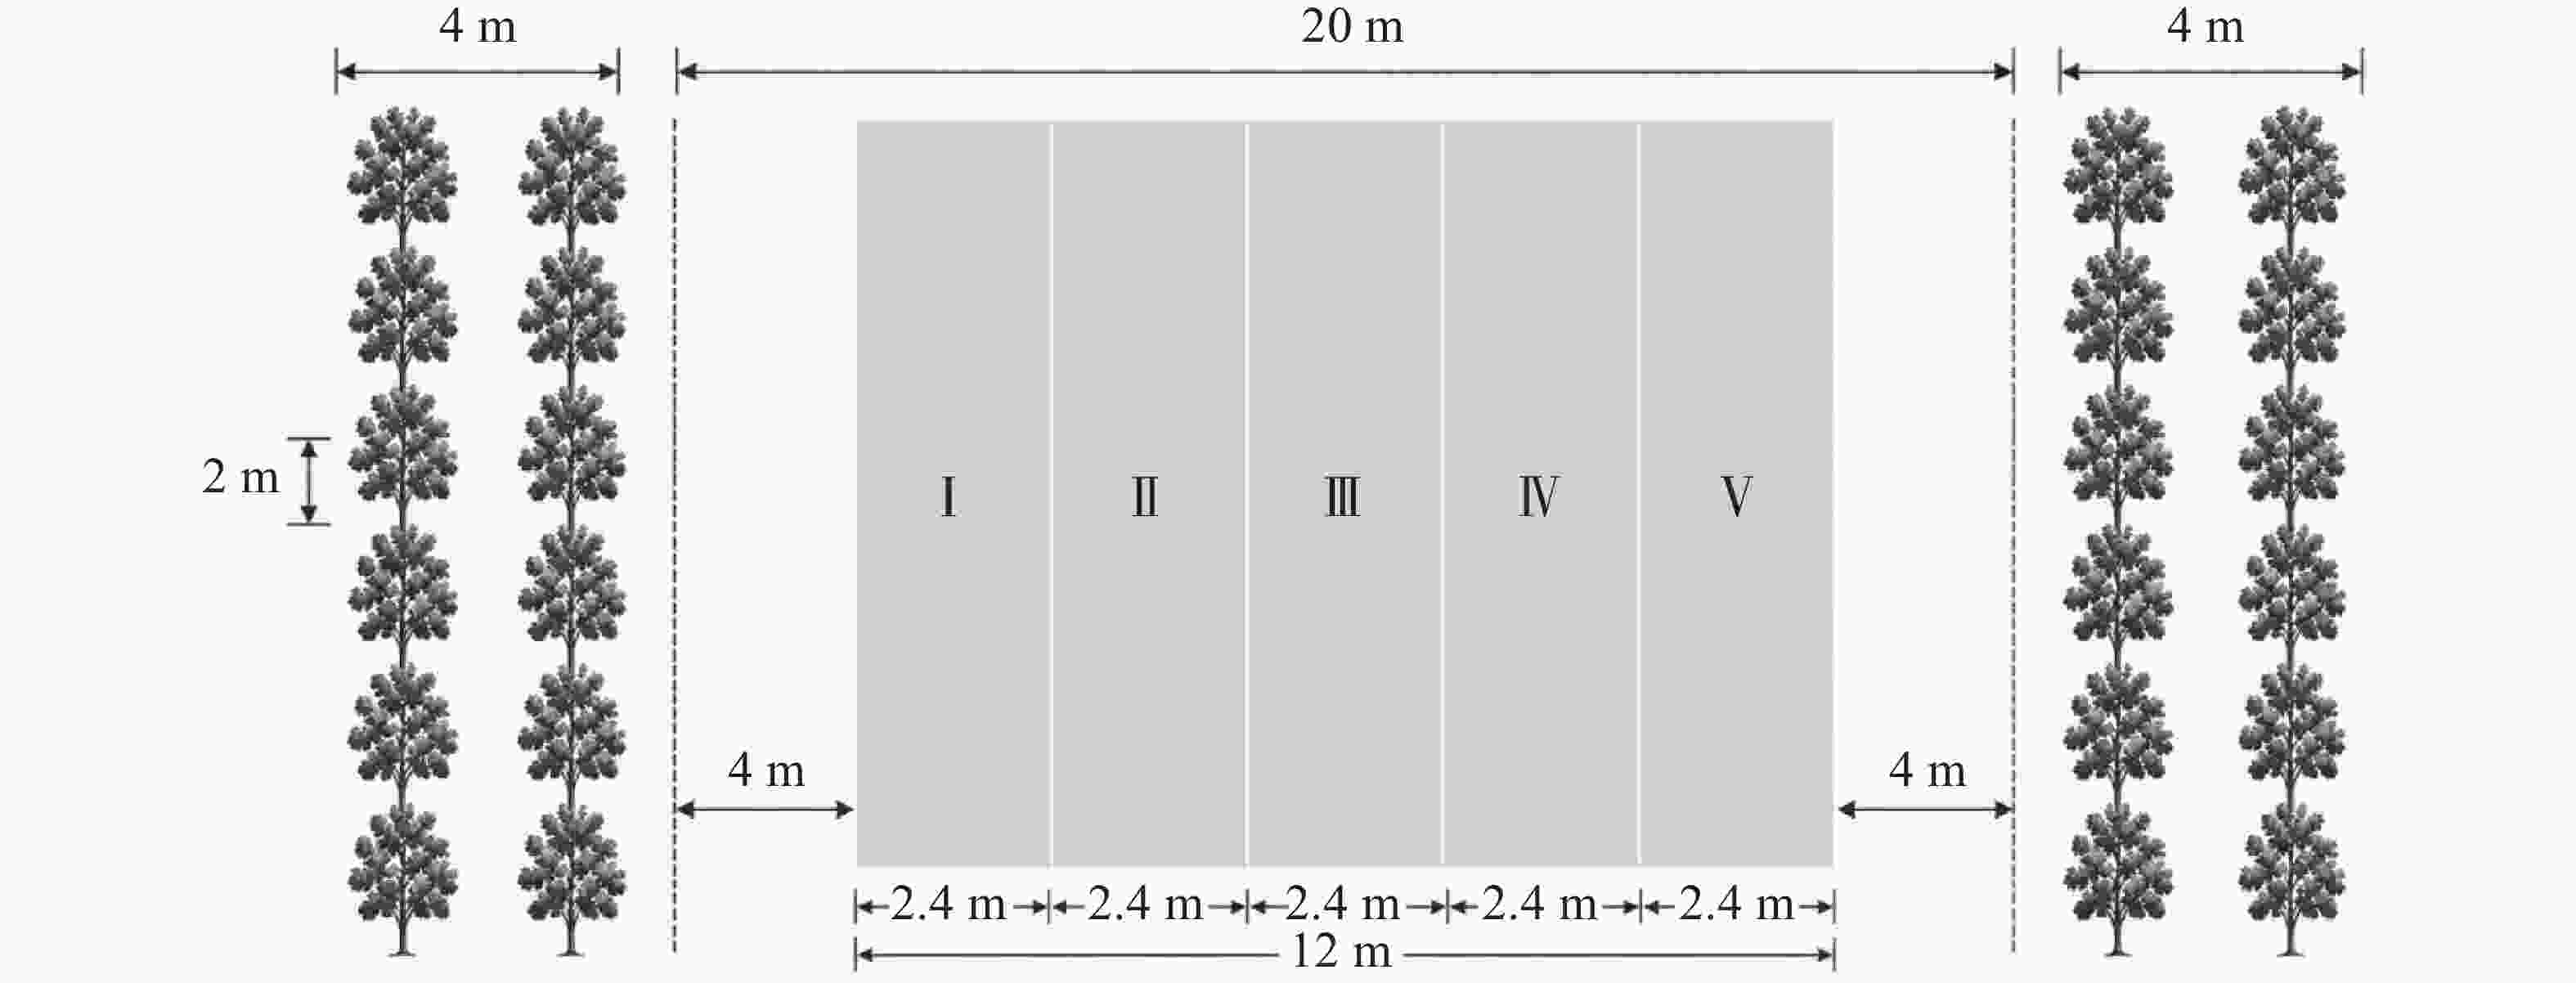
图 2 固定空间条带分布示意图
Figure 2. Schematic distribution of fixed spatial strips
试验区每公顷使用有机肥15 000 kg、复合肥450 kg、磷酸二铵120 kg、硫酸钾150 kg作基肥,两个胶园的播种、补苗、间苗及除草均在相同时间按相同标准实施。
-
播种前,在每个小区的每个固定条带采集3个重复的0~20 cm表层土壤样品。风干后测定pH值、有机质、全氮、速效钾和速效磷。pH采用水土比为5︰1;有机质用重铬酸钾外加热法;全氮用靛酚蓝比色法;速效钾用乙酸铵浸提−火焰光度法测定;速效磷用NH4F-HCl法[20]。
-
田菁播种后65 d(2025-10-24)统一取样,在每个小区内每条带随机选取6株田菁,逐株测定株高、茎粗和根长(主根根长)。随后将每株植株分为地上和地下部,分别测定鲜重,105℃下杀青30 min,75℃烘干至恒重后测定干质量[20]。单株总干质量为地上部总干质量与地下部总干质量之和。根据干质量计算根冠比(根冠比 = 地下部干质量 / 地上部干质量)。
干质量测定后,将同一条带内6株的地上部、地下部样品粉碎并各自充分混合,各制成1份混合样。混合样品经H2SO4−H2O2 法消化后,分别采用纳氏试剂比色法、钒钼黄比色法和火焰光度计法测定全氮、全磷和全钾养分浓度[20]。每份混合样重复测定3次,取平均值作为该相应器官的养分浓度。
植株养分积累量按下式计算:
$$ \begin{split} &地上部养分积累量=地上部干质量\times\\& 地上部植物养分浓度, \end{split} $$ $$ \begin{split} &地下部养分积累量=地下部干质量\times\\& 地下部植物养分浓度, \end{split} $$ $$ \begin{split} &全株养分积累量=地上部养分积累量+\\&地下部养分积累量, \end{split} $$ 式中,养分积累量的单位为mg·株−1,干质量的单位为g·株−1,养分浓度的单位为mg·g−1。
-
每个胶园共设置5个独立测光点,分别对应Ⅰ~Ⅴ条带的中心位置。各测光点在2025年8至10月期间,每月选择3个晴天,于8:00、10:00、12:00、14:00和16:00,采用光照传感器(RS-MH-4G-C5-5,山东仁科测控技术有限公司)测定林下光照强度(lx)。测定时传感器距地面1.5 m,保持传感器感光面水平。
对每个观测点,先将每日5个时刻的观测值取平均,作为当日平均照度;每月3个观测日得到3个日平均照度,取其平均值作为该点月平均照度;再将3个月平均照度(8—10月)的总均值作为该条带的平均照度,用于后续的照度与性状关系分析。其中以供试幼龄胶园平均照度为参考,计算供试成龄胶园各条带平均照度与该参考值的比值,以百分数表示,计算成龄橡胶园各光条带相对于幼龄胶园的相对光照强度(Relative Light Intensity,RLI)。
$$ \mathit{RLI} \mathrm= \mathit{L} _{ \mathrm{10,} \mathit{i} } \mathrm{/} \mathit{L} _{ \mathrm{1}} \mathrm{\times 100\% ,} $$ 式中,L10, i为成龄橡胶园第i光条带平均光照值,L1为幼龄橡胶林下平均光照值。
-
采用R(4.5.2)软件进行数据处理、统计分析及绘图。条带观测值为每个小区内6株田菁测定值的平均值。由于幼龄和成龄胶园各仅设置1个地块,林龄与地块完全混杂,因此林龄间仅作描述性比较,不作统计显著性检验;供试幼龄和成龄胶园的整体均值(不分品系与条带)的计算方法是:先对各小区内5个条带取平均得到小区均值,再以12个小区均值计算平均值和标准误,不采用模型边际均值。所有品系、条带及照度效应分析均分别在各林龄内完成。
品系与条带效应的分析是对每个林龄分别建立线性混合模型(固定效应为区组、品系和条带,随机效应为小区),以校正同一小区内5个条带间的相关性,并估计品系和条带的边际均值及标准误;每个胶园内,每个品系有3个独立小区重复,每个小区包含5个条带观测值;每个条带位置对应12个小区观测值。条带内6株植株为亚样本,不作为独立小区重复。采用Tukey法对品系和条带进行多重比较,显著性水平设为P<0.05。每个胶园的照度信息来自5个固定测光点,各测光点的平均照度对应相应条带位置的植物观测值。因此,照度分析包含5个不同的条带照度水平,不将植物条带观测数视为独立测光重复。该分析用于描述照度与植物性状的空间关联,不能分离照度与条带位置及其他共变环境因素的作用。
照度与生长及养分积累的关系以条带照度为连续固定效应、品系为固定效应、小区为随机效应,建立线性混合模型。采用广义加性混合模型(GAMM)拟合照度的平滑函数s(照度),采用GAMM探索照度与各指标之间的曲线形态,以edf描述拟合复杂度,以平滑项显著性评价整体关联;另在同时包含照度一次项和二次项的混合模型中检验二次项;同时在混合模型中纳入照度二次项I(照度2)通过Ⅲ型方差分析检验二次项系数。
为筛选各林龄综合表现优良的品系,以品系边际均值为基础,采用熵权TOPSIS法进行综合评价。以株高、根长、茎粗、总干质量及全氮、全磷和全钾积累量7个指标边际均值作为输入矩阵X,经极差标准化后得到Z,并将所有元素加10−10以避免零值。利用熵权法确定权重$ {w}_{j} $,构建加权标准化矩阵$ \text{V=}\left[{\text{v}}_{\text{ij}}\right] $,其中$ {v}_{ij}={w}_{j}{z}_{ij} $。以各指标最大值为正理想解$ {V}^{+} $、最小值为负理想解$ {V}^{-} $。计算各品系到正、负理想解的加权欧氏距离:$ \text{D}_{\text{i}}^{+}=\sqrt{{{\sum\limits_{\text{j=1}}^{7}}\left({\text{v}}_{\text{ij}}\text{-V}_{\text{j}}^{+}\right)}^{2}}\text{,D}_{\text{i}}^{-}=\sqrt{{{\sum\limits_{\text{j=1}}^{7}}\left({\text{v}}_{\text{ij}}\text{-V}_{\text{j}}^{-}\right)}^{2}} $,及相对贴近度$ {\text{C}}_{\text{i}}\text{=D}_{\text{i}}^{-}/\left(\text{D}_{\text{i}}^{+}\text{+D}_{\text{i}}^{-}\right) $,并进行排序,贴近度越大综合表现越优。2个林龄分别独立评价。
-
从表1可知,播种前测定幼龄和成龄胶园土壤理化性质。幼龄胶园土壤有机质、全氮和速效钾含量分别为17.37 、0.69 g·kg−1和140.04 mg·kg−1,数值上均高于成龄胶园,而成龄胶园土壤pH略低,速效磷含量相近。
表 1 幼龄和成龄胶园土壤理化性质比较
Table 1. Comparison of soil physicochemical properties between young and mature rubber plantations
理化性质
Soil property幼龄胶园
Young rubber plantation成龄胶园
Mature rubber plantationpH 5.37±0.06 5.08±0.03 速效钾/(mg·kg−1)
Available potassium140.04±5.48 74.20±2.32 速效磷/(mg·kg−1)
Available phosphorus20.80±2.56 21.76±0.93 全氮/(g·kg−1)
Total nitrogen0.69±0.04 0.48±0.02 有机质/(g·kg−1)
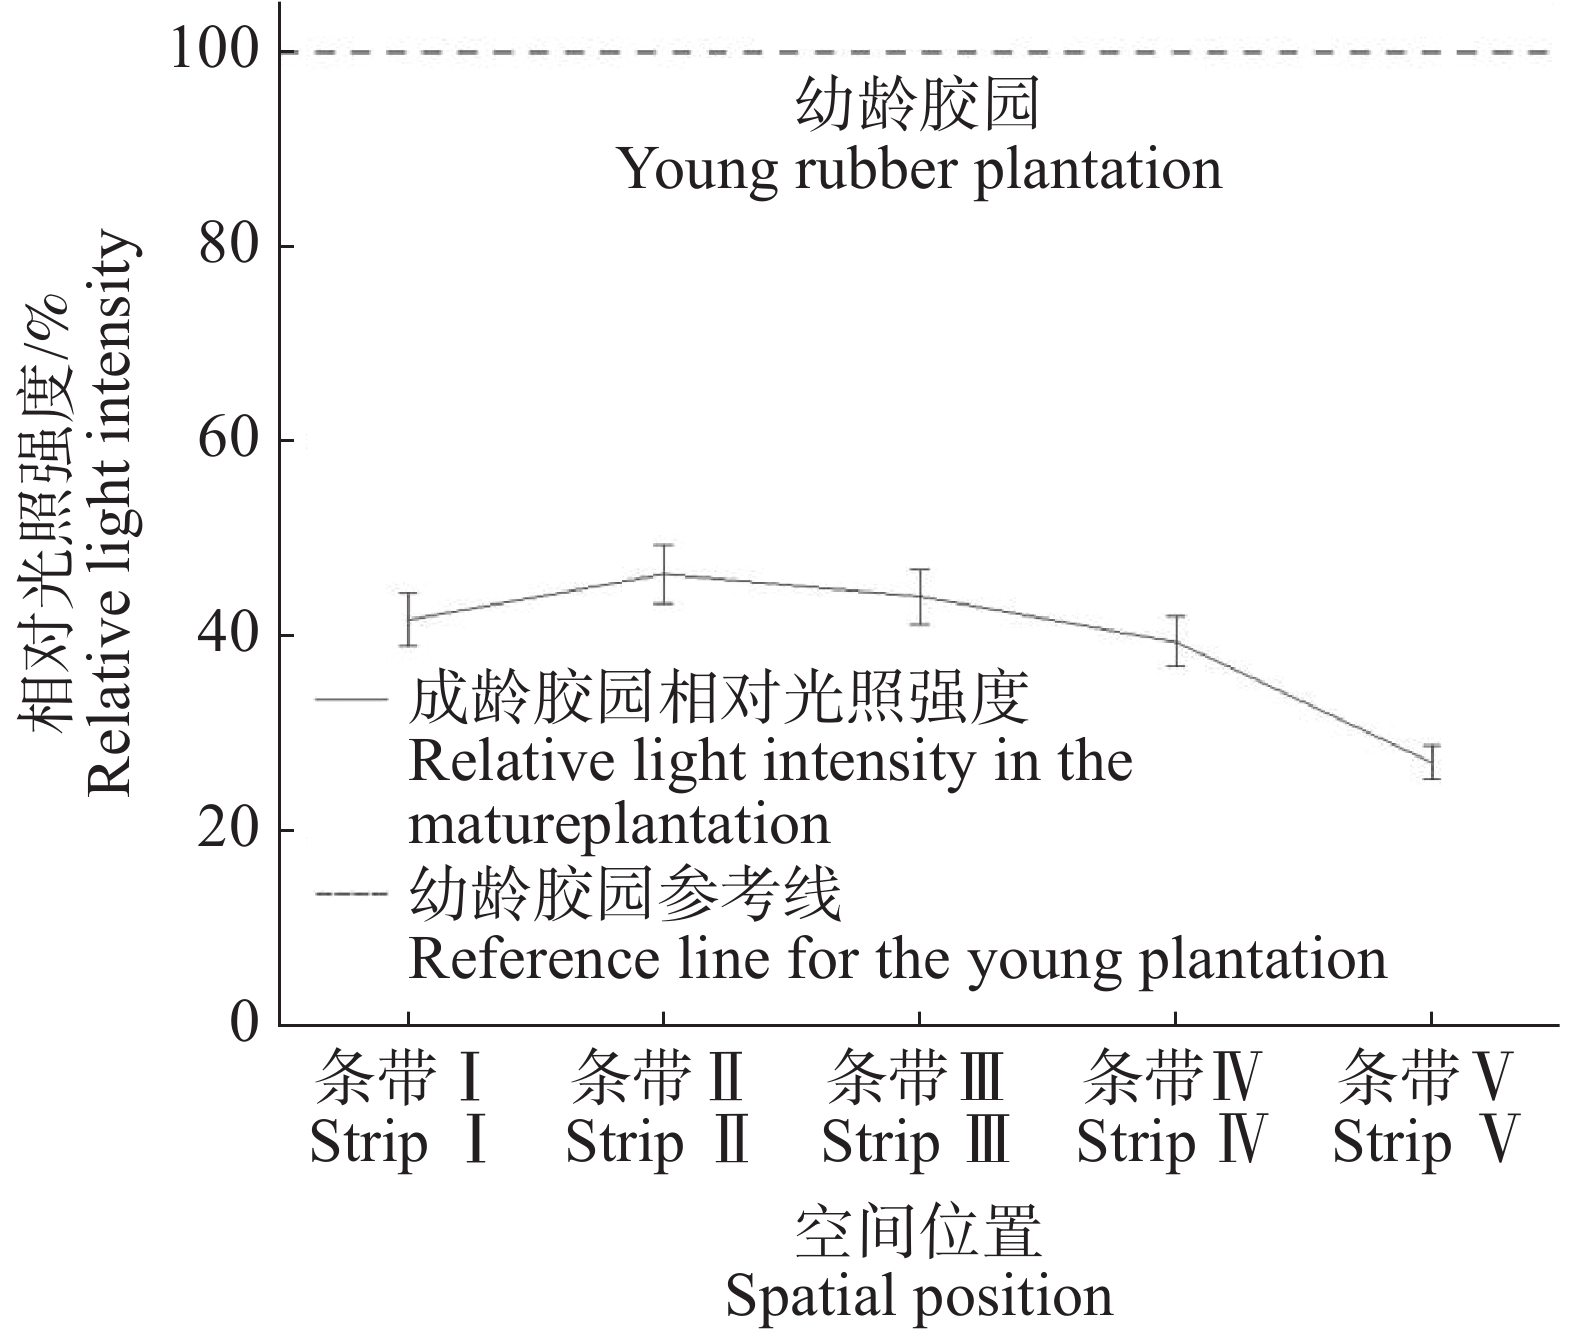
Organic matter17.37±1.12 6.79±0.22 注:表中数据为算术平均值±标准误(n = 12)。 Note: Data are presented as the arithmetic mean±standard error(n = 12). 从图3可知,成龄橡胶林下相对光照强度为27.07%~46.45%,Ⅱ和Ⅲ条带较高,Ⅴ条带最低,仅为27.07%。成龄胶园不同条带0~20 cm表层土壤理化性质差异不显著(P>0.05),成龄胶园内各光条带处于同一林龄和管理背景下,条带间田菁生长差异可主要结合林下光环境差异进行分析。
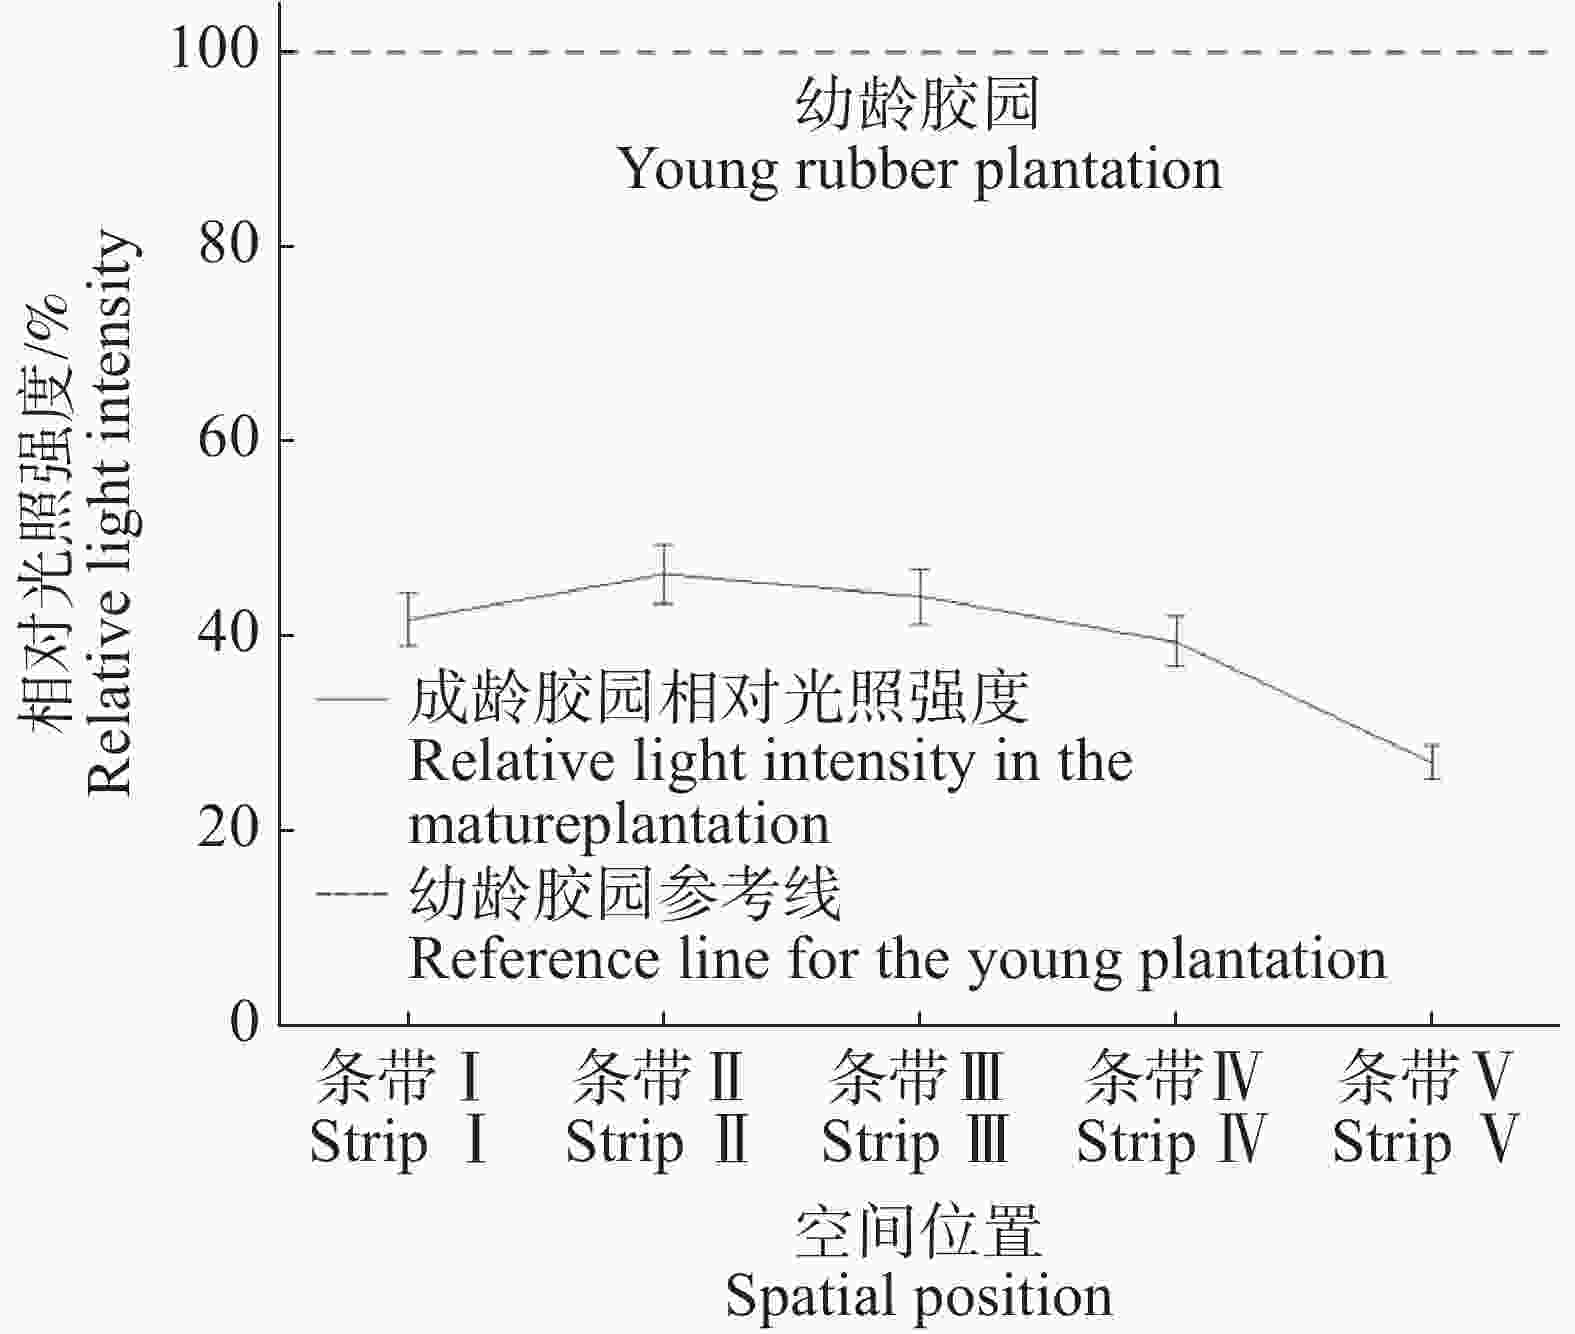
图 3 成龄胶园不同光条带相对光照强度
Figure 3. Relative light intensity in different light strips of the mature rubber plantation
-
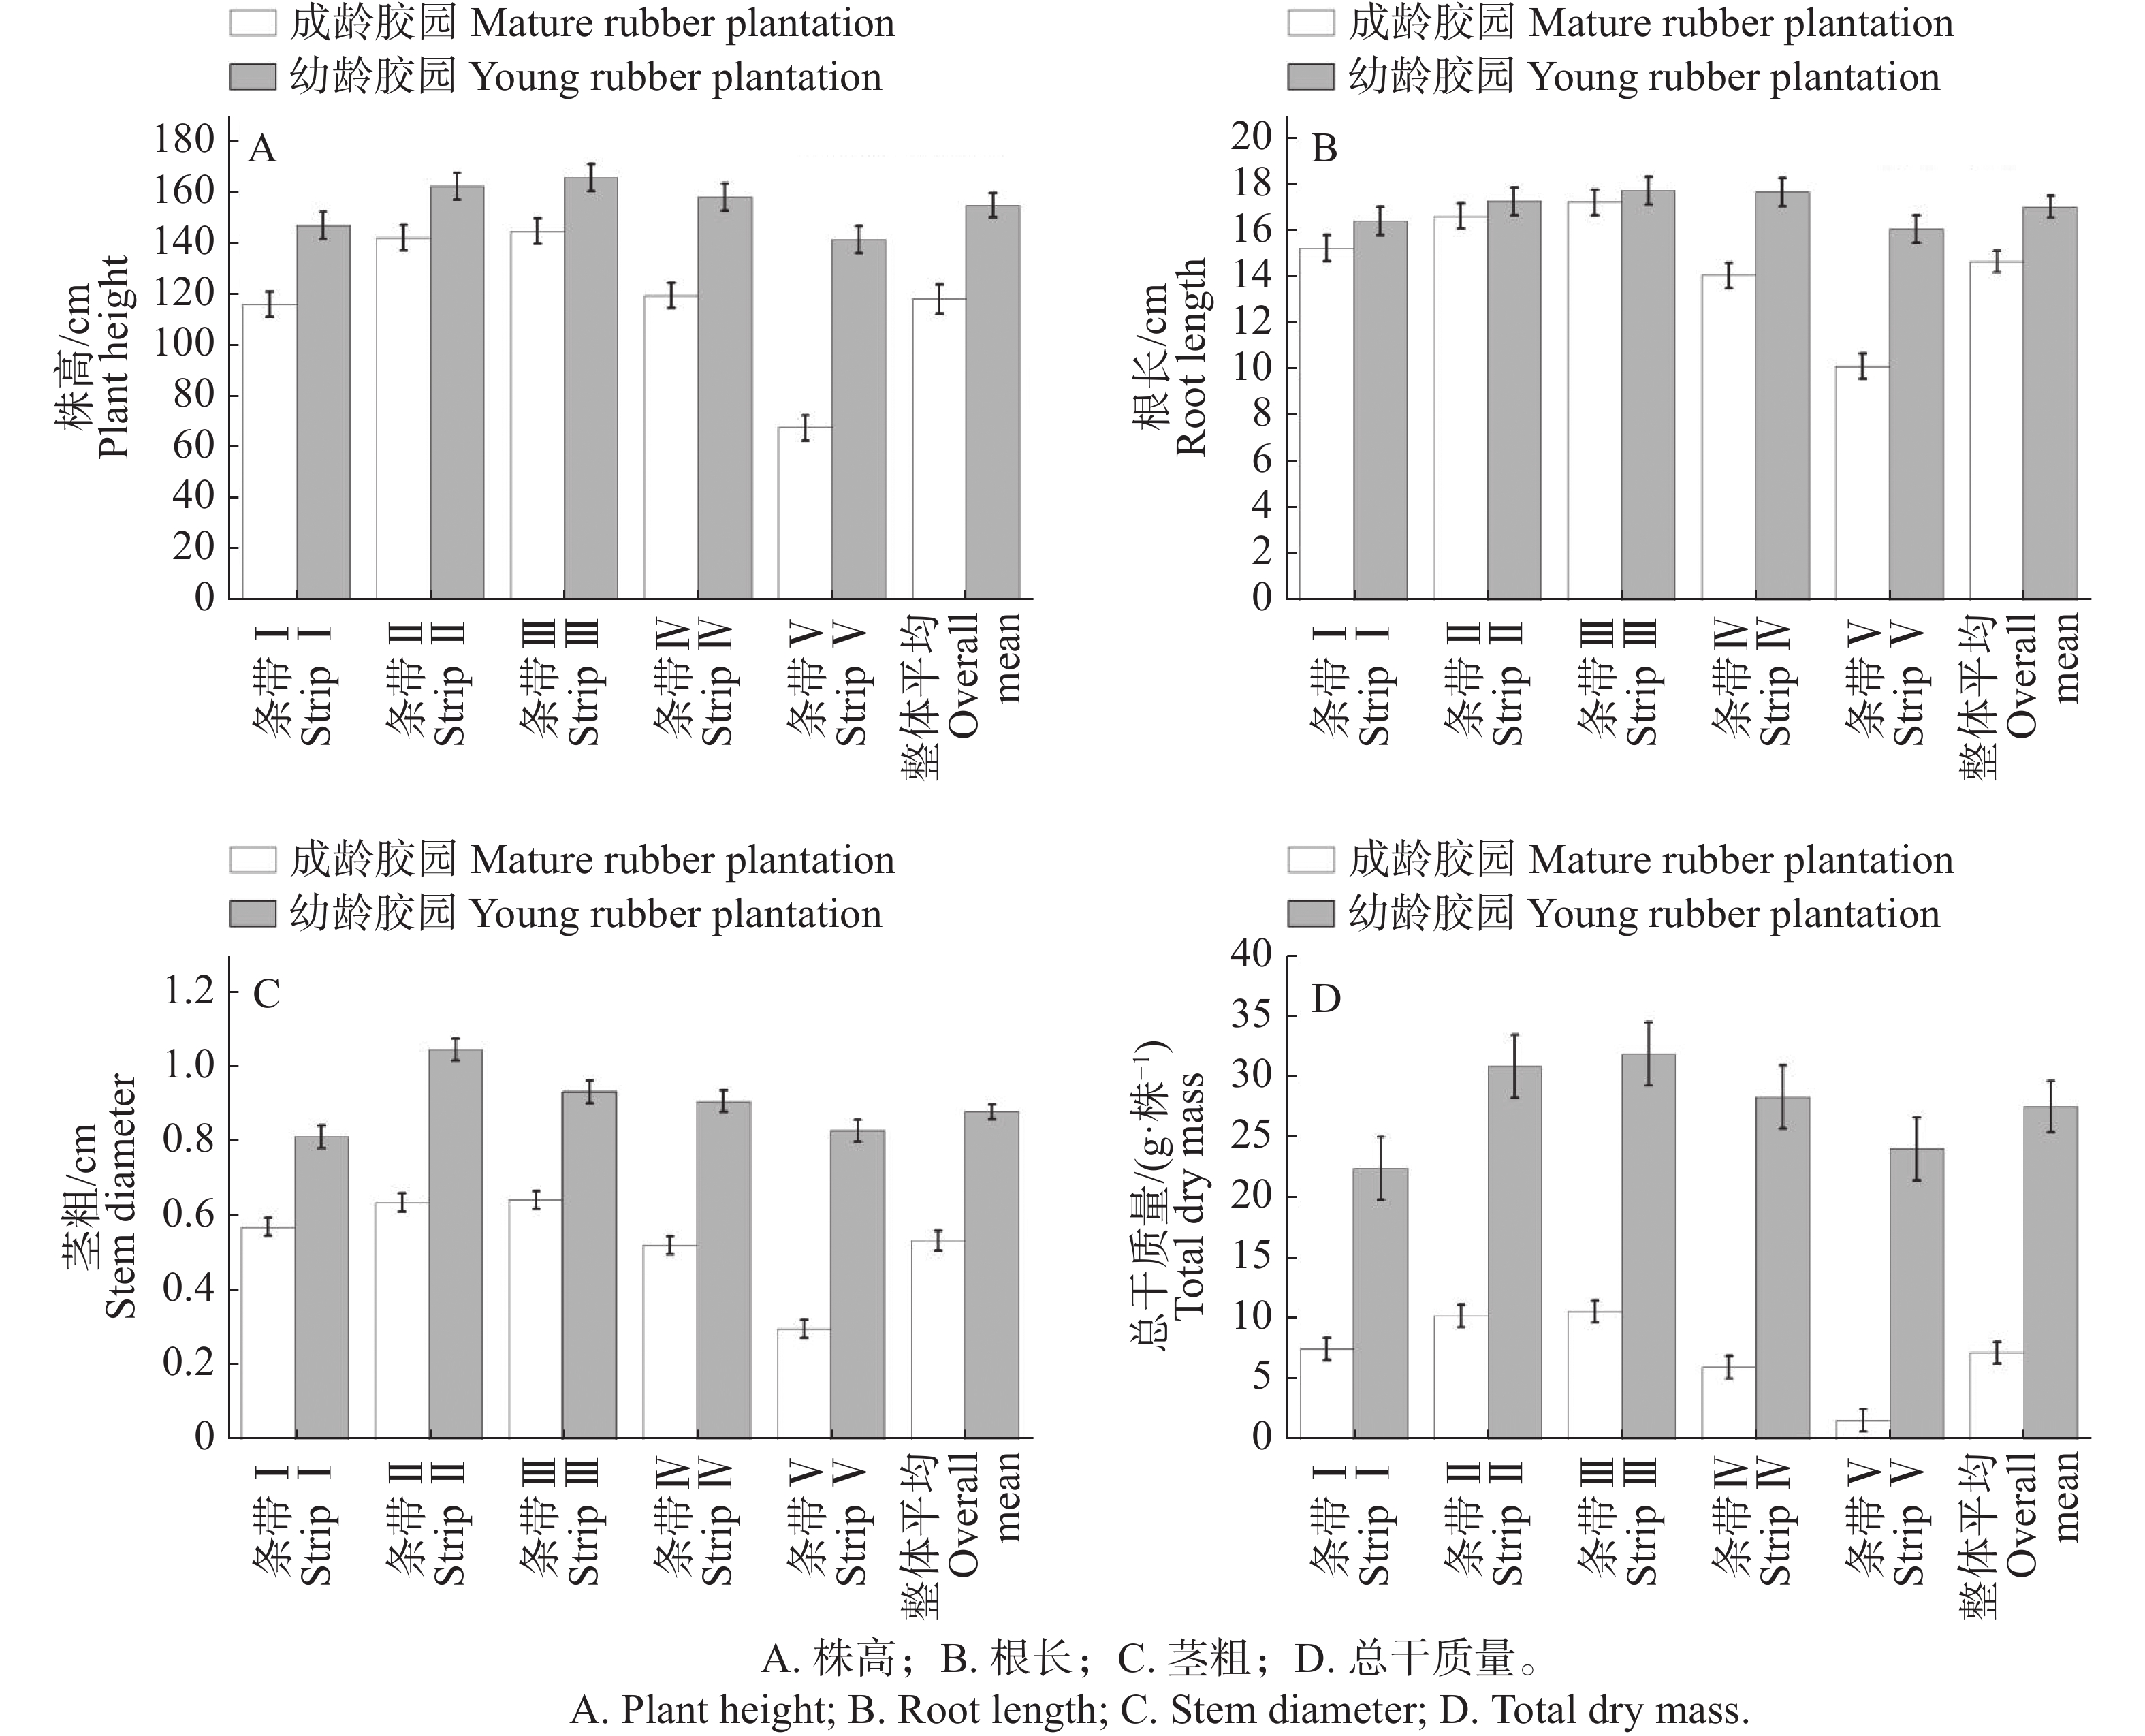
从图4可知,幼龄胶园田菁株高、根长、茎粗和总干质量分别为155.07 cm、17.16 cm、0.88 cm、27.59 g·株−1,均高于成龄胶园的118.14 cm、14.78 cm、0.54 cm和7.26 g·株−1。与幼龄胶园相比,成龄胶园株高、根长、茎粗和总干质量分别低23.82%、13.87%、38.64%、73.69%,其中总干质量降幅最大。
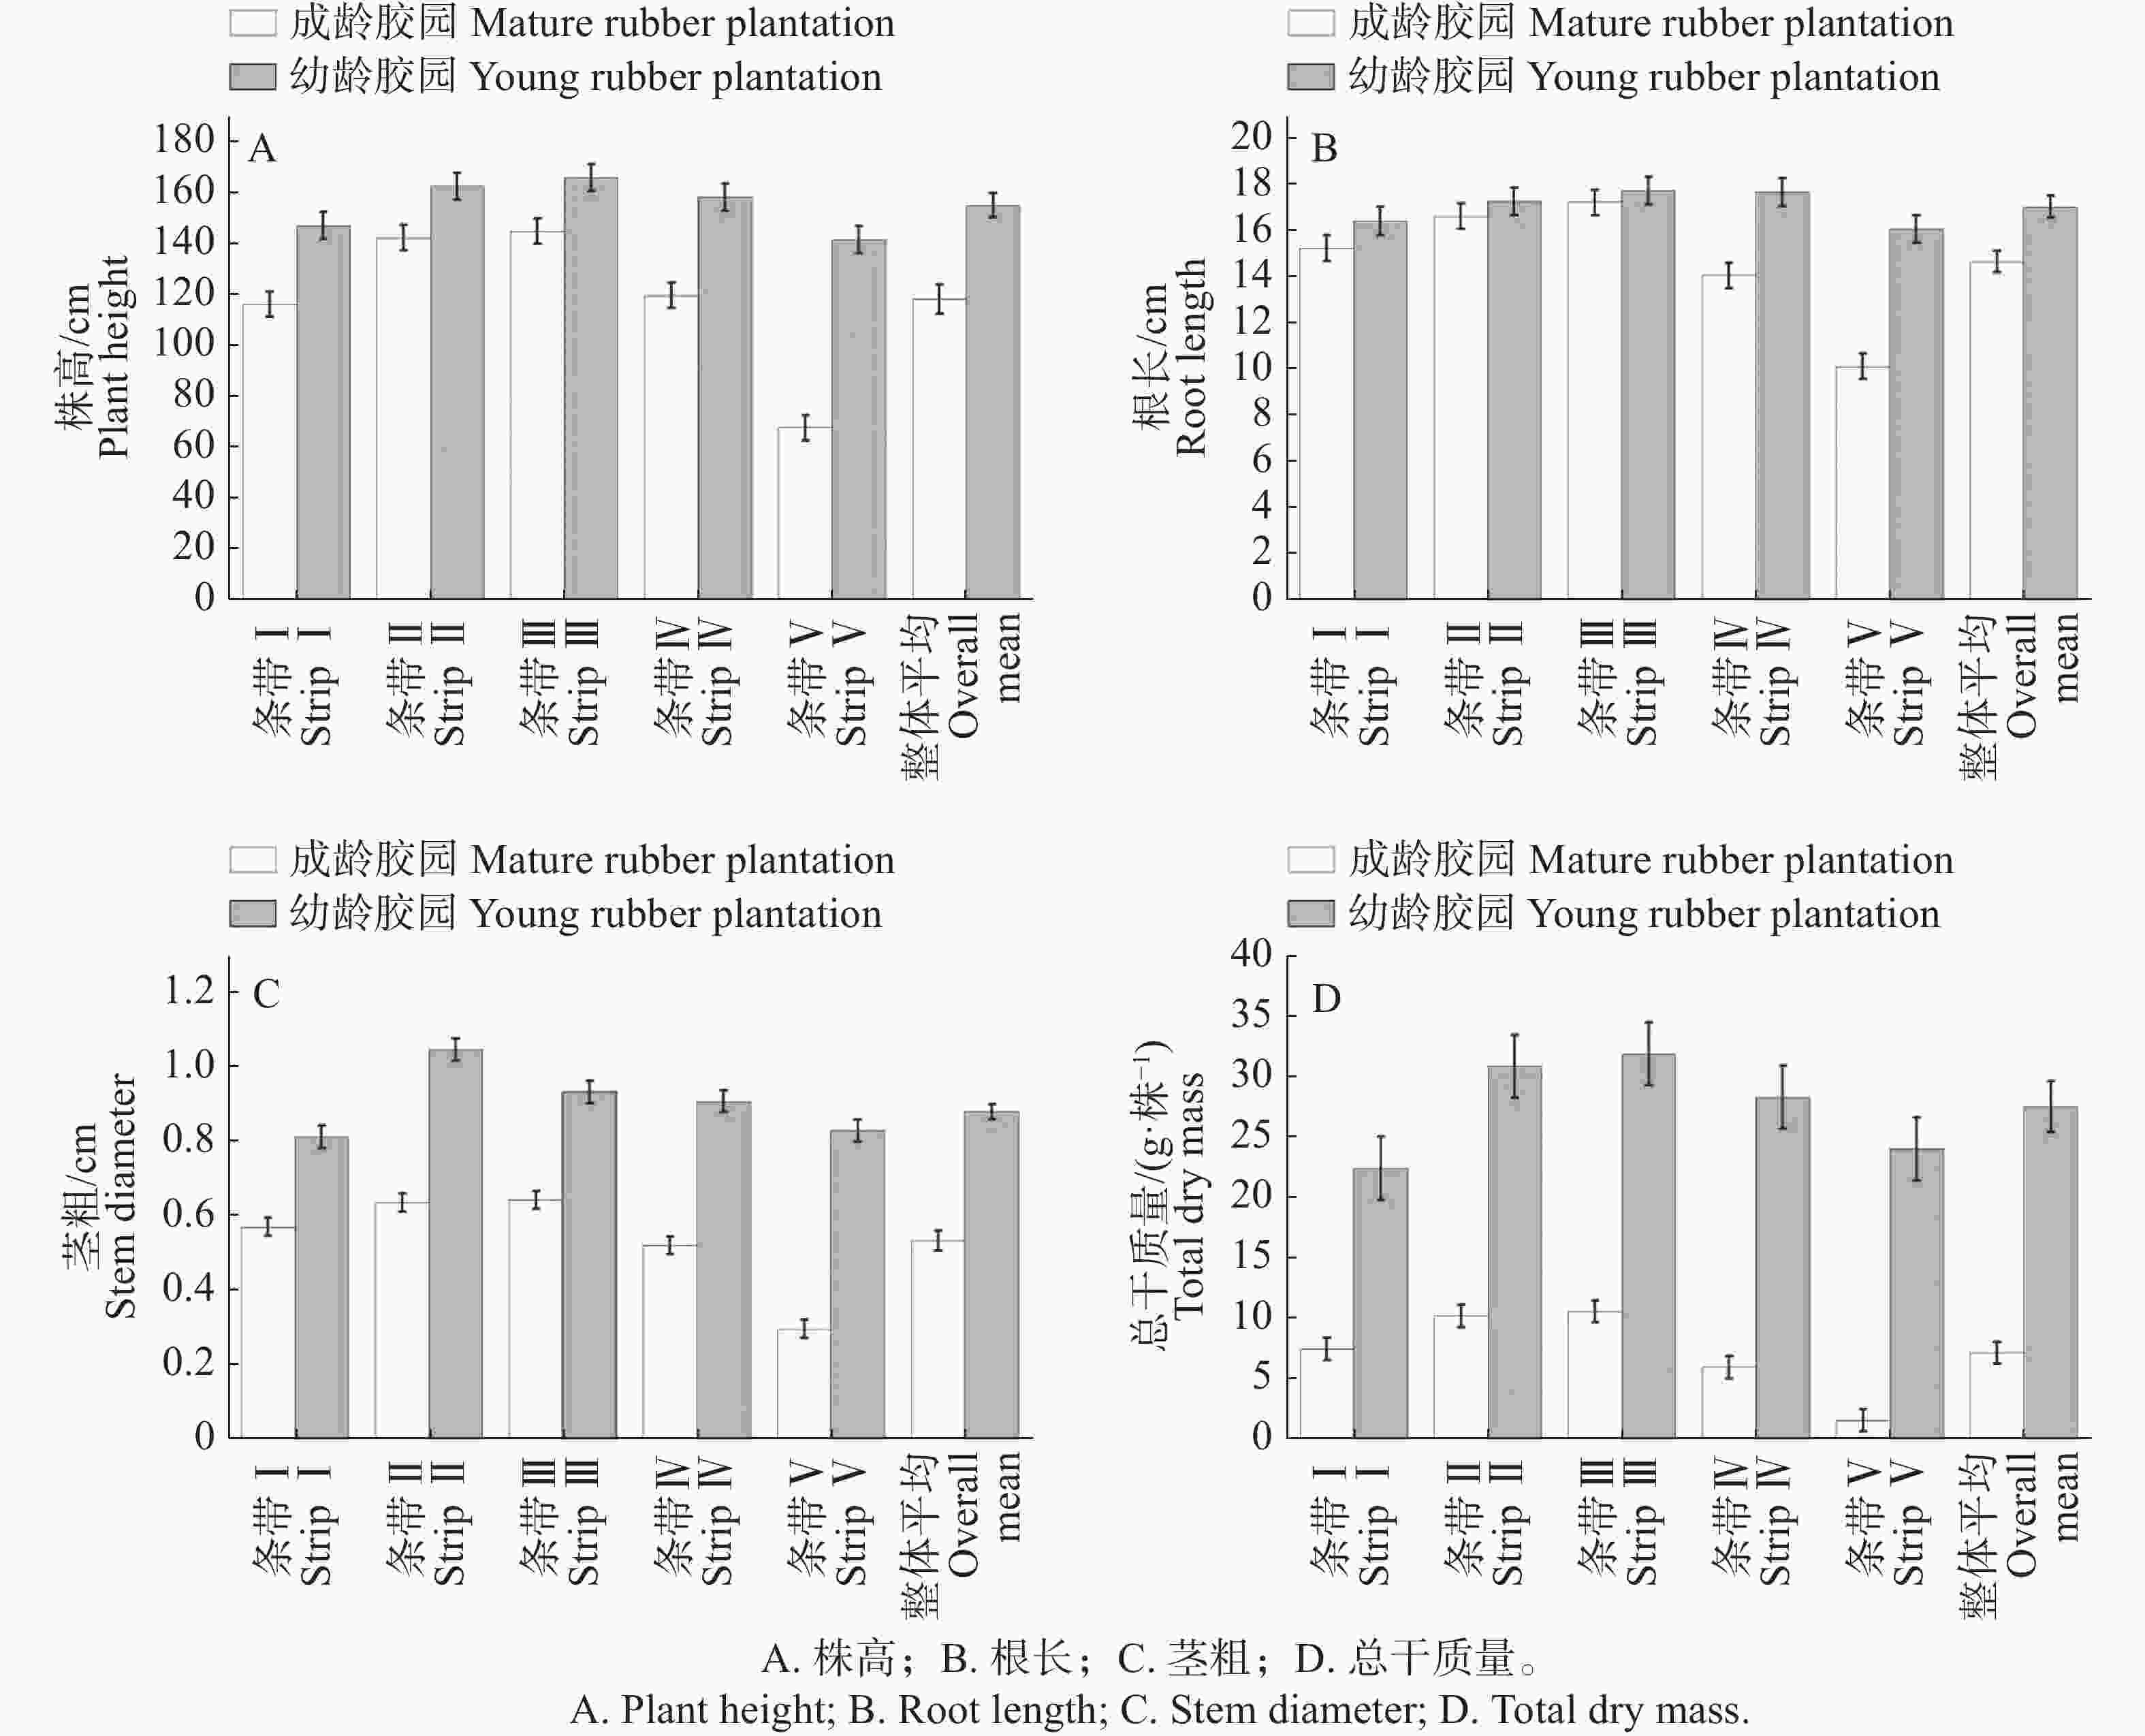
图 4 不同林龄胶园各条带田菁形态生长及总干质量变化
Figure 4. Changes in morphological growth and total dry mass of S. cannabina in each strip of rubber plantations with different stand ages
幼龄胶园仅株高在条带间差异显著(P=0.033),根长、茎粗和总干质量差异均不显著。成龄胶园中,田菁株高、根长、茎粗和总干质量在不同光照条带间差异均达到极显著水平(P<0.001),其中,Ⅱ和Ⅲ条带各指标总体较高,Ⅴ条带最低。
成龄胶园根冠比均值高于幼龄胶园,分别为0.175和0.112。不同条带间根冠比差异不显著(P>0.05),但成龄胶园根冠比数值总体呈现Ⅰ至Ⅴ升高的趋势,分别为0.162、0.162、0.166、0.172和0.211。
-
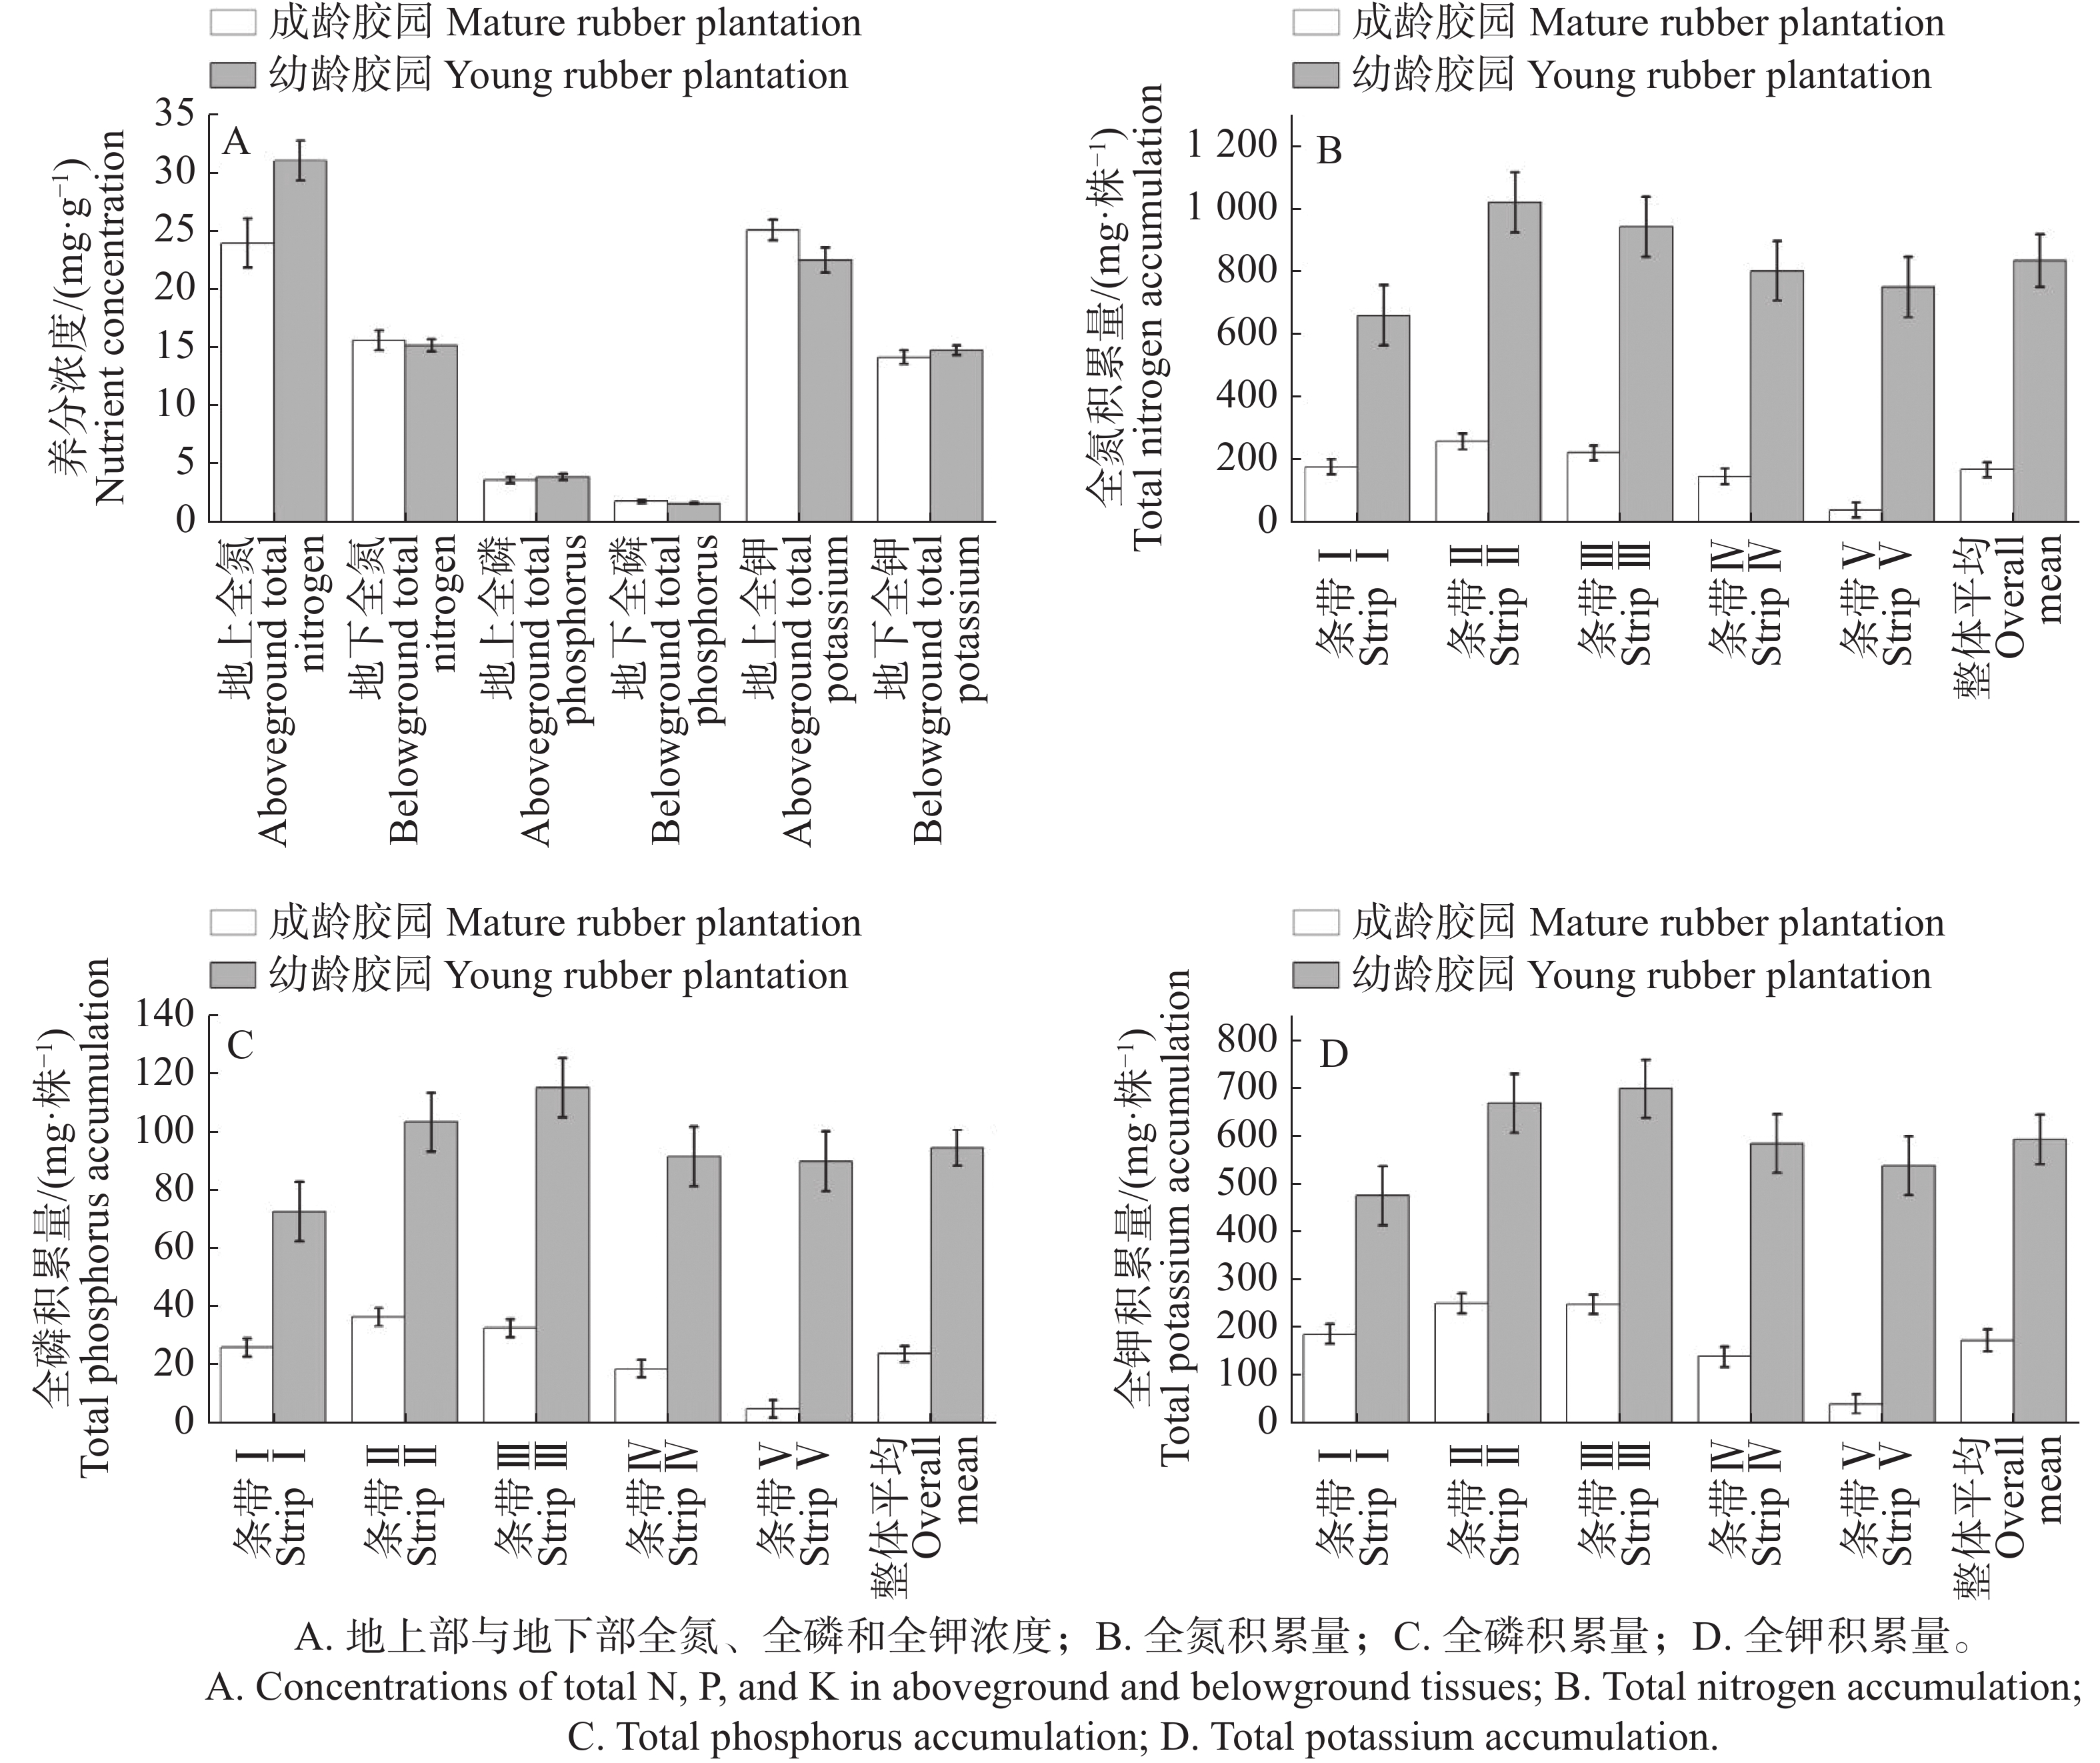
从图5可知,不同林龄胶园田菁养分浓度及积累量表现出不同响应。成龄胶园地上部全氮浓度较幼龄胶园低22.87%,而地上部全钾浓度较幼龄胶园高11.47%;其余养分浓度指标相差不明显。与养分浓度相比,两个供试胶园间养分积累量的相对差异更为明显。幼龄胶园田菁全氮、全磷和全钾积累量分别为834.74、94.49、592.15 mg·株−1,成龄胶园分别为169.44、23.53、172.87 mg·株−1。与幼龄胶园相比,成龄胶园田菁全氮、全磷和全钾积累量分别降低79.70%、75.10%和70.81%。
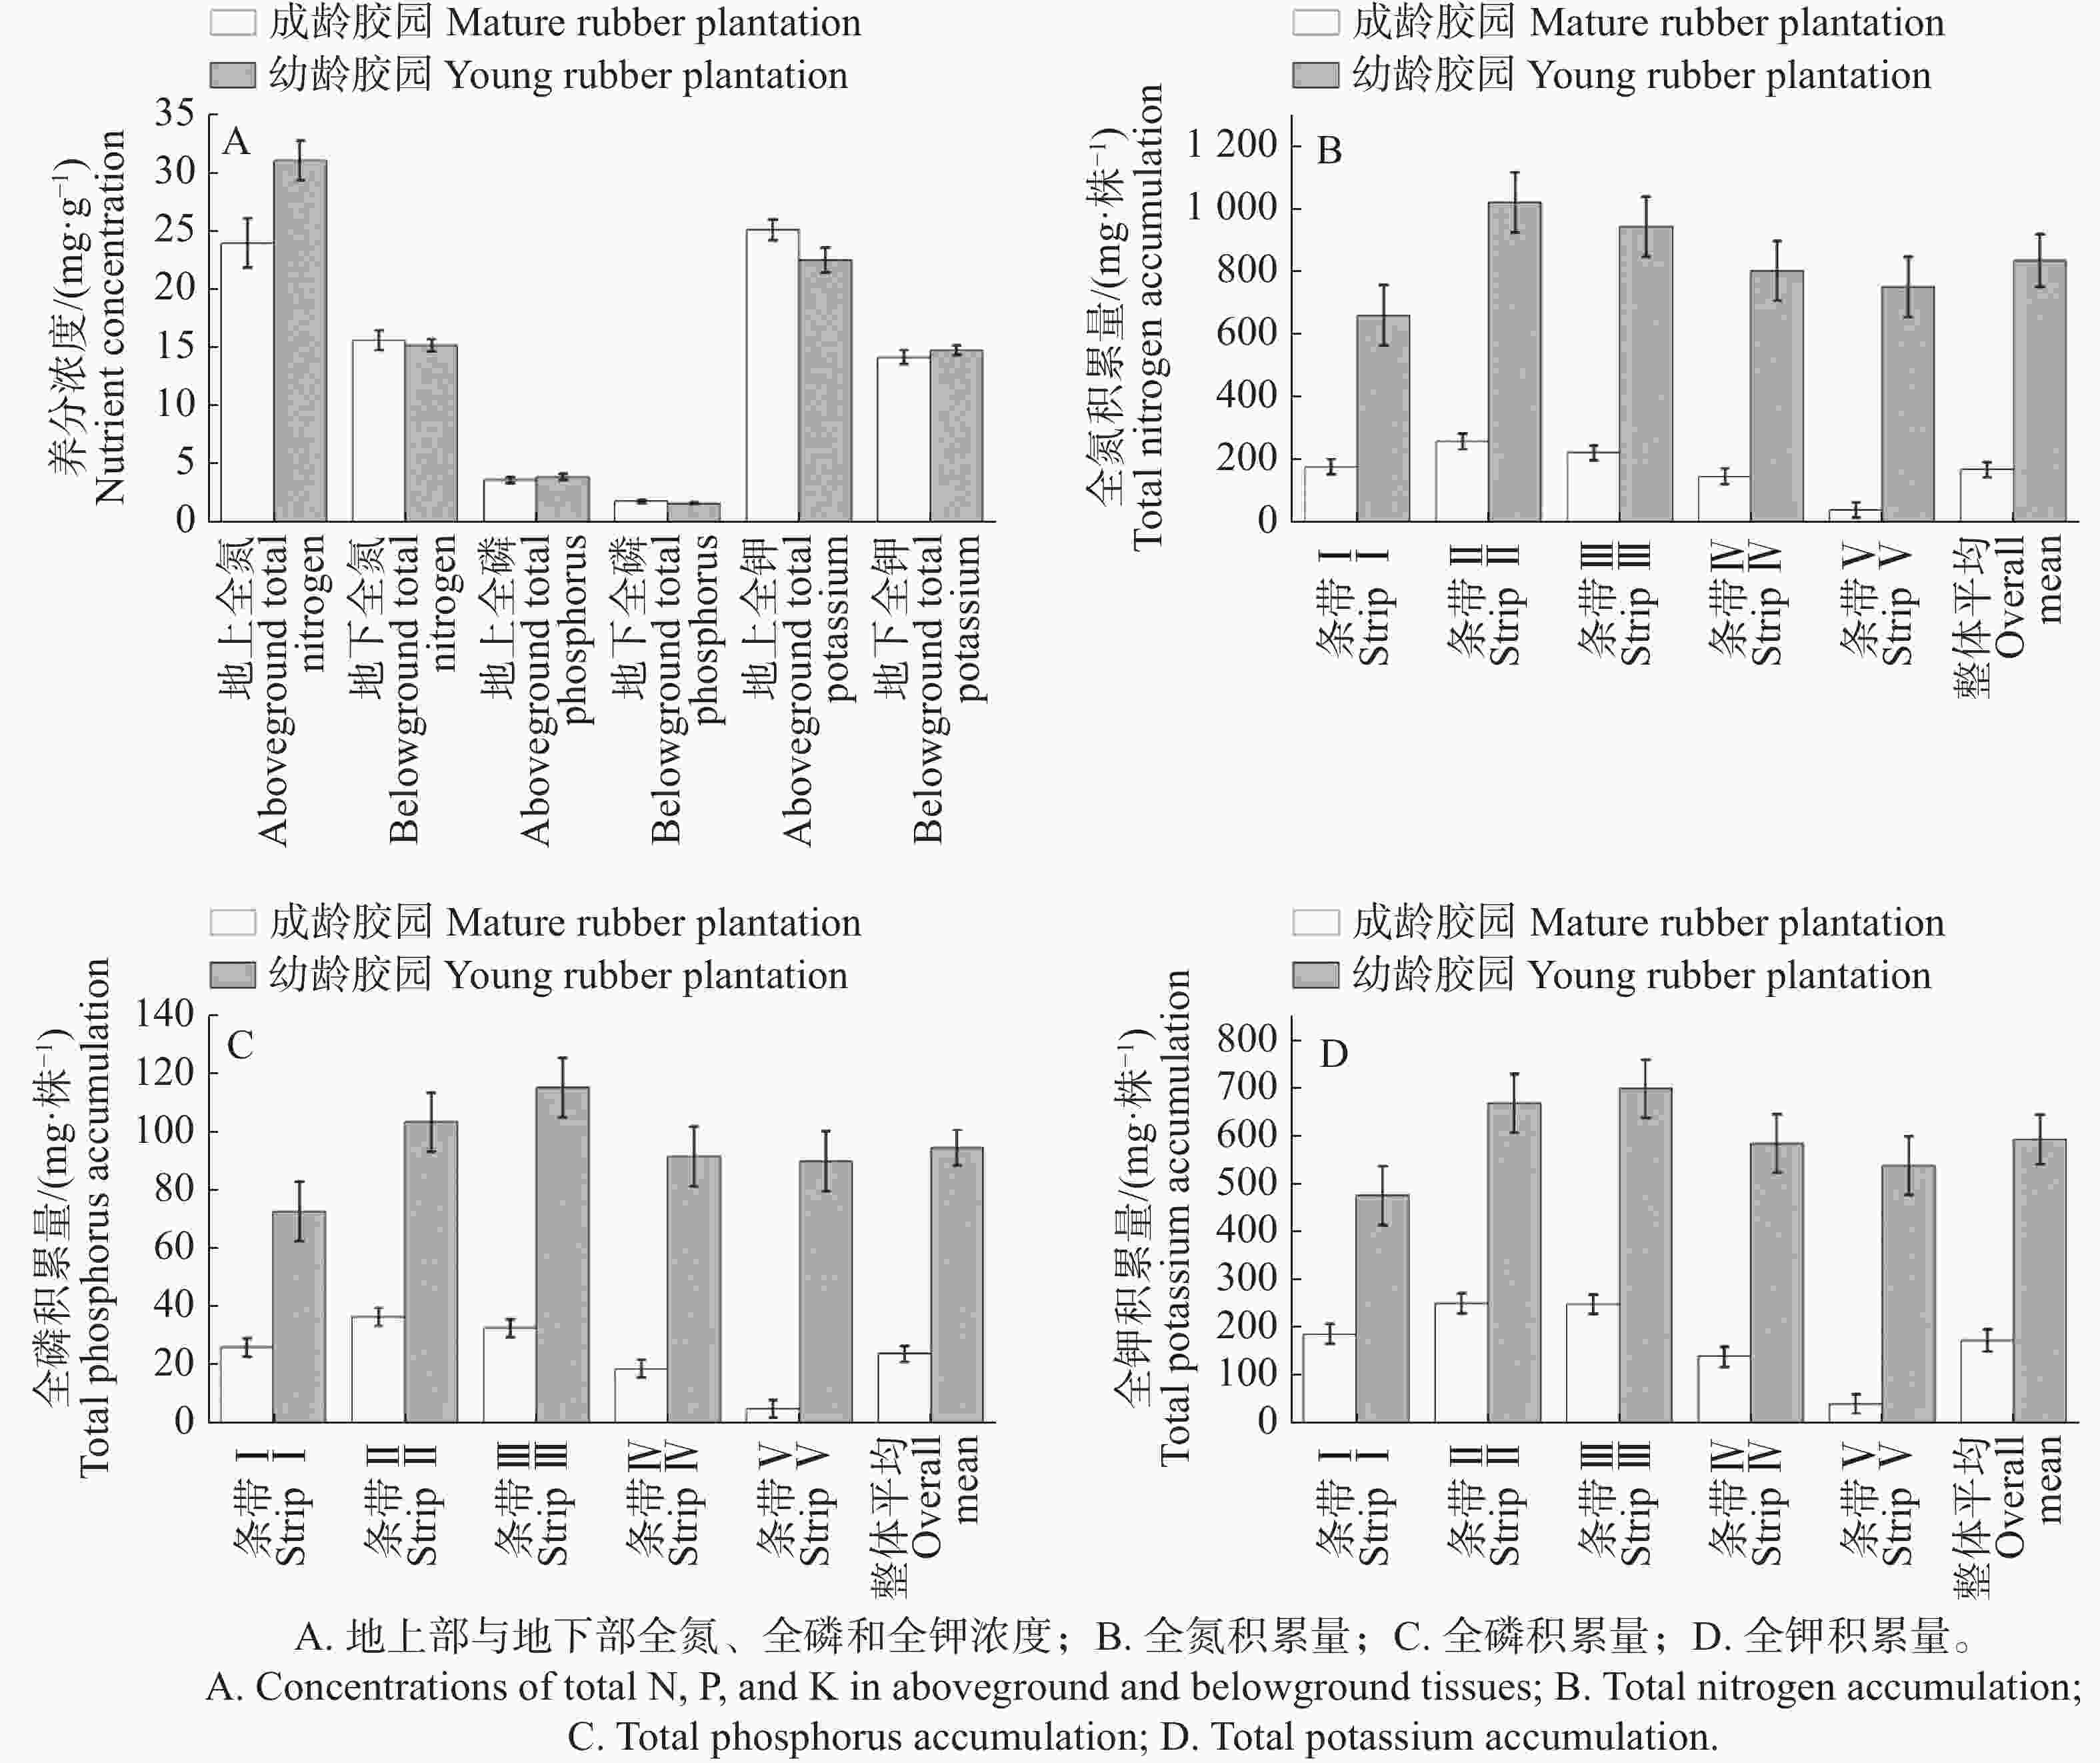
图 5 不同林龄胶园田菁养分浓度及养分积累量变化
Figure 5. Changes in nutrient concentrations and nutrient accumulation of Sesbania cannabina in rubber plantations with different stand ages
幼龄橡胶园不同条带养分积累差异均不显著(P>0.05);从表2可知,成龄橡胶园养分积累均受光条带极显著影响(P<0.001),其中Ⅱ和Ⅲ条带养分积累量较高、Ⅴ条带最低。与Ⅱ条带相比,Ⅴ条带全氮、全磷和全钾积累量分别降低84.18%、87.27%和83.85%。
表 2 成龄橡胶园不同光条带下田菁氮、磷、钾积累量
Table 2. N, P and K accumulation in S. cannabina under different light strips in the mature rubber plantation
条带
Strip全氮积累量/
(mg·株−1)
Total
nitrogen accumulation全磷积累量/
(mg·株−1)
Total phosphorus accumulation全钾积累量/
(mg·株−1)
Total potassium accumulationⅠ 178.31±25.12ab 25.82±3.08ab 186.18±20.11ab Ⅱ 258.57±25.12a 36.29±3.08a 249.92±20.11a Ⅲ 222.20±25.12ab 32.42±3.08a 248.69±20.11a Ⅳ 147.23±25.12b 18.50±3.08b 139.20±20.11b Ⅴ 40.91±25.12c 4.62±3.08c 40.38±20.11c 注:表中数据为边际均值±标准误(n=12)。不同小写字母表示差异显著(P<0.05)。 Note: Data are presented as estimated marginal means±standard errors(n=12). Different lowercase letters indicate significant differences(P<0.05). -
从表3线性混合模型分析可知,照度对成龄胶园田菁的株高、根长、茎粗、总干质量、全氮积累量、全磷积累量和全钾积累量均有极显著的正向关联(P<0.001)。为便于解释,将照度以
1000 lx 为单位进行缩放后,照度每增加1000 lx,株高、根长、茎粗、总干质量、全氮积累量、全磷积累量和全钾积累量分别平均增加5.3 cm、0.5 cm、0.02 cm、0.6 g、14.4 mg、2.2 mg 和 14.9 mg。这表明在本供试成龄胶园内,条带照度与田菁生长及养分积累呈显著正相关。表 3 照度与成龄胶园田菁生长及养分积累的线性混合模型结果
Table 3. Results of the linear mixed-effects model for the relationships between light intensity and the growth and nutrient accumulation of S. cannabina in the mature rubber plantation
指标
Indicator系数(每 1000 lx)
Coefficient
(per1000 lx)p值
p-value株高/cm
Plant height5.30 <0.001 根长/cm
Root length0.50 <0.001 茎粗/cm
Stem diameter0.02 <0.001 总干质量/
(g·株−1)
Total dry mass0.60 <0.001 全氮积累量/
(mg·株−1)
Total nitrogen
accumulation14.40 <0.001 全磷积累量/
(mg·株−1)
Total phosphorus accumulation2.20 <0.001 全钾积累量/
(mg·株−1)
Total potassium accumulation14.90 <0.001 注:模型中固定效应为照度和品系,随机效应为小区。 Note: The mixed-effects model included illuminance and S. cannabina line as fixed effects and plot as a random effect. Illuminance was expressed in units of 1000 lx.进一步采用广义加性混合模型(GAMM)检验照度与各指标的非线性关系,结果显示,GAMM拟合中,株高、根长和茎粗平滑项的edf均约为1,表明在当前数据范围与模型设定下,估计关系接近线性。总干质量及全氮、全钾积累量的edf为1.37~1.64,全磷积累量为1.85,提示拟合曲线存在一定弯曲。另行拟合的二次项模型中,全磷积累量的照度二次项未达到预设显著性水平(P=0.054)。综合认为,照度对各指标的作用以线性正效应为主。
-
从表4可知,在2个供试胶园内,不同田菁品系的生长及养分积累存在明显差异(P<0.05),与幼龄胶园相比,成龄胶园中不同品系的表现分化更为明显。幼龄胶园中,‘6055’、‘6113’和‘8001’的单株干物质形成和养分积累水平较高,其中总干质量分别为31.73 g、28.76 g和31.25 g;全氮积累量分别为934.60、984.00和972.70 mg·株−1;全钾积累量分别为660.86、675.62和657.87 mg·株−1;‘6070’品系的生物量与养分积累相对较低。
表 4 不同林龄胶园田菁品系生长、生物量及养分积累特征
Table 4. Characteristics of growth, biomass and nutrient accumulation of S. cannabina lines in rubber plantations with different stand ages
林龄
Stand age品系
Line株高/cm
Plant height根长/cm
Root
length茎粗/cm
Stem
diameter总干质量/
(g·株−1)
Total dry
mass根冠比
Root/
shoot ratio全氮积累量/
(mg·株−1)
Total
nitrogen
accumulation全磷积累量/
(mg·株−1)
Total
phosphorus
accumulation全钾积累量/
(mg·株−1)
Total
potassium
accumulation幼龄胶园
Young
rubber
plantation6055 170.76±7.42a 15.69±0.54b 0.85±0.04a 31.73±3.43a 0.1077 ±0.006b934.60±116.88a 86.42±12.24a 660.86±77.15a 6070 155.09±7.42ab 15.93±0.54b 0.90±0.04a 18.62±3.43b 0.1460 ±0.006a447.67±116.88b 83.90±12.24a 374.23±77.15b 6113 158.08±7.42ab 18.96±0.54a 0.90±0.04a 28.76±3.43ab 0.1105 ±0.006b984.00±116.88a 93.77±12.24a 675.62±77.15a 8001 136.34±7.42b 18.07±0.54a 0.87±0.04a 31.25±3.43a 0.0805 ±0.006c972.70±116.88a 113.85±12.24a 657.87±77.15a 成龄胶园
Mature
rubber
plantation6055 139.96±7.02a 15.53±0.85a 0.56±0.04ab 9.04±1.22a 0.1634 ±0.013b214.89±22.80ab 27.24±4.14ab 206.54±21.38ab 6070 100.18±7.02b 13.35±0.85a 0.47±0.04b 3.76±1.22b 0.2185 ±0.013a67.89±22.80c 15.01±4.14b 80.80±21.38c 6113 130.10±7.02a 16.12±0.85a 0.65±0.04a 10.24±1.22a 0.1598 ±0.013b249.20±22.80a 32.64±4.14a 270.04±21.38a 8001 102.30±7.02b 14.10±0.85a 0.47±0.04b 6.02±1.22ab 0.1561 ±0.013b145.80±22.80bc 19.23±4.14ab 134.12±21.38bc 注:表中数据为边际均值±标准误(n为每个品系3个小区)。同一林龄内同列不同小写字母表示品系间差异显著(P<0.05)。 Note: Data are presented as estimated marginal means±standard errors(n = 3 plots per line). Within the same stand age, different lowercase letters in the same column indicate significant differences among S. cannabina lines at P<0.05. 成龄胶园弱光环境下,‘6113’品系总干质量和养分积累量均较高,单株总干质量为10.24 g,全氮、全磷和全钾积累量分别为249.20、32.64和270.04 mg·株−1;‘6055’株高最高,为139.96 cm,但总干质量和养分积累量低于‘6113’。总体上,不同品系在不同林龄胶园中的生长和养分积累存在明显差异。
-
基于熵权法确定的各指标权重如表5所示。成龄胶园中,茎粗(0.212 8)和株高(0.184 6)的权重较大,是影响品系排序的关键指标;幼龄胶园中,全磷积累量(0.232 1)和根长(0.205 2)的权重最大,对品系综合评价起主导作用。
表 5 不同林龄指标熵权权重
Table 5. Entropy weights of indicators in rubber plantations of different stand ages
林龄
Stand age株高/cm
Plant height根长/cm
Root length茎粗/cm
Stem diameter总干质量/
(g·株−1)
Total dry mass全氮积累量/
(mg·株−1)
Total
nitrogen
accumulation全磷积累/
(mg·株−1)
Total
phosphorus
accumulation全钾积累/
(mg·株−1)
Total
potassium
accumulation成龄胶园
Mature rubber plantation0.184 6 0.125 3 0.212 8 0.114 9 0.106 9 0.131 0 0.124 4 幼龄胶园
Young rubber plantation0.118 4 0.205 2 0.125 6 0.107 6 0.105 7 0.232 1 0.105 5 注:权重反映各指标在品系间差异的相对重要性,某一指标权重越大,说明该指标在品系间变异越大,对综合排序的影响越强。 Note: The weights represent the relative importance of each indicator in difference among S. cannabina lines. A higher weight indicates greater variation in the corresponding indicator among the lines and, consequently, a stronger influence on the overall ranking. 由表6可知熵权TOPSIS综合得分,成龄胶园中‘6113’品系得分最高(0.890 1),‘6055’次之(0.693 7),‘8001’和‘6070’得分较低(分别为0.204 7和0.000 0),‘6113’综合表现最优。幼龄胶园中,‘8001’得分最高(0.692 0),‘6113’紧随其后(0.657 5),‘6055’和‘6070’得分为0.398 3和0.285 3,‘8001’和‘6113’综合表现较佳且较为接近。
表 6 不同林龄各品系熵权TOPSIS综合得分及排序
Table 6. Entropy-weighted TOPSIS composite scores and rankings of S. cannabina lines intercropped in rubber plantatiions of different stand ages
林龄
Stand age品系
Line综合得分
Composite score排名
Rank成龄胶园
Mature rubber plantation‘6113’ 0.890 1 1 ‘6055’ 0.693 7 2 ‘8001’ 0.204 7 3 ‘6070’ 0.000 0 4 幼龄胶园
Young rubber plantation‘8001’ 0.692 0 1 ‘6113’ 0.657 5 2 ‘6055’ 0.398 3 3 ‘6070’ 0.285 3 4 注:综合得分取值范围为0~1,得分越高表明该品系在所属林龄内综合表现越好。由于2个林龄是分别标准化和赋权,得分仅反映林龄内的相对优劣,不能进行跨林龄直接比较。由于2个林龄仅由单个地块代表,此得分排序仅反映品系在本次供试特定地块中的相对表现。 Note: Composite scores range from 0 to 1, with higher scores indicating better overall performance of a line within the corresponding stand age. Because the two stand ages were standardized and weighted separately, the scores reflect only the relative performance of S. cannabina lines in rubber plfantations within each stand age and should not be directly compared across stand ages. As each stand age was represented by a single plantation plot, these scores and rankings only indicate the relative performance of the lines under the specific conditions of the tested plots. 综合来看,成龄胶园中‘6113’为最优品系,幼龄胶园中‘8001’和‘6113’表现最佳。
-
成龄胶园林下环境中田菁生长与养分积累明显降低,且生物量降幅高于株高、茎粗等形态性状。成龄胶园田菁株高、根长、茎粗、总干质量及氮、磷、钾积累量均低于幼龄胶园,其中总干质量降幅达73.69%,高于株高(23.82%)和根长(13.87%),可能是由于生物量形成对胶园环境差异更为敏感。弱光条件下植物可通过优先生长地上部提高对有限光资源的利用能力[21-22],但本研究中成龄胶园根冠比由幼龄胶园的0.112升至0.175,与典型弱光条件下的响应模式并不完全一致,提示除光环境外,地下资源可利用性及与橡胶树的根系竞争也可能参与田菁生长调控,其具体作用机制仍需根系过程的实测数据验证。
成龄胶园田菁氮、磷和钾积累量均明显下降,且变化趋势与单株生物量总体一致。养分积累量由生物量和养分浓度共同决定,本研究进一步发现,成龄胶园田菁地上部全氮浓度较幼龄胶园低22.87%,而全钾浓度高11.47%,其余养分浓度差异不明显。因此,成龄胶园田菁养分积累量的下降主要表现为生物量降低,而养分浓度变化的影响相对有限。地上部全氮浓度下降可能与弱光条件下碳同化受限及氮素同化过程受到影响有关[23-24];全钾浓度升高可能与生物量降低导致的钾素稀释效应减弱有关[25]。因此,胶园绿肥品系筛选除关注养分浓度外,还应重视生物量形成及其与养分积累之间的协同性,因为较高的单株干物质和养分积累量表明较大的单株潜在还田物质基础[26-27]。
不同田菁品系在弱光环境下表现出明显的生长与养分积累差异。成龄胶园中,‘6113’总干质量及氮、磷、钾积累量较高;而‘6055’虽具有较高株高,但总干质量和养分积累低于‘6113’;‘6070’根冠比最高,但生物量最低。这表明,株高或根冠比等单一形态性状的优势并不一定能转化为较高的单株干物质积累量,田菁林下适应性评价应综合考虑形态、生物量和养分积累等指标。熵权TOPSIS综合表明,‘6113’在成龄胶园中综合表现较优,其优势主要体现在根长、茎粗和总干质量等指标上,可能表明该品系在弱光条件下具有较好的生长和物质积累能力。幼龄胶园中‘8001’与‘6113’综合表现较好,可作为后续田间试验的候选品系。现有研究多关注不同绿肥种类的耐荫性差异[28]或多性状综合评价[29],本研究进一步表明,田菁不同品系在不同林龄中也具有明显的生长与养分积累差异。
-
不同林龄及条带间田菁单株干物质与养分积累的差异,可能与橡胶树冠层发育造成的林下光资源变化有关。成龄胶园田菁总干质量和养分积累量均值均低于幼龄胶园,且条带间差异明显;而成龄胶园各条带土壤理化性质差异不显著,林下相对光照强度为27.07%~46.45%。因此,在本研究测定的环境因子中,光环境可能是解释不同林龄及条带间田菁生长差异的重要因素之一,已有橡胶间作研究表明,冠层结构及林下光资源与间作作物生产力有关[30-32]。
在本研究中,成龄胶园照度与田菁全磷积累量具有极显著正相关,GAMM拟合中,全磷积累量平滑项的edf为1.85;另行拟合的混合模型中,照度二次项检验未达预设显著性水平(P=0.054)。全株磷积累量由生物量与组织磷浓度共同决定,现有分析尚不能区分二者对条带间磷积累差异的贡献。根际pH变化和根系分泌物可影响土壤无机磷的生物有效性,其作用取决于植物营养状态及土壤条件[33];橡胶农林复合系统中也存在种间地下养分竞争[34]。本研究未测定相关地下过程,尚不能判断其是否解释了田菁磷积累量的条带差异,也不能据此确认田菁受到磷限制。上述推测仍需结合根际养分动态及根系形态等过程研究进行验证。
林下植物响应并非完全取决于平均光照强度。成龄胶园Ⅱ条带相对光照强度略高于Ⅲ条带,但部分生长指标在Ⅲ条带的均值略高于Ⅱ条带,表明平均光照强度可能不足以完全表征林下实际光环境,植物生长还可能受到冠层结构、树行方向、太阳运动轨迹、光斑分布等因素的共同影响[35-36]。本试验中,成龄橡胶树为东西向种植,试验期太阳高度角逐渐变化,树冠投影范围随之发生移动,Ⅴ条带在试验期内可能受到较强冠层遮蔽,其生物量和养分积累量的均值总体最低。这一发现提示,林下绿肥生长和干物质积累评价不宜仅依赖平均光照强度,还需考虑冠层结构造成的光空间异质性及条带位置效应。
除光照外,橡胶农林复合系统中的种间水分利用关系也可能参与作物生长调节[37];玉米-大豆条带间作研究还表明,根系与土壤水分、养分的空间分布随行位发生变化[38]。这些地下过程是否影响本试验田菁的条带差异,仍需直接测定。因此,田菁在不同林龄胶园中的表现,可能是光环境变化、地下资源竞争及品系适应性差异共同作用的结果。结合品系评价和条带差异,‘6113’在成龄胶园弱光条件下表现出较好的综合适应性;‘8001’和‘6113’在幼龄胶园中具有较好的综合表现;同时,条带间生长与养分积累差异表明,橡胶园绿肥配置还应充分考虑冠层造成的光环境空间异质性。
本研究幼龄和成龄胶园各仅一个地块,林龄效应与土壤肥力、树行方向等立地条件完全混杂,且无林龄重复,故文中林龄差异仅作描述性比较,不宜视为普遍性规律。熵权TOPSIS法在供试品系数目较少(n=4)时权重稳定性有限,综合排序反映的是当前材料在特定条件下的相对表现。研究仅基于单生长季、单地点观测,时空代表性尚不充分。此外,评价指标集中在形态与养分积累,尚未纳入光合生理、根瘤固氮及翻压分解过程,各品系的田间培肥效果还需多年多点还田试验进一步确认。
-
本试验中,成龄胶园田菁的株高、根长、茎粗、单株总干质量及氮、磷、钾积累量均低于幼龄胶园。成龄胶园内,Ⅱ、Ⅲ条带的生长、单株总干质量和养分积累总体较高,Ⅴ条带总体较低,说明林下照度与田菁生长和养分积累呈一定的空间关联。本试条件下,‘8001’和‘6113’为幼龄胶园候选品系,‘6113’为成龄胶园进一步验证的候选品系。因各林龄仅设1个供试地且供试地块背景存在差异,以上结果不宜推断普遍林龄效应。本研究可为类似立地条件橡胶园林下田菁候选品系筛选及空间配置提供参考。
不同林龄橡胶园间作田菁的生长、养分积累特征及品系筛选
DOI: 10.15886/j.cnki.rdswxb.20260098
 CSTR: 32425.14.j.cnki.rdswxb.20260098
Growth and nutrient accumulation characteristics and line screening of Sesbania cannabina intercropped in rubber plantations of different stand ages
-
摘要: 为比较4个田菁品系(‘6055’、‘6070’、‘6113’和‘8001’)在2个不同林龄橡胶园供试地块中的生长及养分积累表现,在同一试验基地分别选取1个幼龄和1个成龄胶园地块,每品系设3个小区,小区内划分5个固定空间条带。测定田菁株高、根长、茎粗、总干质量及氮、磷、钾积累量,分析成龄胶园条带照度与田菁性状的空间关系,并采用熵权TOPSIS法对不同品系综合评价。结果表明:本试验条件下,成龄胶园田菁的株高、根长、茎粗、单株总干质量及氮、磷、钾积累量均低于幼龄胶园。成龄胶园内Ⅱ、Ⅲ条带田菁生长、单株总干质量和养分积累总体较高,Ⅴ条带总体较低,条带照度与田菁性状呈同步空间变化。熵权TOPSIS综合评价表明,幼龄胶园中‘8001’和‘6113’品系综合得分较高,成龄胶园中‘6113’品系综合表现最佳。研究结果可为类似立地条件橡胶林下田菁候选品系筛选及空间配置提供参考。Abstract: The growth and nutrient accumulation of four Sesbania cannabina lines (‘6055’, ‘6070’, ‘6113’, and ‘8001’) intercropped in rubber plantations were evaluated in one young and one mature plantation at the same experimental station. Three plots were established for each line in each plantation, and each plot was divided into five fixed spatial strips. Plant height, root length, stem diameter, total dry mass, and nitrogen (N), phosphorus (P), and potassium (K) accumulation were observed. The spatial relationships between strip-level light intensity and the traits of S. cannabina were analyzed in the mature rubber plantation, and the different S. cannabina lines were comprehensively evaluated using the entropy-weighted TOPSIS method. The results showed that the plant height, root length, stem diameter, total dry mass per plant, and N, P, and K accumulation were lower in the mature plantation than in the young plantation. Within the mature plantation, the plant growth, dry matter accumulation, and nutrient accumulation were generally greater in strips Ⅱ and Ⅲ and lower in strip V, broadly corresponding to the spatial variation in understory illuminance. The entropy-weighted TOPSIS analysis showed that the lines ‘8001’ and ‘6113’ had relatively high composite scores in the young rubber plantation, whereas the line ‘6113’ showed the best overall performance in the mature rubber plantation. These findings can provide reference for selection of candidate S. cannabina lines and their spatial arrangement for understory intercropping in rubber plantations under comparable site conditions.
-
Key words:
- Sesbania cannabina /
- rubber plantation /
- intercropping /
- stand age /
- light environment /
- nutrient accumulation /
- line evaluation
-
图 3 成龄胶园不同光条带相对光照强度
注:100%参考线表示幼龄胶园平均照度,成龄胶园各条带相对光照强度为成龄胶园各条带平均照度与该参考值的比值。图中数据为平均值±标准误。幼龄胶园各条带未单独展示,仅以平均照度作为参考。
Fig. 3 Relative light intensity in different light strips of the mature rubber plantation
Note: The 100% reference line indicates the mean illuminance of the young rubber plantation. Relative light intensity of each strip in the mature plantation was calculated as the ratio of strip mean illuminance to this reference value. Data are presented as the mean±SE. Light strips of the young plantation are not shown separately; only the mean illuminance was used as a reference.
图 4 不同林龄胶园各条带田菁形态生长及总干质量变化
注:数据均以均值±标准误表示,条带值为模型边际均值,整体平均值为算术均值(n = 12)。下同。
Fig. 4 Changes in morphological growth and total dry mass of S. cannabina in each strip of rubber plantations with different stand ages
Note: Data are all presented as mean±SE; the Strip values are model-based marginal means, and the Overall mean values are arithmetic means (n = 12). Similarly hereinafter.
图 5 不同林龄胶园田菁养分浓度及养分积累量变化
Fig. 5 Changes in nutrient concentrations and nutrient accumulation of Sesbania cannabina in rubber plantations with different stand ages
表 1 幼龄和成龄胶园土壤理化性质比较
Table 1 Comparison of soil physicochemical properties between young and mature rubber plantations
理化性质
Soil property幼龄胶园
Young rubber plantation成龄胶园
Mature rubber plantationpH 5.37±0.06 5.08±0.03 速效钾/(mg·kg−1)
Available potassium140.04±5.48 74.20±2.32 速效磷/(mg·kg−1)
Available phosphorus20.80±2.56 21.76±0.93 全氮/(g·kg−1)
Total nitrogen0.69±0.04 0.48±0.02 有机质/(g·kg−1)
Organic matter17.37±1.12 6.79±0.22 注:表中数据为算术平均值±标准误(n = 12)。 Note: Data are presented as the arithmetic mean±standard error(n = 12).  下载: 导出CSV
表 2 成龄橡胶园不同光条带下田菁氮、磷、钾积累量
Table 2 N, P and K accumulation in S. cannabina under different light strips in the mature rubber plantation
条带
Strip全氮积累量/
(mg·株−1)
Total
nitrogen accumulation全磷积累量/
(mg·株−1)
Total phosphorus accumulation全钾积累量/
(mg·株−1)
Total potassium accumulationⅠ 178.31±25.12ab 25.82±3.08ab 186.18±20.11ab Ⅱ 258.57±25.12a 36.29±3.08a 249.92±20.11a Ⅲ 222.20±25.12ab 32.42±3.08a 248.69±20.11a Ⅳ 147.23±25.12b 18.50±3.08b 139.20±20.11b Ⅴ 40.91±25.12c 4.62±3.08c 40.38±20.11c 注:表中数据为边际均值±标准误(n=12)。不同小写字母表示差异显著(P<0.05)。 Note: Data are presented as estimated marginal means±standard errors(n=12). Different lowercase letters indicate significant differences(P<0.05).
下载: 导出CSV
表 3 照度与成龄胶园田菁生长及养分积累的线性混合模型结果
Table 3 Results of the linear mixed-effects model for the relationships between light intensity and the growth and nutrient accumulation of S. cannabina in the mature rubber plantation
指标
Indicator系数(每 1000 lx)
Coefficient
(per1000 lx)p值
p-value株高/cm
Plant height5.30 <0.001 根长/cm
Root length0.50 <0.001 茎粗/cm
Stem diameter0.02 <0.001 总干质量/
(g·株−1)
Total dry mass0.60 <0.001 全氮积累量/
(mg·株−1)
Total nitrogen
accumulation14.40 <0.001 全磷积累量/
(mg·株−1)
Total phosphorus accumulation2.20 <0.001 全钾积累量/
(mg·株−1)
Total potassium accumulation14.90 <0.001 注:模型中固定效应为照度和品系,随机效应为小区。 Note: The mixed-effects model included illuminance and S. cannabina line as fixed effects and plot as a random effect. Illuminance was expressed in units of 1000 lx.
下载: 导出CSV
表 4 不同林龄胶园田菁品系生长、生物量及养分积累特征
Table 4 Characteristics of growth, biomass and nutrient accumulation of S. cannabina lines in rubber plantations with different stand ages
林龄
Stand age品系
Line株高/cm
Plant height根长/cm
Root
length茎粗/cm
Stem
diameter总干质量/
(g·株−1)
Total dry
mass根冠比
Root/
shoot ratio全氮积累量/
(mg·株−1)
Total
nitrogen
accumulation全磷积累量/
(mg·株−1)
Total
phosphorus
accumulation全钾积累量/
(mg·株−1)
Total
potassium
accumulation幼龄胶园
Young
rubber
plantation6055 170.76±7.42a 15.69±0.54b 0.85±0.04a 31.73±3.43a 0.1077 ±0.006b934.60±116.88a 86.42±12.24a 660.86±77.15a 6070 155.09±7.42ab 15.93±0.54b 0.90±0.04a 18.62±3.43b 0.1460 ±0.006a447.67±116.88b 83.90±12.24a 374.23±77.15b 6113 158.08±7.42ab 18.96±0.54a 0.90±0.04a 28.76±3.43ab 0.1105 ±0.006b984.00±116.88a 93.77±12.24a 675.62±77.15a 8001 136.34±7.42b 18.07±0.54a 0.87±0.04a 31.25±3.43a 0.0805 ±0.006c972.70±116.88a 113.85±12.24a 657.87±77.15a 成龄胶园
Mature
rubber
plantation6055 139.96±7.02a 15.53±0.85a 0.56±0.04ab 9.04±1.22a 0.1634 ±0.013b214.89±22.80ab 27.24±4.14ab 206.54±21.38ab 6070 100.18±7.02b 13.35±0.85a 0.47±0.04b 3.76±1.22b 0.2185 ±0.013a67.89±22.80c 15.01±4.14b 80.80±21.38c 6113 130.10±7.02a 16.12±0.85a 0.65±0.04a 10.24±1.22a 0.1598 ±0.013b249.20±22.80a 32.64±4.14a 270.04±21.38a 8001 102.30±7.02b 14.10±0.85a 0.47±0.04b 6.02±1.22ab 0.1561 ±0.013b145.80±22.80bc 19.23±4.14ab 134.12±21.38bc 注:表中数据为边际均值±标准误(n为每个品系3个小区)。同一林龄内同列不同小写字母表示品系间差异显著(P<0.05)。 Note: Data are presented as estimated marginal means±standard errors(n = 3 plots per line). Within the same stand age, different lowercase letters in the same column indicate significant differences among S. cannabina lines at P<0.05.
下载: 导出CSV
表 5 不同林龄指标熵权权重
Table 5 Entropy weights of indicators in rubber plantations of different stand ages
林龄
Stand age株高/cm
Plant height根长/cm
Root length茎粗/cm
Stem diameter总干质量/
(g·株−1)
Total dry mass全氮积累量/
(mg·株−1)
Total
nitrogen
accumulation全磷积累/
(mg·株−1)
Total
phosphorus
accumulation全钾积累/
(mg·株−1)
Total
potassium
accumulation成龄胶园
Mature rubber plantation0.184 6 0.125 3 0.212 8 0.114 9 0.106 9 0.131 0 0.124 4 幼龄胶园
Young rubber plantation0.118 4 0.205 2 0.125 6 0.107 6 0.105 7 0.232 1 0.105 5 注:权重反映各指标在品系间差异的相对重要性,某一指标权重越大,说明该指标在品系间变异越大,对综合排序的影响越强。 Note: The weights represent the relative importance of each indicator in difference among S. cannabina lines. A higher weight indicates greater variation in the corresponding indicator among the lines and, consequently, a stronger influence on the overall ranking.
下载: 导出CSV
表 6 不同林龄各品系熵权TOPSIS综合得分及排序
Table 6 Entropy-weighted TOPSIS composite scores and rankings of S. cannabina lines intercropped in rubber plantatiions of different stand ages
林龄
Stand age品系
Line综合得分
Composite score排名
Rank成龄胶园
Mature rubber plantation‘6113’ 0.890 1 1 ‘6055’ 0.693 7 2 ‘8001’ 0.204 7 3 ‘6070’ 0.000 0 4 幼龄胶园
Young rubber plantation‘8001’ 0.692 0 1 ‘6113’ 0.657 5 2 ‘6055’ 0.398 3 3 ‘6070’ 0.285 3 4 注:综合得分取值范围为0~1,得分越高表明该品系在所属林龄内综合表现越好。由于2个林龄是分别标准化和赋权,得分仅反映林龄内的相对优劣,不能进行跨林龄直接比较。由于2个林龄仅由单个地块代表,此得分排序仅反映品系在本次供试特定地块中的相对表现。 Note: Composite scores range from 0 to 1, with higher scores indicating better overall performance of a line within the corresponding stand age. Because the two stand ages were standardized and weighted separately, the scores reflect only the relative performance of S. cannabina lines in rubber plfantations within each stand age and should not be directly compared across stand ages. As each stand age was represented by a single plantation plot, these scores and rankings only indicate the relative performance of the lines under the specific conditions of the tested plots.
下载: 导出CSV
-
[1] 刘锐金, 莫业勇, 杨琳, 等. 我国天然橡胶产业战略地位的再认识与发展建议[J]. 中国热带农业, 2022(1): 13−18. https://doi.org/10.3969/j.issn.1673-0658.2022.01.003 doi: 10.3969/j.issn.1673-0658.2022.01.003 [2] 吴敏, 何鹏, 韦家少. 海南岛胶园土壤肥力的综合评价[J]. 中国土壤与肥料, 2009(2): 1−5. https://doi.org/10.3969/j.issn.1673-6257.2009.02.001 doi: 10.3969/j.issn.1673-6257.2009.02.001 [3] Cheng C M, Wang R S, Jiang J S. Variation of soil fertility and carbon sequestration by planting Hevea brasiliensis in Hainan Island, China [J]. Journal of Environmental Sciences, 2007, 19(3): 348−352. https://doi.org/10.1016/S1001-0742(07)60057-6 doi: 10.1016/S1001-0742(07)60057-6 [4] 贺军军, 姚艳丽, 张华林, 等. 胶园覆盖对土壤肥力及橡胶树根系活力的影响[J]. 西南农业学报, 2018, 31(7): 1444−1450. https://doi.org/10.16213/j.cnki.scjas.2018.7.019 doi: 10.16213/j.cnki.scjas.2018.7.019 [5] Hu A, Huang D F, Duan Q W, et al. Cover legumes promote the growth of young rubber trees by increasing organic carbon and organic nitrogen content in the soil [J]. Industrial Crops and Products, 2023, 197: 116640. https://doi.org/10.1016/j.indcrop.2023.116640 doi: 10.1016/j.indcrop.2023.116640 [6] 薛欣欣, 王文斌, 茶正早, 等. 不同绿肥覆盖对幼龄橡胶园土壤团聚体及其有机碳分布的影响[J]. 环境科学, 2025, 46(11): 7013−7021. https://doi.org/10.13227/j.hjkx.202409244 doi: 10.13227/j.hjkx.202409244 [7] 毛小红, 刘蕊, 周国朋, 等. 绿肥驱动作物–土壤–环境系统氮循环的作用与机制[J]. 植物营养与肥料学报, 2026, 32(1): 1−12. https://doi.org/10.11674/zwyf.2025176 doi: 10.11674/zwyf.2025176 [8] 曹卫东, 周国朋, 高嵩涓. 绿肥内源驱动土壤健康的作用与机制[J]. 植物营养与肥料学报, 2024, 30(7): 1274−1283. https://doi.org/10.11674/zwyf.2024269 doi: 10.11674/zwyf.2024269 [9] Gou X M, Reich P B, Qiu L P, et al. Leguminous plants significantly increase soil nitrogen cycling across global climates and ecosystem types [J]. Global Change Biology, 2023, 29(14): 4028−4043. https://doi.org/10.1111/gcb.16742 doi: 10.1111/gcb.16742 [10] 刘强. 田菁的生物学特征特性及采种技术[J]. 河南农业, 2022(22): 14. https://doi.org/10.15904/j.cnki.hnny.2022.22.007 doi: 10.15904/j.cnki.hnny.2022.22.007 [11] 秦俊豪, 温莹, 李君菲, 等. 绿肥植物田菁的化感效应及对土壤肥力的影响[J]. 土壤, 2015, 47(3): 524−529. https://doi.org/10.13758/j.cnki.tr.2015.03.015 doi: 10.13758/j.cnki.tr.2015.03.015 [12] 朱小梅, 王甫同, 邢锦城, 等. 田菁翻压还田对滩涂土壤碳氮及微生物生物量的影响[J]. 土壤, 2021, 53(3): 529−536. https://doi.org/10.13758/j.cnki.tr.2021.03.012 doi: 10.13758/j.cnki.tr.2021.03.012 [13] 饶之杰, 薛欣欣, 王文斌, 等. 幼龄橡胶园不同绿肥原位还田腐解特征及养分释放规律[J]. 热带作物学报, 2025, 46(10): 2410−2421. https://doi.org/10.3969/j.issn.1000-2561.2025.10.012 doi: 10.3969/j.issn.1000-2561.2025.10.012 [14] 赵娜, 赵护兵, 鱼昌为, 等. 旱地豆科绿肥腐解及养分释放动态研究[J]. 植物营养与肥料学报, 2011, 17(5): 1179−1187. https://doi.org/10.11674/zwyf.2011.0205 doi: 10.11674/zwyf.2011.0205 [15] Angadi S V, Umesh M R, Begna S, et al. Light interception, agronomic performance, and nutritive quality of annual forage legumes as affected by shade [J]. Field Crops Research, 2022, 275: 108358. https://doi.org/10.1016/j.fcr.2021.108358 doi: 10.1016/j.fcr.2021.108358 [16] Xue G Y, Wu J D, Zhou B J, et al. Effects of shading on the growth and photosynthetic fluorescence characteristics of Castanopsis hystrix seedlings of top community-building species in southern subtropical China [J]. Forests, 2023, 14(8): 1659. https://doi.org/10.3390/f14081659 doi: 10.3390/f14081659 [17] Xu W X, Yang Q, Jiang Y M, et al. Improving soil pH, nutrient concentrations, and enzyme activities by green manure returning in young and mature rubber plantation on Hainan Island, China [J]. Plant and Soil, 2024, 495(1/2): 341−358. https://doi.org/10.1007/s11104-023-06327-6 doi: 10.1007/s11104-023-06327-6 [18] 徐文娴, 李金秋, 孟磊, 等. 葛藤覆盖对幼龄橡胶园表层土壤理化性状和酶活性的影响[J]. 植物营养与肥料学报, 2020, 26(9): 1740−1748. https://doi.org/10.11674/zwyf.20023 doi: 10.11674/zwyf.20023 [19] 袁淑娜, 黄坚雄, 潘剑, 等. 全周期胶园温光特性及其林下间作作物产量表现[J]. 广东农业科学, 2018, 45(1): 9−15. https://doi.org/10.16768/j.issn.1004-874X.2018.01.002 doi: 10.16768/j.issn.1004-874X.2018.01.002 [20] 鲁如坤. 土壤农业化学分析方法[M]. 北京: 中国农业科技出版社, 2000: 308. [21] Ballaré C L, Pierik R. The shade-avoidance syndrome: multiple signals and ecological consequences [J]. Plant, Cell & Environment, 2017, 40(11): 2530−2543. https://doi.org/10.1111/pce.12914 doi: 10.1111/pce.12914 [22] Poorter H, Niklas K J, Reich P B, et al. Biomass allocation to leaves, stems and roots: meta-analyses of interspecific variation and environmental control [J]. New Phytologist, 2012, 193(1): 30−50. https://doi.org/10.1111/j.1469-8137.2011.03952.x doi: 10.1111/j.1469-8137.2011.03952.x [23] Friel C A, Friesen M L. Legumes modulate allocation to rhizobial nitrogen fixation in response to factorial light and nitrogen manipulation [J]. Frontiers in Plant Science, 2019, 10: 1316. https://doi.org/10.3389/fpls.2019.01316 doi: 10.3389/fpls.2019.01316 [24] Xu G H, Fan X R, Miller A J. Plant nitrogen assimilation and use efficiency [J]. Annual Review of Plant Biology, 2012, 63: 153−182. https://doi.org/10.1146/annurev-arplant-042811-105532 doi: 10.1146/annurev-arplant-042811-105532 [25] Jarrell W M, Beverly R B. The dilution effect in plant nutrition studies [J]. Advances in Agronomy, 1981, 34: 197−224. https://doi.org/10.1016/S0065-2113(08)60887-1 doi: 10.1016/S0065-2113(08)60887-1 [26] 杨春霞, 赵志平, 杨丽萍, 等. 不同覆盖绿肥养分特性及其对橡胶园土壤理化性质的影响[J]. 植物营养与肥料学报, 2012, 18(2): 467−474. https://doi.org/10.11674/zwyf.2012.11219 doi: 10.11674/zwyf.2012.11219 [27] 张婧旻, 李彩兰, 薛欣欣, 等. 豆科绿肥对幼龄胶园土壤养分及叶片氮含量的影响及作用路径分析[J]. 热带作物学报, 2025, 46(6): 1354−1362. https://doi.org/10.3969/j.issn.1000-2561.2025.06.008 doi: 10.3969/j.issn.1000-2561.2025.06.008 [28] 赵志平, 许木果, 刘忠妹, 等. 胶园8种豆科覆盖绿肥的耐荫性研究[J]. 热带农业科技, 2020, 43(1): 10−13, 23. https://doi.org/10.16005/j.cnki.tast.20191223.003 doi: 10.16005/j.cnki.tast.20191223.003 [29] 陈明惠, 原慧芳, 李金威, 等. 山地胶园间作5种豆科绿肥的综合评价[J]. 热带农业科技, 2026, 49(1): 108−113. https://doi.org/10.16005/j.cnki.tast.20250514 doi: 10.16005/j.cnki.tast.20250514 [30] Huang J X, Pan J, Zhou L J, et al. An improved double-row rubber (Hevea brasiliensis) plantation system increases land use efficiency by allowing intercropping with yam bean, common bean, soybean, peanut, and coffee: a 17-year case study on Hainan Island, China [J]. Journal of Cleaner Production, 2020, 263: 121493. https://doi.org/10.1016/j.jclepro.2020.121493 doi: 10.1016/j.jclepro.2020.121493 [31] Senevirathna A M W K, Stirling C M, Rodrigo V H L. Growth, photosynthetic performance and shade adaptation of rubber (Hevea brasiliensis) grown in natural shade [J]. Tree Physiology, 2003, 23(10): 705−712. https://doi.org/10.1093/treephys/23.10.705 doi: 10.1093/treephys/23.10.705 [32] 黄坚雄, 潘剑, 周立军, 等. 光照亏缺对橡胶–作物农林复合系统中作物生产力的影响[J]. 中国生态农业学报(中英文), 2020, 28(5): 680−689. https://doi.org/10.13930/j.cnki.cjea.190858 doi: 10.13930/j.cnki.cjea.190858 [33] Hinsinger P. Bioavailability of soil inorganic P in the rhizosphere as affected by root-induced chemical changes: a review [J]. Plant and Soil, 2001, 237(2): 173−195. https://doi.org/10.1023/A:1013351617532 doi: 10.1023/A:1013351617532 [34] Wu J N, Zeng H H, Zhao F, et al. The nutrient status of plant roots reveals competition intensities in rubber agroforestry systems [J]. Forests, 2020, 11(11): 1163. https://doi.org/10.3390/f11111163 doi: 10.3390/f11111163 [35] Baldocchi D, Collineau S. The physical nature of solar radiation in heterogeneous canopies: spatial and temporal attributes[M]//Caldwell M M, Pearcy R W. Exploitation of environmental heterogeneity by plants. San Diego: Academic Press, 1994: 21−71. https://doi.org/10.1016/B978-0-12-155070-7.50007-X [36] 王祥军, 黄肖, 张源源, 等. 不同品系胶园林下光照条件差异及其成因[J]. 热带作物学报, 2025, 46(12): 2910−2921. https://doi.org/10.3969/j.issn.1000-2561.2025.12.009 doi: 10.3969/j.issn.1000-2561.2025.12.009 [37] Wu J N, Liu W J, Chen C F. Below-ground interspecific competition for water in a rubber agroforestry system May enhance water utilization in plants [J]. Scientific Reports, 2016, 6: 19502. https://doi.org/10.1038/srep19502 doi: 10.1038/srep19502 [38] Shen L, Wang X Y, Liu T T, et al. Border row effects on the distribution of root and soil resources in maize–soybean strip intercropping systems [J]. Soil and Tillage Research, 2023, 233: 105812. https://doi.org/10.1016/j.still.2023.105812 doi: 10.1016/j.still.2023.105812 -

 点击查看大图
计量
- 文章访问数: 6
- HTML全文浏览量: 6
- 被引次数: 0
