

-
大豆原产于中国,是一种重要的油料、粮食和饲料作物[1 −2]。大豆富含优质蛋白、脂肪、维生素E及卵磷脂等多种生物活性物质,在农业结构中占据重要地位用[3]。当前,我国大豆自给率不足,对外依存度高,且进口来源存在结构性风险,主要集中于巴西(60.59%)、美国(22.05%)和阿根廷(7.40%)[4]。面对日益加剧的国际贸易不确定性,亟需通过科技手段提高单产,以保障国内供给安全[5]。
在作物栽培实践中,合理密植是一项重要的农艺措施。单位面积上的作物产量,实质上可表述为单株产量与株数的乘积,因此种植密度直接决定了群体的产量形成。在影响大豆产量的诸多农艺因素中,种植密度具有重要调控作用[6−7]。研究表明,百粒重、单株粒数及单株质量对产量形成均呈显著正效应,株高对产量的直接影响相对有限[8−9]。然而,由于品种特性、土壤肥力、生育期和分枝能力等差异,不同基因型大豆的适宜种植密度往往难以统一确定。为加速大豆育种进程,“南繁育种”已成为关键手段之一。利用海南优越的光热资源,可实现育种材料加代与种质扩繁,为密度适应性研究及高产型品种选育提供了良好平台[10]。在此背景下,系统评价不同品种大豆在海南生态条件下的密度响应,对建立适宜群体构建策略具有重要意义。当前研究存在明显局限,区域适配性不足,缺乏针对海南南繁特殊光热环境的研究。
为此,本研究设计多密度梯度40万株·hm−2(D1)、60万株·hm−2(D2)、80万株·hm−2(D3)、100万株·hm−2(D4)试验,同步分析农艺性状(株高、荚数、粒数、节数)、产量构成及品质指标(蛋白、油脂组分),重点解析不同品种在海南生态条件下的密度响应机制,旨在明确南繁条件下实现大豆高产优质的栽培生理机制,以期为海南大豆的高产栽培实践提供理论指导,为合理密植方案的优化提供科学依据。
-
试验共选用10个大豆品种,均来源于农业农村部办公厅《2024年农业主导品种推介目录》,并由对应育种单位提供原种。品种包括:‘绥农52’(‘SN52’)、‘蒙豆1137’(‘MD1137’)、‘铁豆67’(‘TD67’)、‘黑农84’(‘HN84’)、‘黑农531’(‘HN531’)、‘黑河43’(‘HH43’)、‘油6019’(‘Y6019’)、‘中黄901’(‘ZH901’)、‘齐黄34’(‘QH34’)和‘南农47’(‘NN47’),各品种的特征及来源详见表1。这些品种覆盖早熟(≤105 d)、中熟(106~120 d)和晚熟(≥121 d)三种生育期类型,品质类型涵盖高蛋白(≥45%)、高油(≥22%)及双高型,形态特征包括圆叶/尖叶叶形与白花/紫花花色。所有种子发芽率不低于95%,纯度不低于98%,为系统解析品种-密度-环境互作效应提供了遗传多样且质量统一的试验材料基础。
品种
Variety株高/cm
Plant height/cm叶形
Leaf shape结荚习性
Podding habit熟期
Maturity栽培区域
Cultivating region来源
Origin‘绥农52’
‘Suinong 52’90 披针形叶
Lanceolate无限结荚
Indeterminate中熟
Medium-Maturing北方春大豆
Northern China Spring Soybean飞龙种业公司
Feilong Seed Co., Ltd.‘中黄901’
‘Zhong huang 901’92 披针形叶
Lanceolate亚有限结荚
Sub-indeterminate早熟
Early-Maturing北方春大豆
Northern China Spring Soybean中国农业科学院油料作物研究所
Oil Crops Research Institute, Chinese Academy of Agricultural Sciences‘黑农84’
‘Hei nong 84’100 披针形叶
Lanceolate亚有限结荚
Sub-indeterminate中熟
Medium-Maturing北方春大豆
Northern China Spring Soybean黑龙江省农业科学院
Heilongjiang Academy of Agricultural Sciences‘黑农531’
‘Hei nong 531’85 披针形叶
Lanceolate无限结荚
Indeterminate中熟
Medium-Maturing北方春大豆
Northern China Spring Soybean黑龙江省农业科学院
Heilongjiang Academy of Agricultural Sciences‘蒙豆 1137 ’
‘Meng dou1137 ’73 披针形叶
Lanceolate亚有限结荚
Sub-indeterminate中熟
Medium-Maturing北方春大豆
Northern China Spring Soybean呼伦贝尔市农牧科学研究所
Hulunbuir Academy of Agriculture and Animal Husbandry Sciences‘黑河43’
‘Hei he 43’75 披针形叶
Lanceolate亚有限结荚
Sub-indeterminate早熟
Early-Maturing北方春大豆
Northern China Spring Soybean‘南农47’
‘Nan nong 47’74.3 卵圆形叶
Ovate有限结荚
Determinate中熟
Medium-Maturing黄淮海夏大豆
Huang-Huai-Hai Summer Soybean国家大豆改良中心
National Center for Soybean Improvement‘齐黄34’
‘Qi huang 34’47.2 卵圆形叶
Ovate有限结荚
Determinate早熟
Early-Maturing黄淮海夏大豆
Huang-Huai-Hai Summer Soybean清原种子科学有限公司
Qingyuan Seed Science Co., Ltd.‘铁豆67’
‘Tie dou 67’109 椭圆形叶
Oval亚有限结荚
Sub-indeterminate晚熟
Late-Maturing北方春大豆
Northern China Spring Soybean铁岭市农业科学院
Tieling Academy of Agricultural Sciences‘油 6019 ’
‘You6019 ’65.1 椭圆形叶
Oval有限结荚
Determinate早熟
Early-Maturing长江流域夏大豆
Yangtze River Basin Summer Soybean中国农业科学院油料作物研究所
Oil Crops Research Institute, Chinese Academy of Agricultural SciencesTable 1. Soybean varieties (lines)used in this experiment
-
试验于2025年春季在海南省儋州市王五镇(19°36′N,109°18′E)进行。试验地属于热带湿润季风气候,土壤质地为黏壤土。0~20 cm土壤耕作层pH5.7,总氮4.20×10² mg·kg−1,钾0.72%,硒0.073 3 mg·kg−1,有效硫21.52 mg·kg−1,有效硼0.20 mg·kg−1,有效锰6.31 mg·kg−1,有机质8.27 g·kg−1。
-
本研究选用10个大豆品种,包括试验采用双因素裂区设计,以品种为主区,密度为副区。于2025年设置4个种植密度,分别为40万株·hm−2(D1)、60万株·hm−2(D2)、80万株·hm−2(D3)和100万株·hm−2(D4)(分别以D1–D4指代)。每个处理设3次重复,小区面积为24 m2(垄宽2 m,垄长4 m),连续种植3垄。田间管理按常规进行。田间管理按常规进行。所有品种均于2月下旬统一播种。
-
依据 Fehr 等[11]对大豆生育时期的规定,判断大豆始花期和成熟期,记录相应的日期。
-
采用Li-6800便携式光合作用测定仪测定叶片净光合速率(Pn)和胞间CO2浓度(Ci),并使用便携式叶绿素仪测定SPAD值。
-
大豆成熟后从每小区连续取样10株,考察株高、和主茎节数等形态指标,一粒荚数、二粒荚数、三粒荚数、四粒荚数、有效荚数、单株粒数、百粒重等产量指标。按品种和小区进行全区收获,分别脱粒、晾晒,待籽粒含水量降至13%以下后测定产量,并测定籽粒蛋白质与脂肪含量。
-
采用Excel 2013进行数据录入与整理,并使用SPSS 22.0软件进行统计分析,使用Origin2024进行制图。
-
由表2可知,种植密度的改变对同一品种的生育期无显著影响,但品种间生育期差异明显。‘SN52’、‘MD1137’、‘HH42’全生育期最短;‘QH34’生育期最长;‘NN47’的营养生长占整个生育期的比例最高;‘HH43’的生殖生长占整个生育期的比例最高。同一品种在不同种植密度下,其营养生长期、生殖生长期及全生育期保持高度稳定,表明各生长阶段(营养生长、生殖生长及生育期)的历时受遗传背景主导,受密度调控的影响较小。
品种
Variety密度
Density出苗
BD始花
MD始荚
FP成熟
DSE营养生长
VG生殖生长
RG全生育期
DEM‘SN52’ D1 02/28 03/25 04/08 06/08 25±0.00 75±0.00 100±0.00 D2 02/28 03/25 04/08 06/08 25±0.00 75±0.00 100±0.00 D3 02/28 03/25 04/08 06/08 25±0.00 75±0.00 100±0.00 D4 02/28 03/25 04/08 06/08 25±0.00 75±0.00 100±0.00 ‘ZH901’ D1 02/28 03/23 04/05 06/09 23±0.00 78±0.00 101±0.00 D2 02/28 03/23 04/05 06/09 23±0.00 78±0.00 101±0.00 D3 02/28 03/23 04/05 06/09 23±0.00 78±0.00 101±0.00 D4 02/28 03/23 04/05 06/09 23±0.00 78±0.00 101±0.00 ‘NN47’ D1 02/28 04/07 04/17 06/09 38±0.00 63±0.00 101±0.00 D2 02/28 04/07 04/17 06/09 38±0.00 63±0.00 101±0.00 D3 02/28 04/07 04/17 06/09 38±0.00 63±0.00 101±0.00 D4 02/28 04/07 04/17 06/09 38±0.00 63±0.00 101±0.00 ‘HN84’ D1 02/28 03/29 04/14 06/10 29±0.00 73±0.00 102±0.00 D2 02/28 03/29 04/14 06/10 29±0.00 73±0.00 102±0.00 D3 02/28 03/29 04/14 06/10 29±0.00 73±0.00 102±0.00 D4 02/28 03/29 04/14 06/10 29±0.00 73±0.00 102±0.00 ‘HN531’ D1 02/28 03/26 04/10 06/13 26±0.00 79±0.00 105±0.00 D2 02/28 03/26 04/10 06/13 26±0.00 79±0.00 105±0.00 D3 02/28 03/26 04/10 06/13 26±0.00 79±0.00 105±0.00 D4 02/28 03/26 04/10 06/13 26±0.00 79±0.00 105±0.00 ‘TD67’ D1 02/28 03/30 04/15 06/09 30±0.00 71±0.00 101±0.00 D2 02/28 03/30 04/15 06/09 30±0.00 71±0.00 101±0.00 D3 02/28 03/30 04/15 06/09 30±0.00 71±0.00 101±0.00 D4 02/28 03/30 04/15 06/09 30±0.00 71±0.00 101±0.00 ‘MD1137’ D1 02/28 03/25 04/05 06/08 25±0.00 75±0.00 100±0.00 D2 02/28 03/25 04/05 06/08 25±0.00 75±0.00 100±0.00 D3 02/28 03/25 04/05 06/08 25±0.00 75±0.00 100±0.00 D4 02/28 03/25 04/05 06/08 25±0.00 75±0.00 100±0.00 ‘QH34’ D1 02/28 04/04 04/14 06/19 35±0.00 76±0.00 111±0.00 D2 02/28 04/04 04/14 06/19 35±0.00 76±0.00 111±0.00 D3 02/28 04/04 04/14 06/19 35±0.00 76±0.00 111±0.00 D4 02/28 04/04 04/14 06/19 35±0.00 76±0.00 111±0.00 ‘HH43’ D1 02/28 03/22 04/07 06/08 22±0.00 78±0.00 100±0.00 D2 02/28 03/22 04/07 06/08 22±0.00 78±0.00 100±0.00 D3 02/28 03/22 04/07 06/08 22±0.00 78±0.00 100±0.00 D4 02/28 03/22 04-07 06/08 22±0.00 78±0.00 100±0.00 ‘Y6019’ D1 02/28 04/09 04/18 06/16 40±0.00 68±0.00 108±0.00 D2 02/28 04/09 04/18 06/16 40±0.00 68±0.00 108±0.00 D3 02/28 04/09 04/18 06/16 40±0.00 68±0.00 108±0.00 D4 02/28 04/09 04/18 06/16 40±0.00 68±0.00 108±0.00 注:D1:40万株·hm-²、D2:60万株·hm−2、D3:80万株·hm−2、D4:100万株·hm−2。 Note: Density(D): D1: 400,000 plants/hm−2; D2: 600,000 plants/hm−2; D3: 800,000 plants/hm−2; D4: 1,000,000 plants/hm−2. Table 2. The effects of different planting densities on each growth stage of soybean
/d -
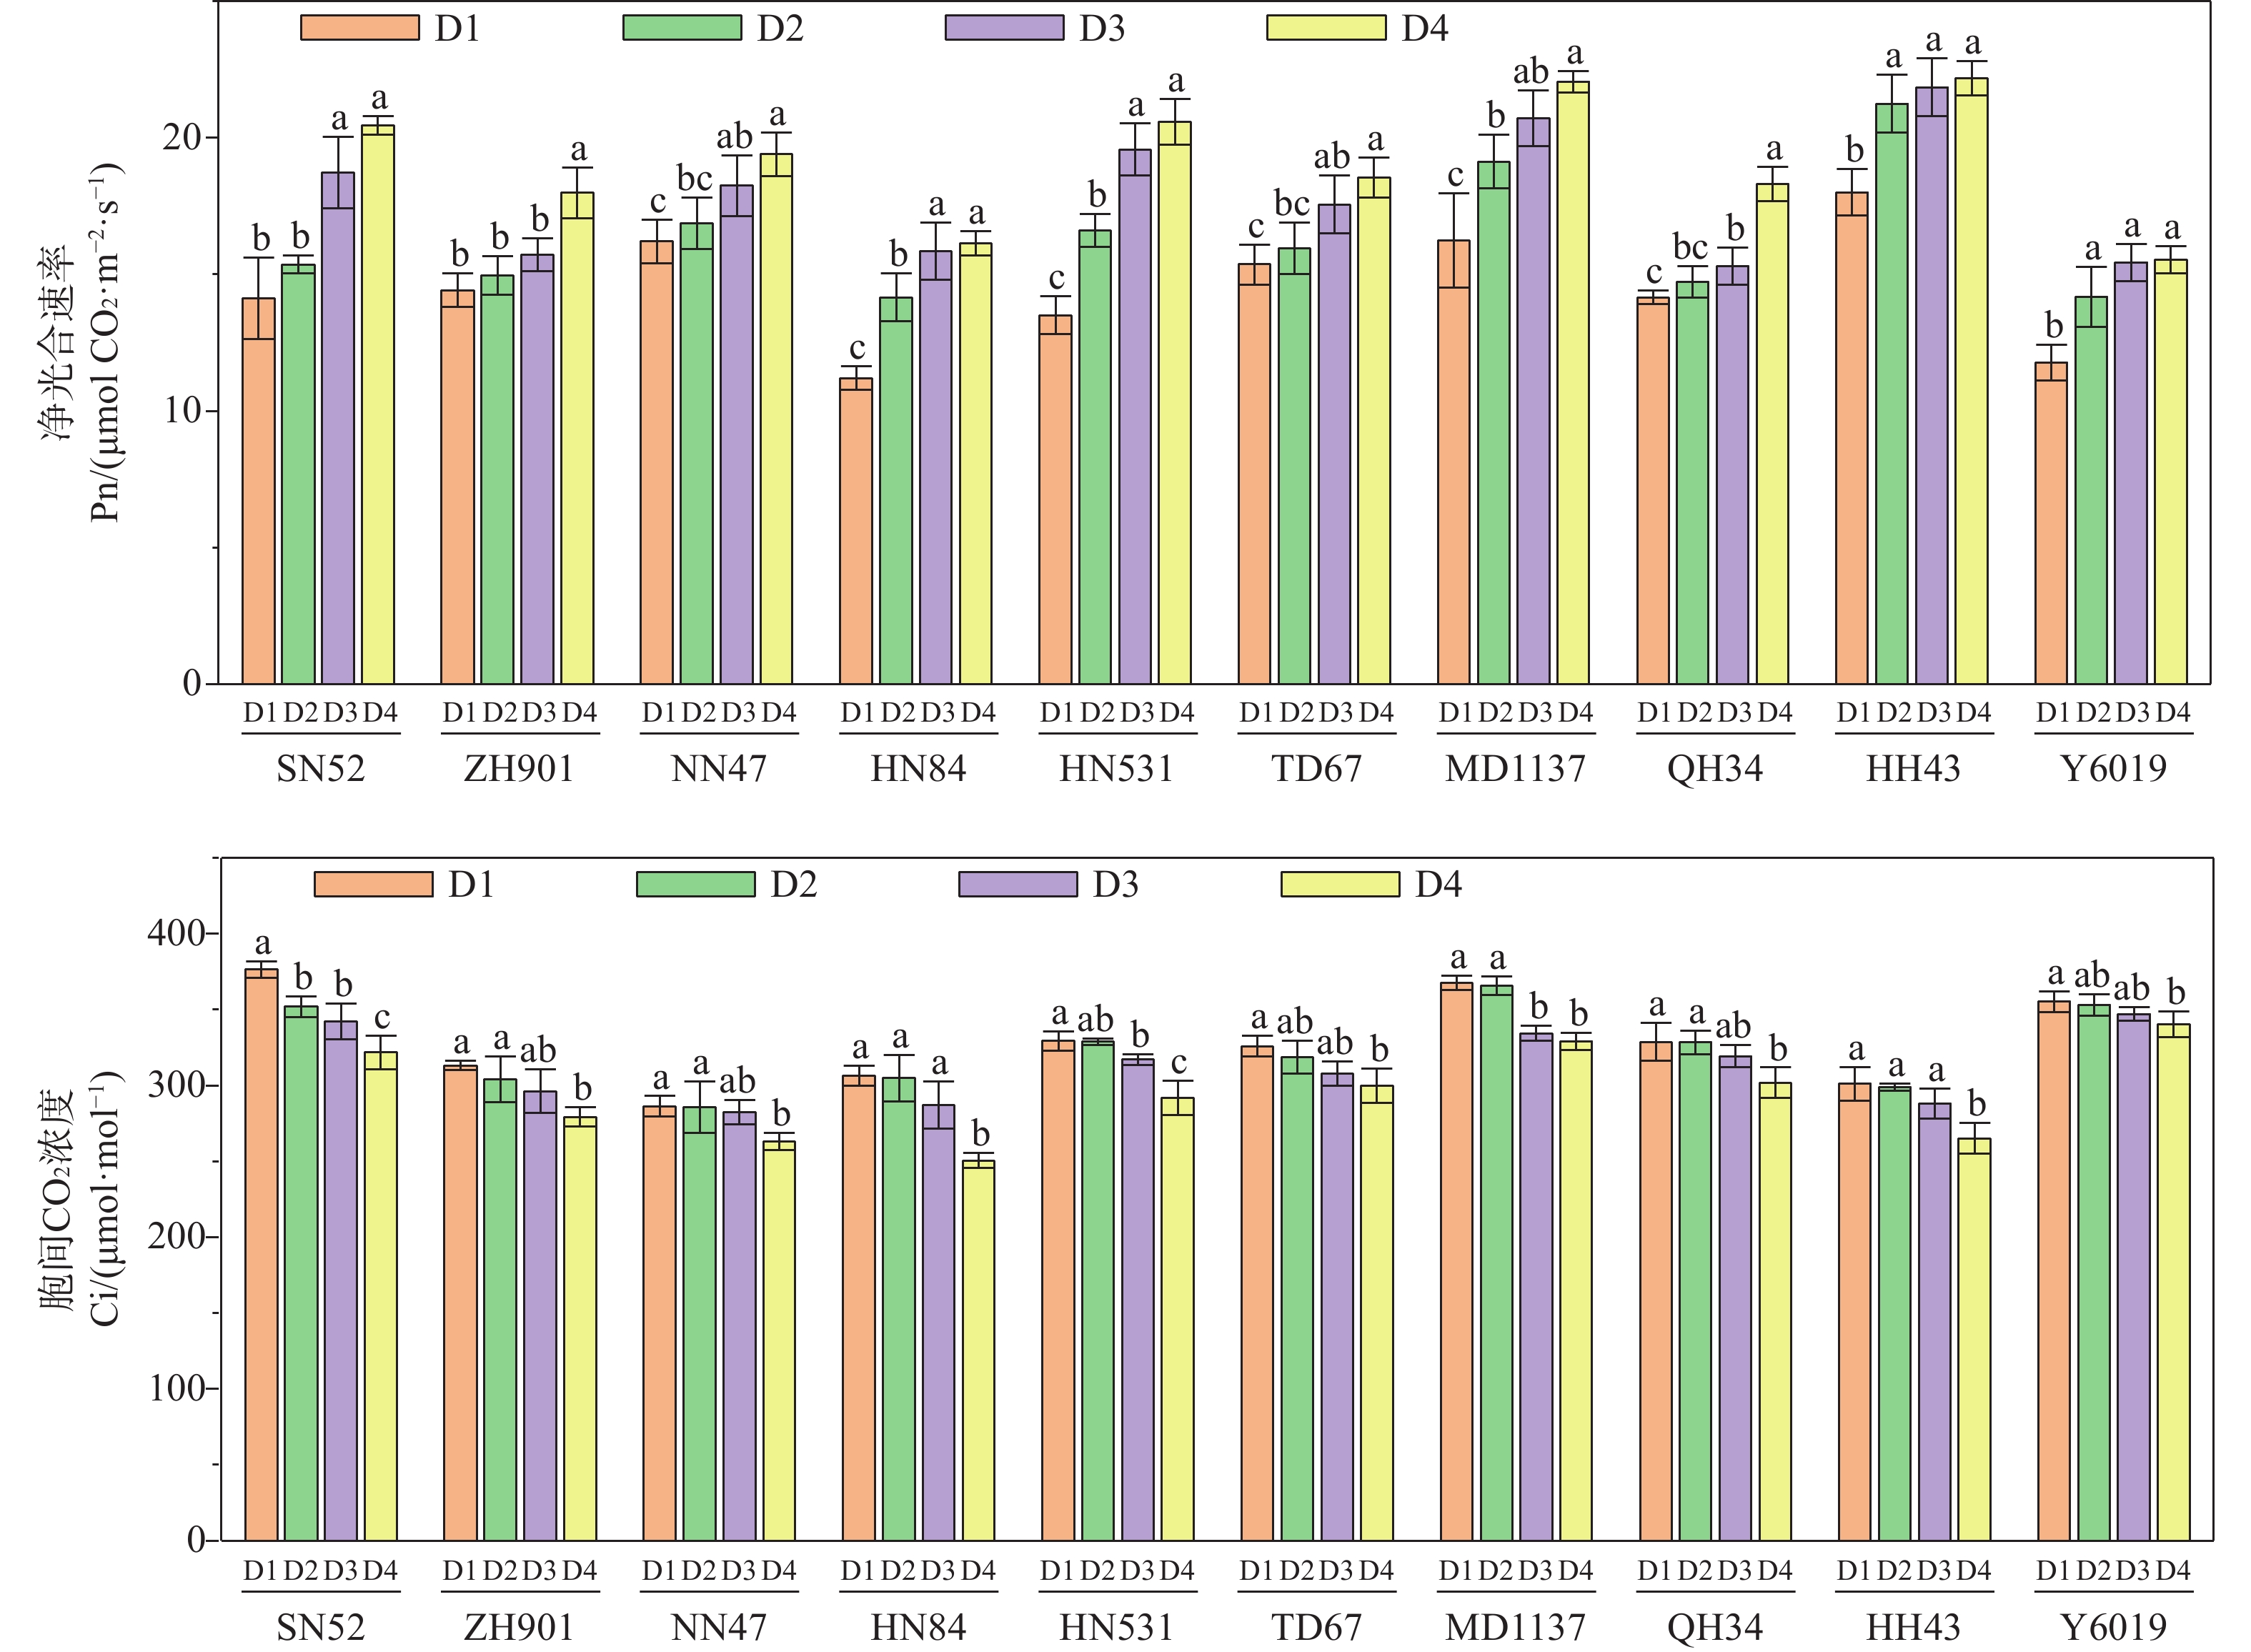
如图1所示,随着种植密度的增加,Pn呈逐步上升趋势,具体表现为D4> D3> D2> D1,Ci呈逐步下降趋势,具体表现为D1> D2> D3> D4。品种‘HN531’的Pn整体增幅最大,从13.5上升到20.58(增幅52.42%),品种‘NN47’的Pn整体增幅最小,从16.21上升到19.39(增幅19.66%);相邻密度之间Pn增幅最大的是‘HN84’的D1到D2 ,增幅26.44%,增幅最小的是‘Y6019’的D3到D4之间,增幅为0.67%。‘HN84’的Ci整体降幅最大,从306.40下降到250.53(降幅18.23%),‘Y6019’的Ci整体降幅最小,从355.20下降到340.43(降幅4.16%),相邻密度之间Ci增幅最大的是‘HN84’的D3到D4,降幅12.72%;降幅最小的是‘QH34’的D1到D2,降幅为0.17%。
Figure 1. Effect of different planting densities on the photosynthetic rate of soybeans
-
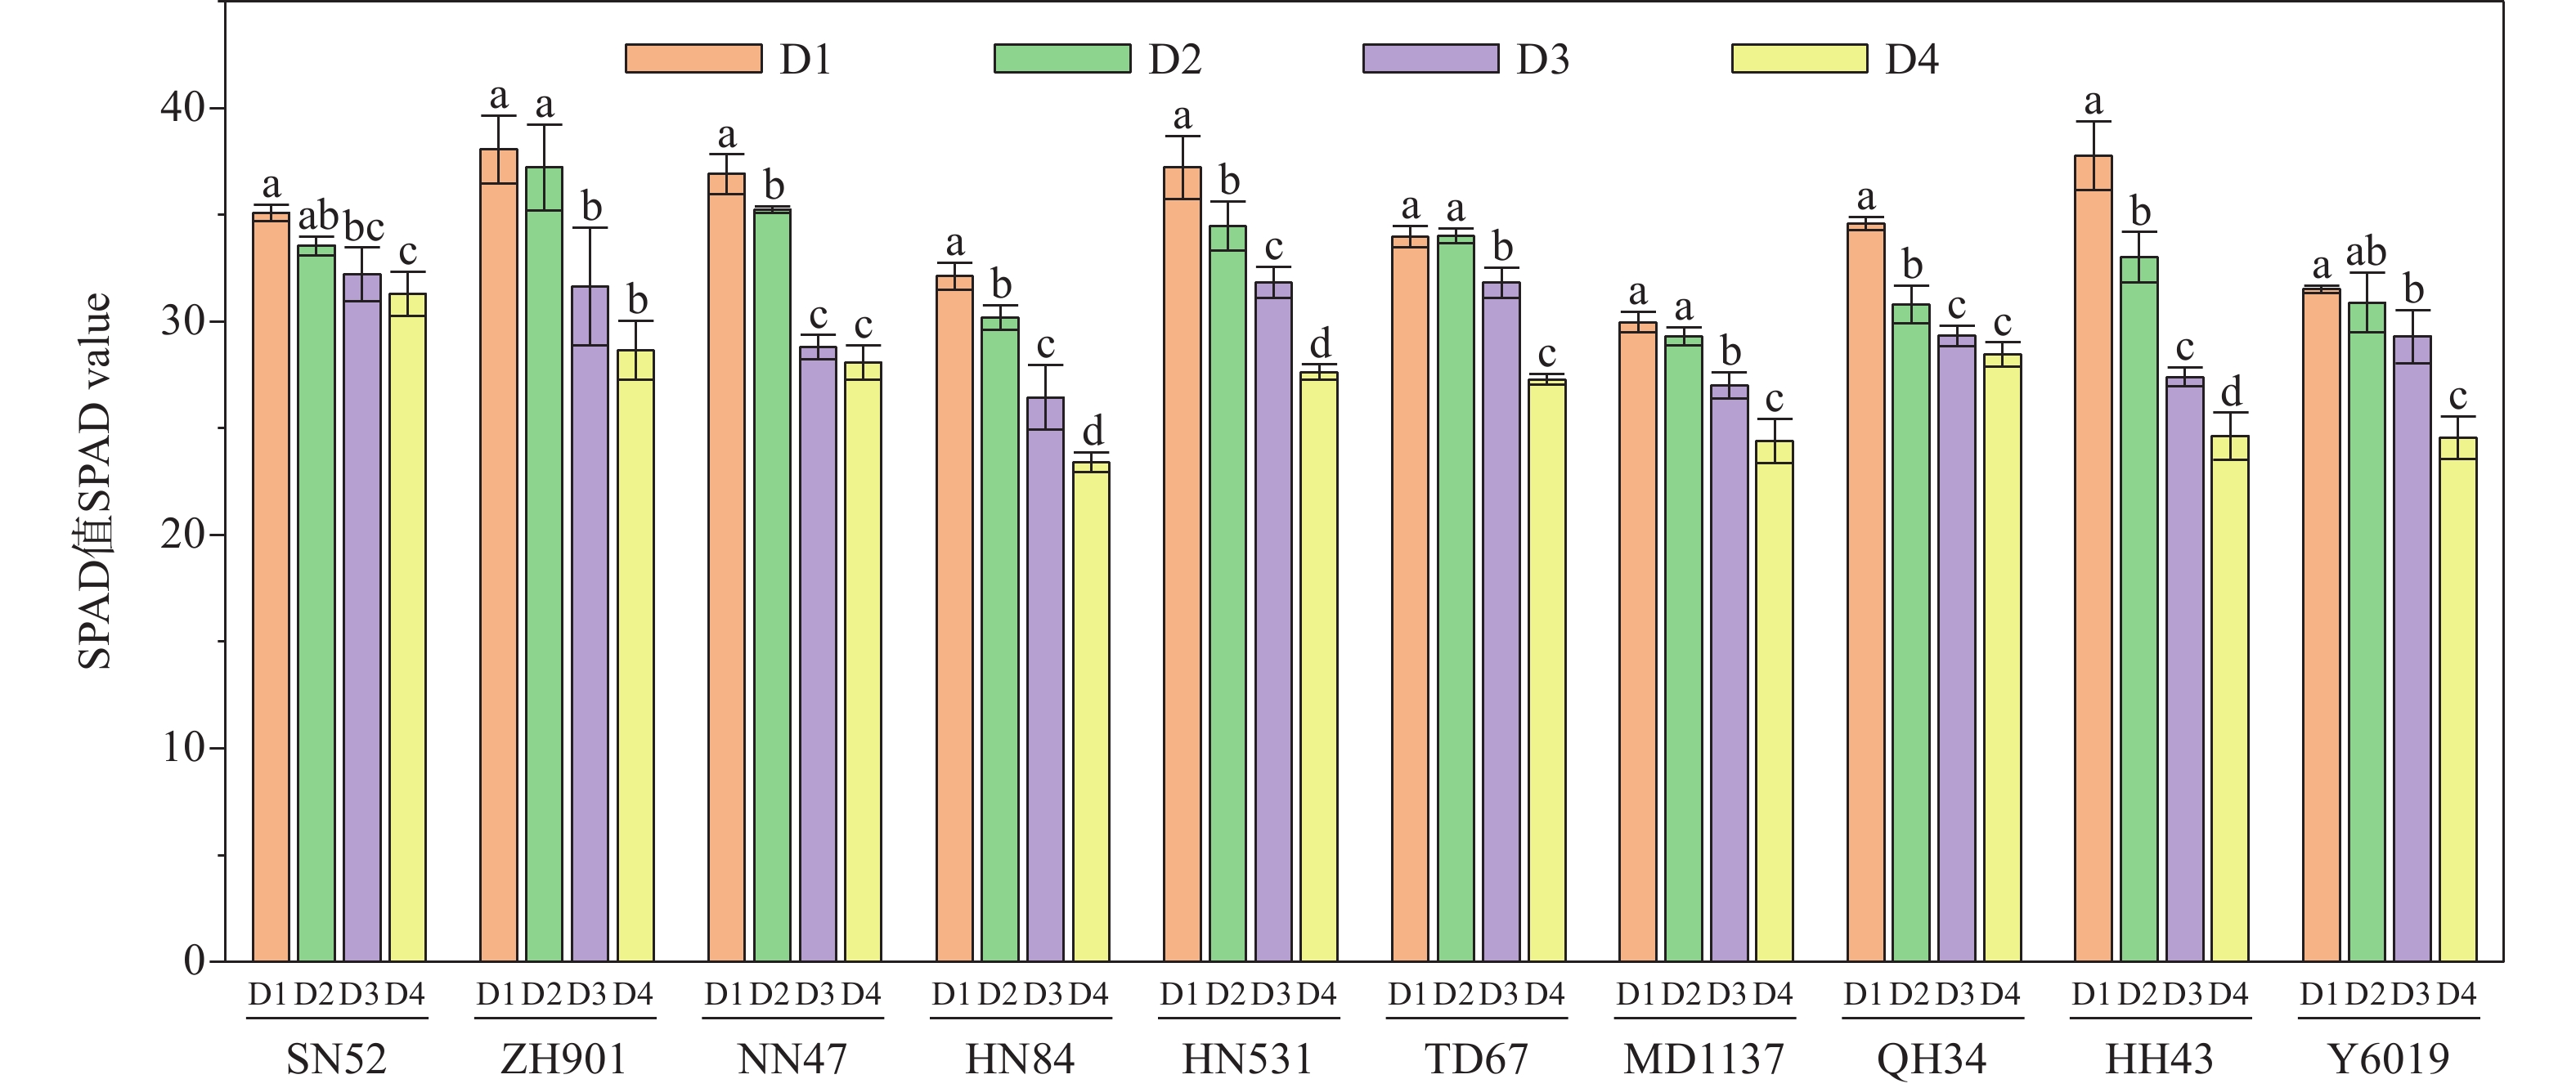
如图2所示,随着种植密度的增加,SPAD值呈逐步下降趋势,具体表现为D1> D2> D3> D4,‘HH43’密度D2~D3和‘NN47’密度D2~D3的SPAD值降幅最大,分别降低了16.97%和15.05%。从D1~D4整体来看,‘Y6019’的SPAD值降幅最大,降低了34.82%,‘SN52’的SPAD值不同密度下表现最为稳定,降低10.81%。
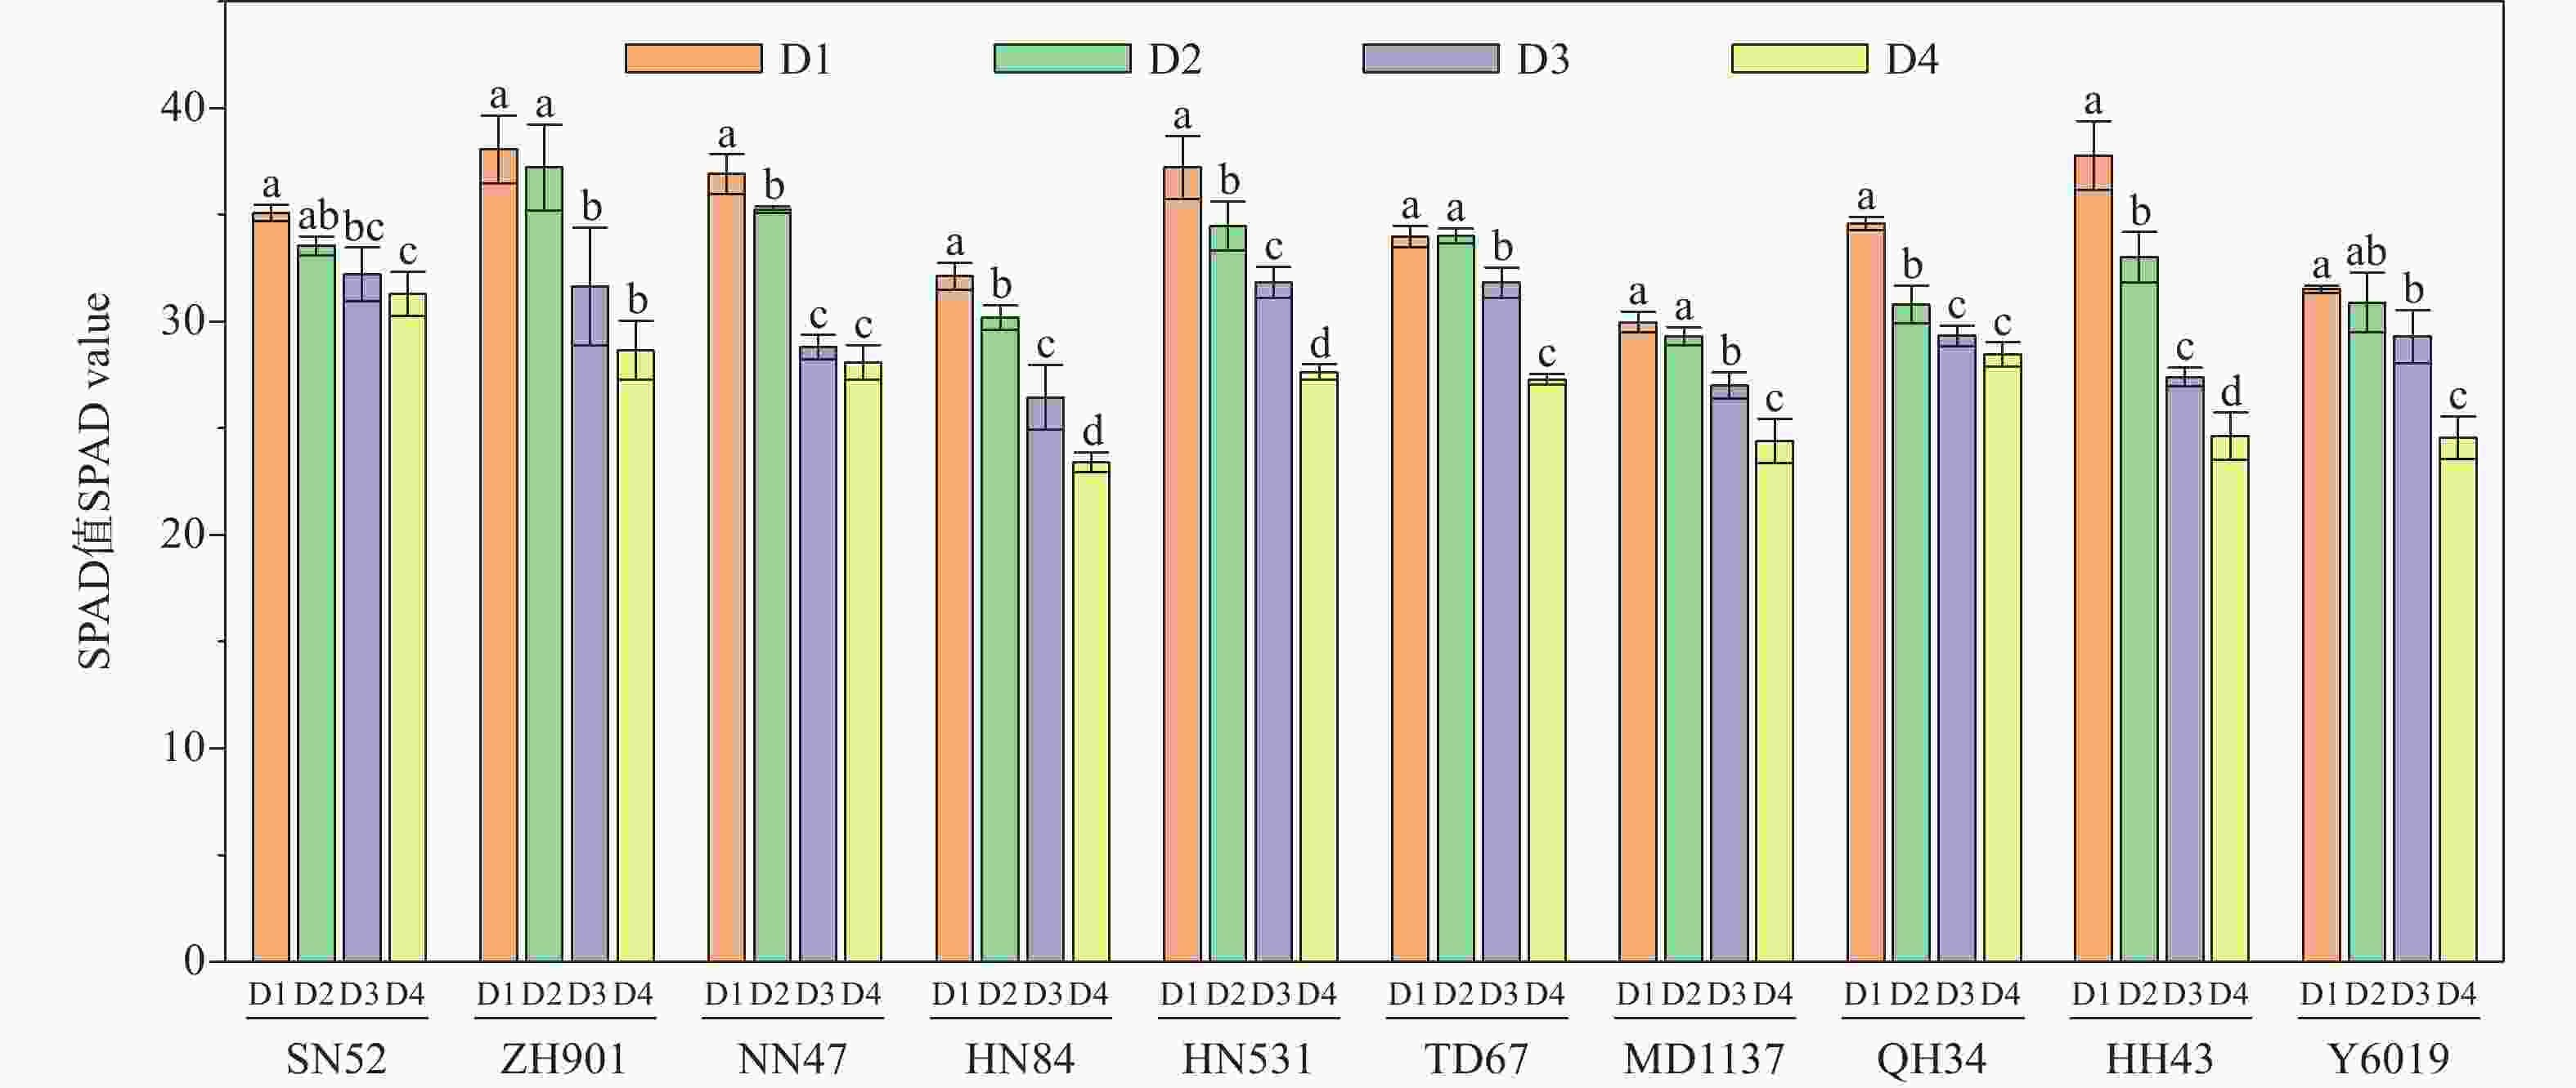
Figure 2. Effects of planting density on SPAD value in soybeans
-
如表3所示,随着种植密度的增加,蛋白质含量表现为下降趋势或先上升后下降趋势,脂肪含量表现为下降趋势。蛋白质含量最大值分布在密度D1、D2和D3,其中‘SN52’、‘HN531’、‘MD1137’、‘QH34’和‘Y6019’在密度D1时,‘NN47’、‘TD67’和‘HH43’在密度D2时,‘ZH901’和‘HN84’在密度D3时蛋白质含量最高。脂肪含量最大值集中在密度D1。
品种
Cultivar密度
Density蛋白含量(%)
PC(%)脂肪(%)
FC(%)‘SN52’ D1 45.10±0.5 a 26.80±0.95a D2 44.63±0.42ab 25.90±0.79ab D3 44.30±0.44ab 25.30±0.70ab D4 44.10±0.17b 25.00±0.89b ‘ZH901’ D1 43.20±0.10b 27.10±0.53a D2 44.00±0.26ab 26.50±0.44ab D3 44.40±0.69a 26.10±0.53ab D4 43.20±0.40b 25.80±0.52b ‘NN47’ D1 45.30±0.62ab 25.00±0.36a D2 45.50±0.26a 24.83±0.12b D3 45.10±0.17ab 24.67±0.15ab D4 44.50±0.56b 24.37±0.15b ‘HN84’ D1 42.93±0.06b 27.70±0.36a D2 43.20±0.66b 26.40±0.44b D3 44.43±0.72a 25.80±0.46b D4 43.33±0.25b 25.90±0.36b ‘HN531’ D1 42.60±1.04a 28.70±0.46a D2 42.10±1.22ab 27.20±0.53b D3 41.80±1.04ab 26.30±0.46c D4 39.80±1.35b 25.63±0.23c ‘TD67’ D1 43.30±1.04ab 26.20±0.36a D2 45.40±1.31a 25.70±0.40ab D3 43.40±1.23ab 25.40±0.46ab D4 42.70±1.08b 25.30±0.36b ‘MD1137’ D1 44.10±1.01a 28.13±0.68a D2 43.40±0.61a 27.20±0.36b D3 42.70±0.61a 27.10±0.36b D4 42.90±0.30a 26.80±0.20b ‘QH34’ D1 47.30±0.44a 24.43±0.50a D2 47.13±0.55a 23.80±0.20ab D3 46.80±0.52a 23.50±0.36b D4 45.30±1.04b 22.53±0.55c ‘HH43’ D1 42.60±1.04b 28.60±0.53a D2 44.20±0.61a 27.30±0.36b D3 43.40±0.60ab 27.37±0.40b D4 41.90±0.79b 25.50±0.46c ‘Y6019’ D1 46.60±1.31a 24.70±0.35a D2 45.80±1.22ab 24.30±0.26ab D3 45.60±1.04ab 23.77±0.25b D4 43.60±1.13b 23.13±0.32c Table 3. Effects of planting density on soybean quality traits
-
由表4可知,随着密度增加,不同品种的大豆单株四粒荚、三粒荚数目均呈下降趋势粒荚呈下降趋势;单株空粒荚、一粒荚数目均呈上升趋势。‘HH43’四粒荚降幅最大(92.78%),‘HN84’四粒荚降幅最小(50.00%);‘SN52’三粒荚降幅最大(83.48%),‘HH43’三粒荚降幅最小(46.94%);‘ZH901’一粒荚增幅最大(253.33%),‘MD1137’一粒荚增幅最小(46.94%);‘QH34’空粒荚增幅最大(277.11%),‘ZH901’空粒荚增幅最小(64.85%)。
品种
Cultivar密度
Density4粒荚
4-Seed3粒荚
3-Seed2粒荚
2-Seed1粒荚
1-Seed空粒荚
0-Seed单株荚数
Pod number‘SN52’ D1 \ 3.45±1.04a 4.57±0.58a 2.08±0.23c 2.67±0.38b 10.10±1.13a D2 \ 2.17±0.81a 3.85±0.65ab 2.19±0.23bc 3.07±0.59b 8.20±1.04ab D3 \ 0.54±0.44b 3.63±0.93ab 2.61±0.33b 4.67±0.47a 6.78±0.98b D4 \ 0.57±0.22b 2.39±0.99b 3.45±0.29a 5.20±0.95a 6.41±1.25b ‘ZH901’ D1 \ 3.97±0.99a 5.55±0.65a 1.65±0.46c 2.93±0.61b 11.17±1.09a D2 \ 3.45±1.15a 4.12±0.73ab 2.97±0.62c 3.73±0.57ab 10.55±0.28a D3 \ 2.41±0.61ab 2.12±0.82c 4.39±1.21b 4.37±0.74ab 10.35±0.25a D4 \ 1.75±0.30b 2.77±0.97bc 5.83±0.46a 4.83±0.93a 8.90±0.53b ‘NN47’ D1 \ 10.44±0.61a 2.77±0.72c 3.71±0.46b 1.87±0.65c 25.89±1.08a D2 \ 9.37±0.45a 8.36±0.76ab 3.84±1.37b 3.27±0.93bc 21.57±1.22b D3 \ 6.44±1.12b 7.88±0.80b 5.68±0.78a 4.07±0.23ab 20.00±1.19bc D4 \ 3.74±1.34c 9.54±0.70a 5.81±0.37a 5.40±1.01a 19.09±1.21c ‘HN84’ D1 0.52±0.09a 6.59±1.92a 8.30±0.81a 3.33±0.81b 1.87±0.51a 18.22±1.26a D2 0.42±0.09ab 3.69±1.02b 8.45±0.80a 3.50±0.86b 4.03±0.76b 16.37±1.19a D3 0.29±0.05bc 3.12±1.23b 6.52±0.90b 5.88±0.58a 4.43±1.00b 15.99±1.31ab D4 0.26±0.06c 2.37±0.63b 4.53±0.65c 6.15±0.20a 4.90±0.62b 13.48±1.41b ‘HN531’ D1 \ 7.91±2.81a 6.41±0.51a 4.35±1.36c 1.40±1.25b 18.84±1.27a D2 \ 4.94±1.79 ab 3.56±0.66b 5.68±0.93bc 2.43±0.90ab 14.18±1.37b D3 \ 3.43±0.65b 3.31±0.80b 7.13±0.71ab 3.63±0.65a 13.86±1.41b D4 \ 1.75±0.47b 2.73±0.99b 8.80±1.11a 4.27±1.20a 13.29±1.41b ‘TD67’ D1 \ 7.09±1.23a 6.63±0.91a 2.97±0.61c 1.27±1.10b 16.69±1.56a D2 \ 5.34±1.97 ab 6.15±0.75a 3.40±0.35bc 1.83±0.76ab 14.88±1.40ab D3 \ 3.39±2.03 ab 5.41±0.81a 4.35±0.43ab 2.97±0.25ab 13.16±1.76b D4 \ 2.12±0.59c 2.86±0.80b 5.18±0.68a 3.80±1.39a 9.15±1.18c ‘MD1137’ D1 \ 3.45±0.67a 5.83±0.81a 3.65±0.16b 1.40±0.35b 12.92±1.23a D2 \ 2.09±0.90b 2.12±0.81b 4.46±0.36a 2.40±0.96ab 10.00±1.38ab D3 \ 1.78±0.49b 3.43±0.80b 4.68±0.30a 3.13±0.81ab 9.90±1.79b D4 \ 1.78±0.11b 3.00±0.81b 5.11±0.53a 4.17±1.33a 9.55±1.36b ‘QH34’ D1 1.04±0.23a 9.65±1.48a 7.32±0.80c 4.19±0.42c 0.83±1.04b 22.09±1.51a D2 0.61±0.07b 6.14±0.58b 5.48±0.81bc 5.30±1.08bc 1.60±0.72ab 17.56±1.27b D3 0.28±0.06c 3.79±0.53c 4.07±0.70b 6.83±1.38ab 2.70±1.04ab 14.86±1.49bc D4 0.20±0.03c 2.42±0.71c 3.77±0.80a 7.22±0.68a 3.13±1.21a 13.51±1.88c ‘HH43’ D1 0.97±0.14a 2.94±0.8 a 6.13±0.80c 2.27±0.47a 1.37±0.71a 11.99±1.08a D2 0.60±0.07b 2.75±0.13 ab 4.28±0.80c 3.94±1.25a 2.07±0.40a 11.69±1.32a D3 0.26±0.06c 1.78±0.59 bc 2.54±0.91b 4.05±0.63a 3.13±0.75a 8.39±1.54b D4 0.07±0.05d 1.56±0.49c 1.94±0.50a 4.26±1.39a 3.30±1.47a 7.98±0.95b ‘Y6019’ D1 1.81±0.37a 5.78±0.77 a 5.78±0.77c 2.91±1.35b 1.53±0.87c 19.11±1.39a D2 1.23±0.25b 4.90±1.01 ab 4.90±1.01bc 3.63±0.29a 2.53±0.84bc 16.71±1.71ab D3 0.84±0.09b 3.43±0.64 bc 3.43±0.64ab 5.38±0.52a 3.07±0.40ab 15.43±1.34b D4 0.17±0.07c 2.45±1.06 c 2.45±1.06a 5.42±0.62a 3.97±0.55b 14.69±1.61b Table 4. The effect of different planting densities on the allocation of pod number per soybean plant
/no -
如表5所示,随着种植密度的增加,不同品种大豆的有效节数、单株荚数、单株粒数和百粒重均呈下降趋势,具体表现为D1> D2> D3> D4。‘HN531’有效节数降幅最大,从10.35降至4.05(降幅60.9%),‘NN47’有效节数降幅最小,从8.43降至6.38(降幅24.3%)。‘TD67’有效荚数降幅最大,从16.69降至9.15(降幅45.18%),‘ZH901’有效荚数降幅最小,从11.17降至8.90(降幅20.32%)。‘HH43’单株粒数降幅最大,从20.60降至9.92(降幅51.84%),‘NN47’单株粒数降幅最小,从37.65降至27.13(降幅27.94%)。‘HH43’百粒重降幅最大,从22.00降至14.30(降幅35.00%),‘Y6019’百粒重降幅最小,从27.20降至25.10(降幅7.72%)。
品种
Cultivar密度
Density有效节数/个
MSNN/no单株荚数/个
PN/no单株粒数/个
SNP/no百粒重/g
100-SW/g‘SN52’ D1 6.13±0.86a 10.10±1.13a 14.67±2.36a 23.73±0.68a D2 5.52±1.10ab 8.20±1.04ab 12.06±1.49ab 22.5±0.53ab D3 4.47±0.74ab 6.78±0.98b 10.41±1.91b 21.63±0.47b D4 3.74±1.35b 6.41±1.25b 8.80±1.61b 21.50±1.35b ‘ZH901’ D1 7.54±0.98a 11.17±1.09a 16.72±2.20a 21.50±1.35a D2 5.95±1.22ab 10.55±0.28a 14.66±1.98ab 21.10±1.18ab D3 4.83±0.61bc 10.35±0.25a 12.48±1.55b 19.50±0.66bc D4 3.53±1.47c 8.90±0.53b 11.68±1.64b 18.30±1.15c ‘NN47’ D1 8.43±0.74a 25.89±1.08a 37.65±2.33a 21.23±1.25a D2 8.20±1.10a 21.57±1.22b 29.93±1.97b 20.10±0.96ab D3 7.80±1.35a 19.99±1.19bc 27.88±1.75b 19.90±0.46ab D4 6.38±0.49a 19.09±1.21c 27.13±1.82b 19.20±0.66b ‘HN84’ D1 9.53±0.51a 18.22±1.26a 29.45±1.96a 24.20±1.75a D2 8.34±1.14a 16.37±1.19a 27.01±1.76ab 21.60±1.71ab D3 7.78±1.14ab 15.99±1.31ab 23.92±1.88b 21.30±1.71ab D4 6.05±0.84b 13.48±1.41b 19.30±1.76c 19.70±1.73b ‘HN531’ D1 10.35±0.84a 18.84±1.27a 25.76±2.01a 21.30±0.96a D2 10.04±0.76a 14.18±1.37b 17.74±2.01b 20.00±1.32ab D3 7.74±0.71b 13.86±1.41b 17.18±1.78b 18.20±1.04bc D4 4.05±0.93c 13.29±1.41b 16.01±1.78b 17.30±1.71c ‘TD67’ D1 8.07±0.74a 16.69±1.56a 23.32±1.89a 27.40±1.85a D2 7.38±0.81a 14.88±1.40ab 21.04±1.89ab 26.10±1.93ab D3 5.34±0.68b 13.16±1.76b 18.56±1.89b 22.50±1.80bc D4 5.01±0.73b 9.15±1.18c 12.02±1.89c 21.80±1.87c ‘MD1137’ D1 7.35±0.90a 12.92±1.23a 18.76±1.89a 23.20±0.53a D2 6.07±1.06ab 10.00±1.38ab 16.23±1.89ab 22.50±0.87ab D3 4.40±0.99bc 9.90±1.79b 13.32±1.89bc 22.10±0.96ab D4 3.83±1.09c 9.55±1.36b 12.54±1.89c 20.60±1.85b ‘QH34’ D1 6.77±0.79a 22.09±1.51a 32.20±1.99a 30.30±2.25a D2 6.36±0.68ab 17.56±1.27b 24.92±2.01b 28.33±1.76a D3 5.05±0.84bc 14.86±1.49bc 19.44±1.89c 24.20±1.97b D4 4.34±0.88c 13.51±1.88c 17.58±1.89c 21.90±0.46b ‘HH43’ D1 5.71±0.75a 11.99±1.08a 20.60±1.89a 22.00±0.70a D2 5.35±0.86ab 11.69±1.32a 17.56±1.89b 18.63±5.67ab D3 4.04±0.94ab 8.39±1.54b 11.61±1.90c 15.40±0.79b D4 3.78±0.89b 7.98±0.95b 9.92±1.70c 14.30±1.04b ‘Y6019’ D1 8.74±0.94a 19.11±1.39a 32.14±1.63a 27.20±1.39a D2 8.04±0.88a 16.71±1.71ab 27.23±1.89b 26.60±0.72ab D3 7.32±1.08a 15.43±1.34b 23.39±1.89c 26.30±0.72ab D4 4.33±1.09b 14.69±1.61b 21.77±1.89c 25.10±0.82b Table 5. The effect of different planting densities on soybean yield components
-
如图3所示,随着种植密度的增加,产量表现为下降趋势或先上升后下降趋势,不同品种间产量相差较大,其中品种‘SN52’、‘HN531’、‘TD67’、‘MD1137’、‘QH34’和‘Y6019’在密度D1时产量含量最高,品种‘NN47’和‘HH43’在密度D2时产量含量最高,品种‘ZH901’和‘HN84’在密度D3时产量含量最高。品种‘HN84’产量均值最高(643.12 kg·hm−2),‘TD67’产量均值次之(580.96 kg·hm−2),品种‘SN52’产量均值最小(323.55 kg·hm−2)。
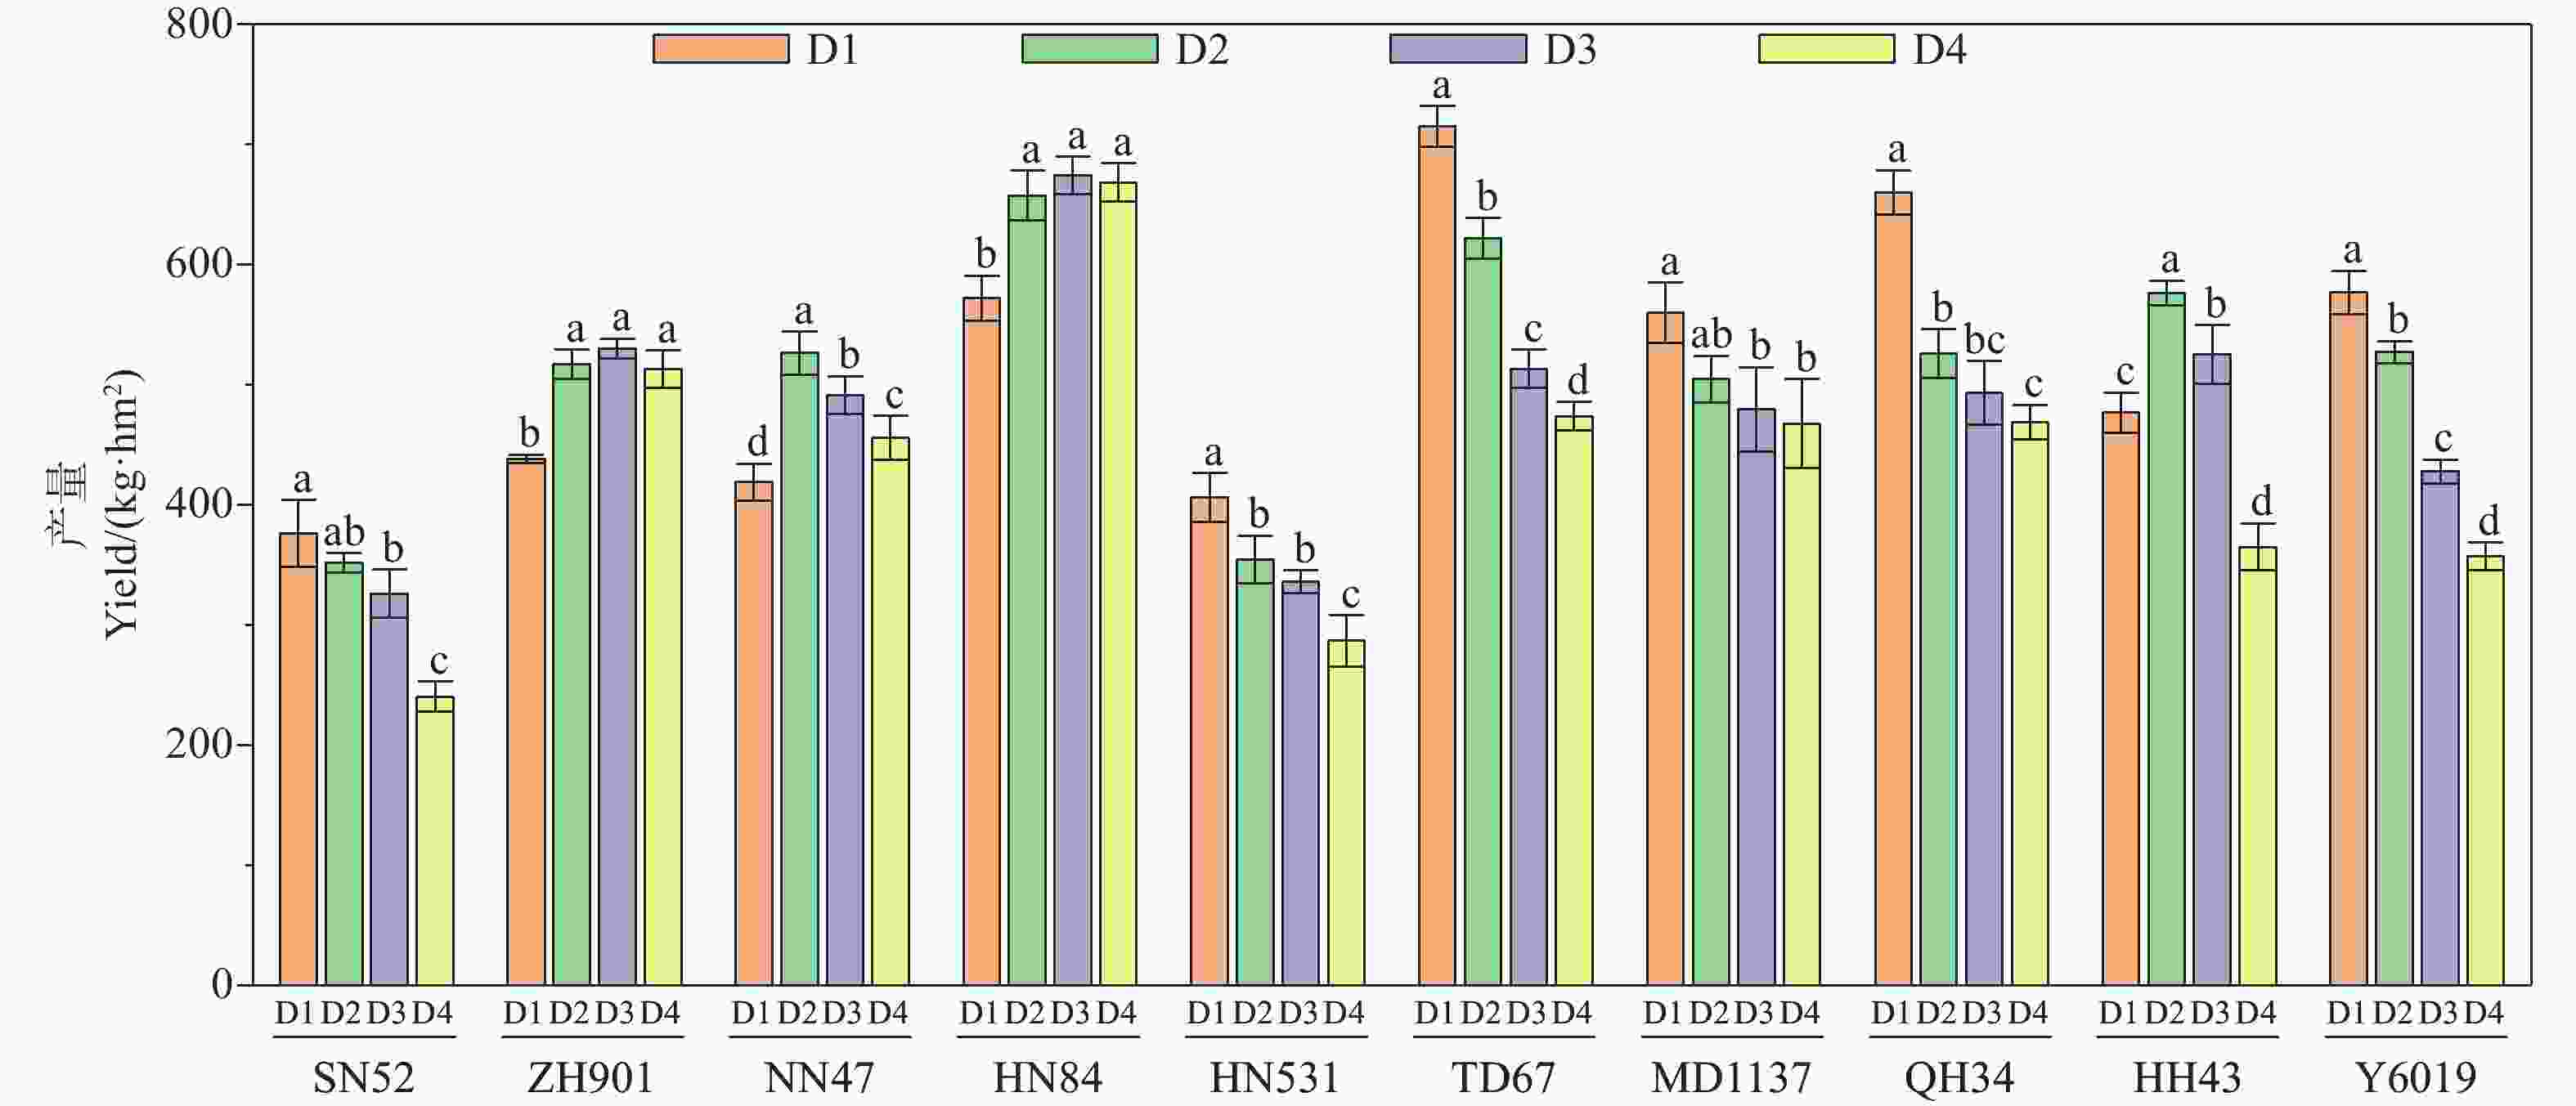
Figure 3. The effect of different planting densities on soybean yield
-
相关性分析结果(表6)表明,不同品种各个性状之间的相关性不同。‘SN52’产量与SPAD值、有效节数、单株荚数、百粒重、单株粒数呈显著正相关,相关系数分别为0.79、0.60、0.69、0.61、0.69,与叶面积指数呈显著负相关,相关系数为−0.63;‘ZH901’产量与SPAD值、有效节数、单株荚数、百粒重、呈显著正相关,相关系数分别为0.77、0.58、0.74、0.63,与株高、叶面积指数呈显著负相关,相关系数分别为−0.66、−0.80;‘NN47’产量与单株粒数呈显著负相关,相关系数为−0.63;‘HN84’产量与叶面积指数呈显著正相关,相关系数为0.66,与SPAD值、有效节数、单株荚数、单株粒数呈显著负相关,相关系数分别为−0.67、−0.60、−0.63、−0.61;‘HN531’产量与SPAD值、有效节数、单株荚数、百粒重、单株粒数呈显著正相关,相关系数分别为0.87、0.87、0.69、0.80、0.82,与叶面积指数呈显著负相关,相关系数为−0.68;‘TD67’产量与SPAD值、有效节数、单株荚数、百粒重、单株粒数呈显著正相关,相关系数分别为0.81、0.90、0.83、0.86、0.86,与株高、叶面积指数呈显著负相关,相关系数分别为−0.67、−0.60;‘MD1137’产量与SPAD值、有效节数、单株荚数、百粒重、单株粒数呈显著正相关,相关系数分别为0.74、0.73、0.58、0.66、0.72;‘QH34’产量与SPAD值、有效节数、单株荚数、百粒重、单株粒数呈显著正相关,相关系数分别为0.92、0.72、0.83、0.79、0.92,与株高、叶面积指数呈显著负相关,相关系数分别为−0.93、−0.93;‘HH43’产量与SPAD值、单株荚数呈显著正相关,相关系数分别为0.69、0.70;‘Y6019’产量与SPAD值、有效节数、单株荚数、百粒重、单株粒数呈显著正相关,相关系数分别为0.88、0.83、0.71、0.69、0.89。大部分品种提高有效节数、单株荚数,单株粒数和百粒重,降低株高,控制旺长是增产的关键。
性状
Trait产量Yield(Yield/kg·km−2) ‘SN52’ ‘ZH901’ ‘NN47’ ‘HN84’ ‘HN531’ ‘TD67’ ‘MD1137’ ‘QH34’ ‘HH43’ ‘Y6019’ SPAD 值
SPAD value0.79** 0.77** −0.12ns −0.67* 0.87** 0.81** 0.74** 0.92** 0.69* 0.88** 有效节数
SN0.60* 0.58* 0.17ns −0.60* 0.87** 0.90** 0.73** 0.72** 0.46ns 0.83** 单株荚数
PN0.69* 0.74** −0.43ns −0.63* 0.69* 0.83* 0.58* 0.83** 0.70* 0.71* 株高
PH−0.11ns −0.66* 0.038ns 0.25ns 0.30ns −0.67* −0.26ns −0.93** 0.48ns −0.33ns 百粒重
100-SW0.61* 0.63* −0.42ns −0.57ns 0.80** 0.86** 0.66* 0.79** 0.48ns 0.69* 叶面积指数
LAI−0.63* −0.80** 0.32ns 0.66* −0.68* −0.60* −0.58ns −0.93** −0.30ns 0.31ns 单株粒数 SNP 0.69* 0.43ns −0.63* −0.61* 0.82** 0.86** 0.72** 0.92** 0.61ns 0.89** 注:*、**分别表示在0.05和0.01水平上显著;ns:表示差异不显著。 Note:* and ** indicate significant difference at the levels of 0.05 and 0.01, respectively; ns indicates that the difference is not significant. Table 6. The correlation analysis of plant agronomic and yield traits of soybean
-
合理密植是作物栽培领域的重要农艺措施。群体产量本质上是个体产量与单位面积株数的乘积,密度是构成产量的直接要素[12-13]。通过配置合理的种植密度,能够优化冠层结构,从而更有效地捕获和利用光热资源,为作物高产稳产奠定基础。本研究结果表明,种植密度对大豆营养生长时期和生殖生长时期无显著影响,该结果与文献[14-15]等的研究结论一致,进一步支持了种植密度对大豆生育进程无明显调控作用的观点。这表明大豆主要生育时期的长度可能由遗传因素决定,受栽培密度等外部条件的影响较小。
本研究结果表明,种植密度对大豆群体的光合性能有显著影响。Pn反映叶片实际积累有机物的能力,是植物生长的关键指标。Ci则指示叶片内部CO2的供应状况,其变化常用于分析光合作用受限制的原因。随密度增加,Pn呈现逐渐升高的趋势,而Ci则随之降低。该结果与前人研究结论一致[16-20]。Pn升高可能是因为供试品种在海南表现出不分枝或弱分枝特性,植株可能将更多资源集中用于维持上层功能叶片的光合能力,以应对光竞争,协同充足的土壤肥力,为植株在适度密度胁迫下维持较高的营养状况和叶片功能提供了可能,共同导致单株Pn升高;在本研究中随密度增加Ci降低,可能是因为密度增大导致大豆植株叶片互相遮挡,冠层湍流交换减弱,CO2扩散受限。本研究结果表明,随密度增大,叶片SPAD值呈下降趋势,与多数研究报道的SPAD先升后降趋势不同,该现象可能源于本试验预设密度水平已超过SPAD下降的临界阈值,测定于光竞争最激烈的盛花期,致使所有密度下,光照竞争均占主导。 因此,SPAD值随密度增加的下降趋势从始至终都非常明显。
相关研究表明,种植密度对作物品质具有重要调控作用,大豆蛋白质与脂肪含量在不同密度条件下表现各异,均存在相应的最优密度值,反映出种植密度对品质形成具有显著影响[21-23]。本研究中,大豆蛋白质含量随密度的上升先升后降或持续下降,脂肪含量随密度的上升而下降,与前人的研究基本一致[24],该现象出现可能因为密度增加导致植株荫蔽,光合产物减少,直接抑制脂肪合成;蛋白质合成前期受益于氮代谢促进,但高密度下资源匮乏最终导致其下降。
适宜的种植密度可有效调控群体与个体间的竞争关系,优化大豆株型,促进单株后期生产能力的充分表达,进而为实现群体高产奠定基础[25]。相关研究表明,随种植密度增加,大豆株高呈上升趋势,单株荚数、单株粒数与有效节数呈下降趋势,适宜的种植密度是实现大豆高产的关键栽培措施[26-28]。本研究结果表明,密度增加,植株间对光、水和养分的竞争加剧,冠层荫蔽显著,根系对水分及养分竞争激化,大豆单株荚数、单株粒数和有效节数均下降;这与前人的研究结果一致[29-30],这可能是因为密度增加初期植株因为避荫反应,株高伸长;高密度导致光、水、养分资源锐减,抑制生长,致使株高下降或增长停滞。
大豆单位面积产量由单株产量与群体数量共同决定。适宜的种植密度可协调个体与群体的矛盾,在充分发挥单株生产能力的同时,提高光、温、水、土等资源利用效率,最终实现群体产量的最大化[31-36]。前人研究结果表明,随着种植密度增加大豆产量呈先升后降趋势[37-38],本研究发现密度的提高产量呈先升后降趋势或持续下降趋势,其结果与上述研究相似。表明密度提高初期资源利用率上升,但过高密度导致个体间光、水、肥竞争加剧,单株生产力下降,致使群体产量降低。
本研究中大部分品种产量与有效节数、单株荚数、百粒重和单株粒数呈显著正相关,与株高呈显著负相关。与前人结论相符合。表明这些品种提高单株粒数、降低株高,控制旺长是增产的关键。品种NN47与HN84的产量与单株粒数呈显著负相关,这一统计现象可归因于高密度下加剧的源库失衡:尽管其单叶Pn响应性上升,但单株总同化物(源)可能仍显不足;且它们维持了相对更高的单株粒数(库)。其后果是有限的光合产物被过度稀释,导致百粒重下降与瘪粒增多,最终使得较高的单株粒数反而与较低产量相关联。因此,协调源库关系是这两个品种高产的关键。
Effects of planting density on agronomic traits and yield of different soybean varieties in Hainan
DOI: 10.15886/j.cnki.rdswxb.20250144
- Received Date: 2025-10-20
- Accepted Date: 2025-12-24
- Rev Recd Date: 2025-12-03
- Available Online: 2026-02-12
-
Key words:
- soybean /
- planting density /
- agronomic traits /
- yield /
- hainan
Abstract: An attempt was made to improve the utilization efficiency of the precious land resources for seed production in Hainan and to ensure the production of high-quality soybean seeds. The effects of planting density on the yield, photosynthetic physiology, agronomic traits, and quality characteristics of different soybean genotypes under Hainan's ecological conditions were analyzed to provide a theoretical basis for rational close planting. Ten dominant soybean varieties recommended by the General Office of the Ministry of Agriculture and Rural Affairs of China were selected, and planted at four planting densities, 400,000, 600,000, 800,000, and 1,000,000 plants per hectare (or D1 to D4, respectively). A systematic analysis was conducted on the effects of density on soybean agronomic traits, quality parameters, photosynthetic characteristics, and yield components. The results indicated that with an increase in planting density, the flowering and maturity stages of the soybeans showed no significant changes. The number of grains per plant, pods per plant, and effective nodes all decreased significantly. Plant height exhibited a trend of either gradual decline or an initial increase followed by a decrease. Density treatments significantly regulated quality traits and photosynthetic parameters: protein content generally showed a decreasing trend or an initial increase followed by a decrease, and fat content commonly declined while the net photosynthetic rate (Pn) demonstrated an increasing trend with density. The yield response to density varied significantly among varieties. Most varieties, such as Suinong 52 and Heinong 531, achieved their highest yield at low to medium densities (D1 or D2), whereas a few varieties, such as Zhonghuang 901 and Heinong 84, maintained high yield even at relatively high densities (D3). All these findings clarify the complex physiological mechanisms through which planting density regulates soybean yield and quality formation by influencing light use efficiency and plant architecture performance. The results highlight the necessity of determining suitable planting densities based on varietal characteristics, providing a scientific basis and theoretical reference for achieving high-quality and high-yield soybean cultivation in the Hainan region.
| Citation: | Li Fuxue, Wang Jianan, Fang Yi, Luo Can, Yu Xudong. Effects of planting density on agronomic traits and yield of different soybean varieties in Hainan[J]. Journal of Tropical Biology. doi: 10.15886/j.cnki.rdswxb.20250144

|
 DownLoad: