

-
种间互作是一个经典而活跃的研究课题[1 − 2]。近年来,越来越多的研究重点关注揭示动物群落中生态相似物种如何在不同维度上划分其生态位[3 − 4]。同域分布物种之间由于种间竞争,通过影响它们占用和利用有限资源的能力,从而相互制约,生态位发生分化[5 − 6]。为减少种间竞争的负面影响,物种通常倾向于在时间、空间或食物资源上进行划分[4,7 − 8]。根据竞争排斥理论,具有相似生态特征的竞争者不能在同一生态位内共存。为实现共存,至少有一个竞争者的生态位需要改变[5 − 6]。
鸡形目鸟类属于典型的地栖性物种,其生态位空间相对狭窄,可能面临更高的种间竞争压力[4,9]。因此,鸡形目鸟类是检验生态位分化,探究同域物种共存机制的理想类群[10 − 11]。海南大田国家级自然保护区(以下简称大田保护区)仅有红原鸡(Gallus gallus jabouille)和中华鹧鸪(Francolinus pintadeanus)两种雉类分布。二者具有相似的食物资源[12],但这两种雉类在栖息地选择偏好、生态位分化等尚未被关注。基于此,本研究在大田保护区比较了同域分布的红原鸡和中华鹧鸪的栖息地分布,并利用最大熵模型(MaxEnt)对两个物种的栖息地适宜性及重叠性进行综合评价。
-
海南大田国家级自然保护区(19°05′—19°17′N,108°47′—108°49′E)位于海南省东方市境内,占地面积1 310 hm2 。大田保护区是以海南坡鹿(Rucervus eldii hainanus)及其栖息地为主要保护对象的野生动物自然保护区。大田保护区地形平坦,海拔在40~60 m之间。属热带季风气候。受季风和台风影响,全年降雨量分布不均匀,呈明显干湿季。其中,雨季在每年7月至10月,年降雨量1 012 mm;旱季长达8个月,年蒸发量2 522 mm,年蒸发量是降雨量的2.5倍。保护区年平均气温为23~25 ℃,7月份平均气温29.1 ℃,1月份平均气温为18.2 ℃。保护区气候具有日照时间长,太阳辐射强、温度高、冷期短、较干旱等特点[13 − 14]。
保护区植物资源丰富,形成独特的热带植物群落。区内有维管束植物602种,隶属103科,308属。植被群落主要包括落叶季雨林、稀树灌木草地、有刺灌丛林、人工草地和人工林等。保护区动物资源也同样丰富,有兽类39种、鸟类81种、两栖类12种、爬行类17种、鱼类8种、昆虫类111种[13 − 14]。
-
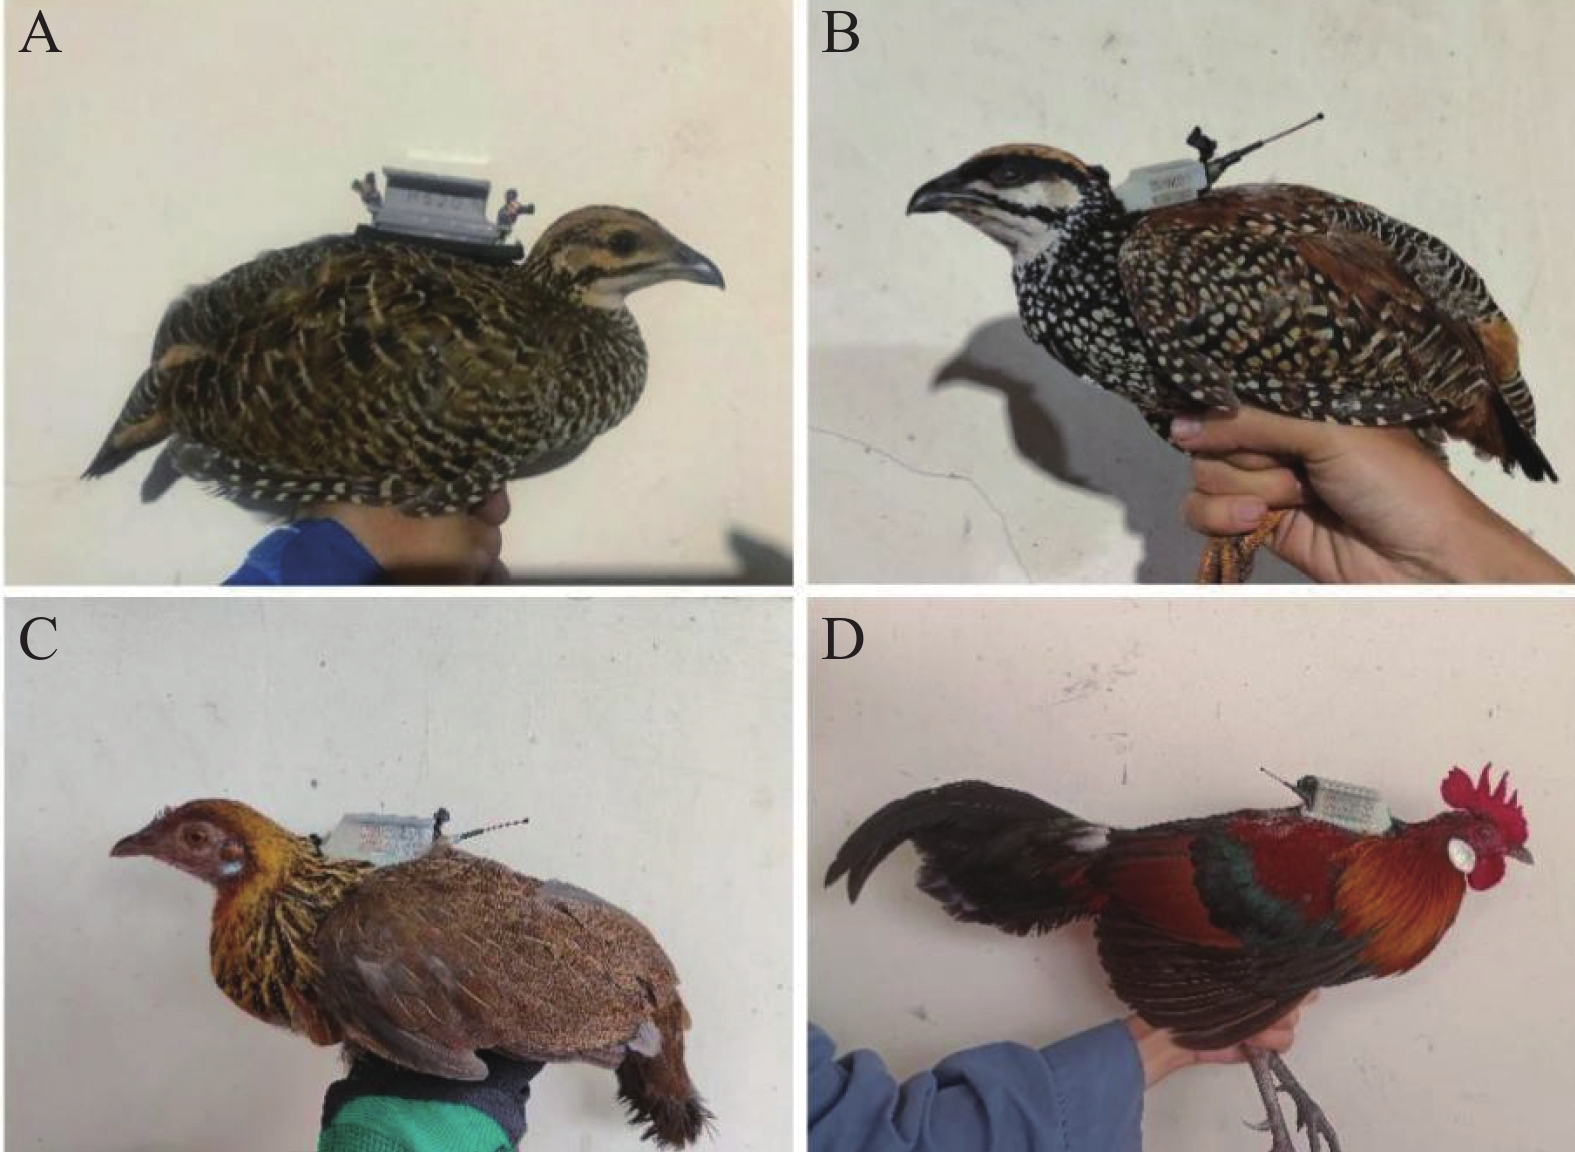
本研究于2023年3月至2024年1月,在大田保护区采用卫星跟踪技术和样线法调查分别获取红原鸡和中华鹧鸪分布点数据。具体如下:1)卫星跟踪技术自动跟踪。在野外分别采用足弓套足法和夜间网捕法无损伤抓捕红原鸡和中华鹧鸪各10只,其中红原鸡雌、雄个体分别为4只和6只,中华鹧鸪雌、雄个体分别为2只和8只,采用背包式绑法佩戴小型卫星跟踪器(厂家为湖南环球信士科技有限公司;中华鹧鸪佩戴型号为HQBG1206,质量为6.7 g;红原鸡佩戴型号为HQBG2830L/HQBG2512L,质量为30 g/12 g;图1)。跟踪个体的定位数据由跟踪器发回数据管理平台,根据不同个体佩戴的卫星跟踪器的电量而设置不同的回点时间,设置回点时间分别为每1、2、4、6、12 h发送1次当前时间的定位信息。定位信息包括追踪对象所在位点的时间、经纬度、海拔、电压、温度、运动量、高度、速度等数据。20只跟踪个体共获取26 084个分布点,其中红原鸡和中华鹧鸪的分布点分别为11
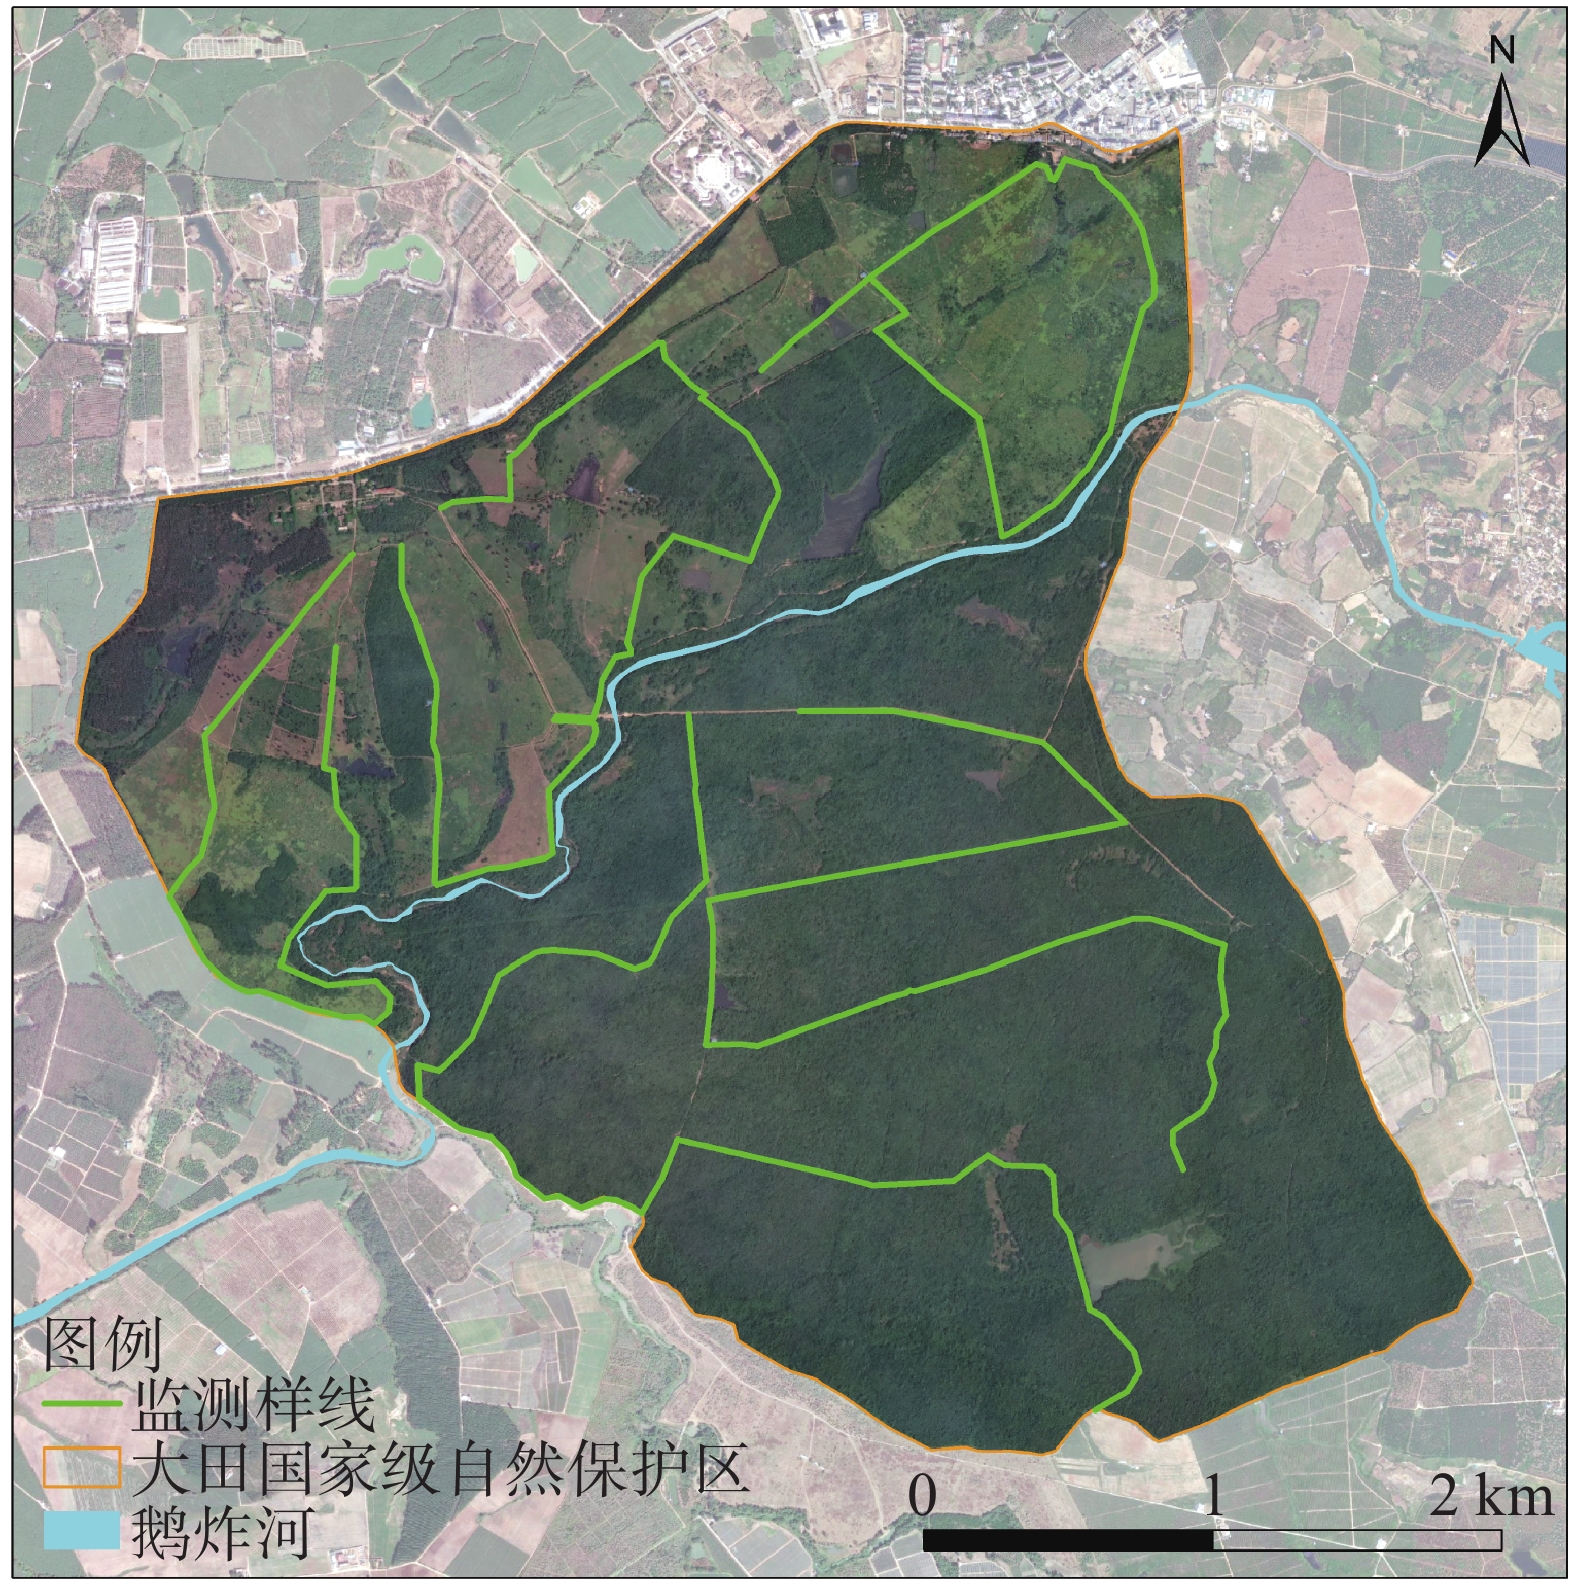
521 个和14 563个。2)样线法调查。在大田保护区布设5条样线(图2)。样线包含多种植被类型,从而尽量覆盖两种雉类的分布范围。样线长度设置为3.0~5.0 km,单侧宽度50 m,样线间隔最小200 m。调查过程中,调查人员沿样线慢速行走,搜寻红原鸡和中华鹧鸪的实体、鸣声、羽毛及粪便等,调查时间为每日 06:00—10:00和 15:00—19:00。在样线调查过程中发现红原鸡和中华鹧鸪的实体、羽毛、粪便以及听到的鸣声以GPS记录其经纬度坐标,样线调查共获取红原鸡和中华鹧鸪的分布点分别为122个和83个。考虑到红原鸡、中华鹧鸪的分布点距离过近会因空间自相关性较大而影响模型模拟的准确度,将卫星跟踪技术和样线调查获取红原鸡和中华鹧鸪的所有分布位点,依次利用ENMTools软件删除数据中空间自相关性大的分布点。经过严格筛选,仅保留可靠的105个红原鸡分布点和79个中华鹧鸪分布点。
Figure 1. The schematic diagram of Chinese Francolin(A, female; B, male)and Red Junglefowl(C, female; D, male)wearing satellite trackers
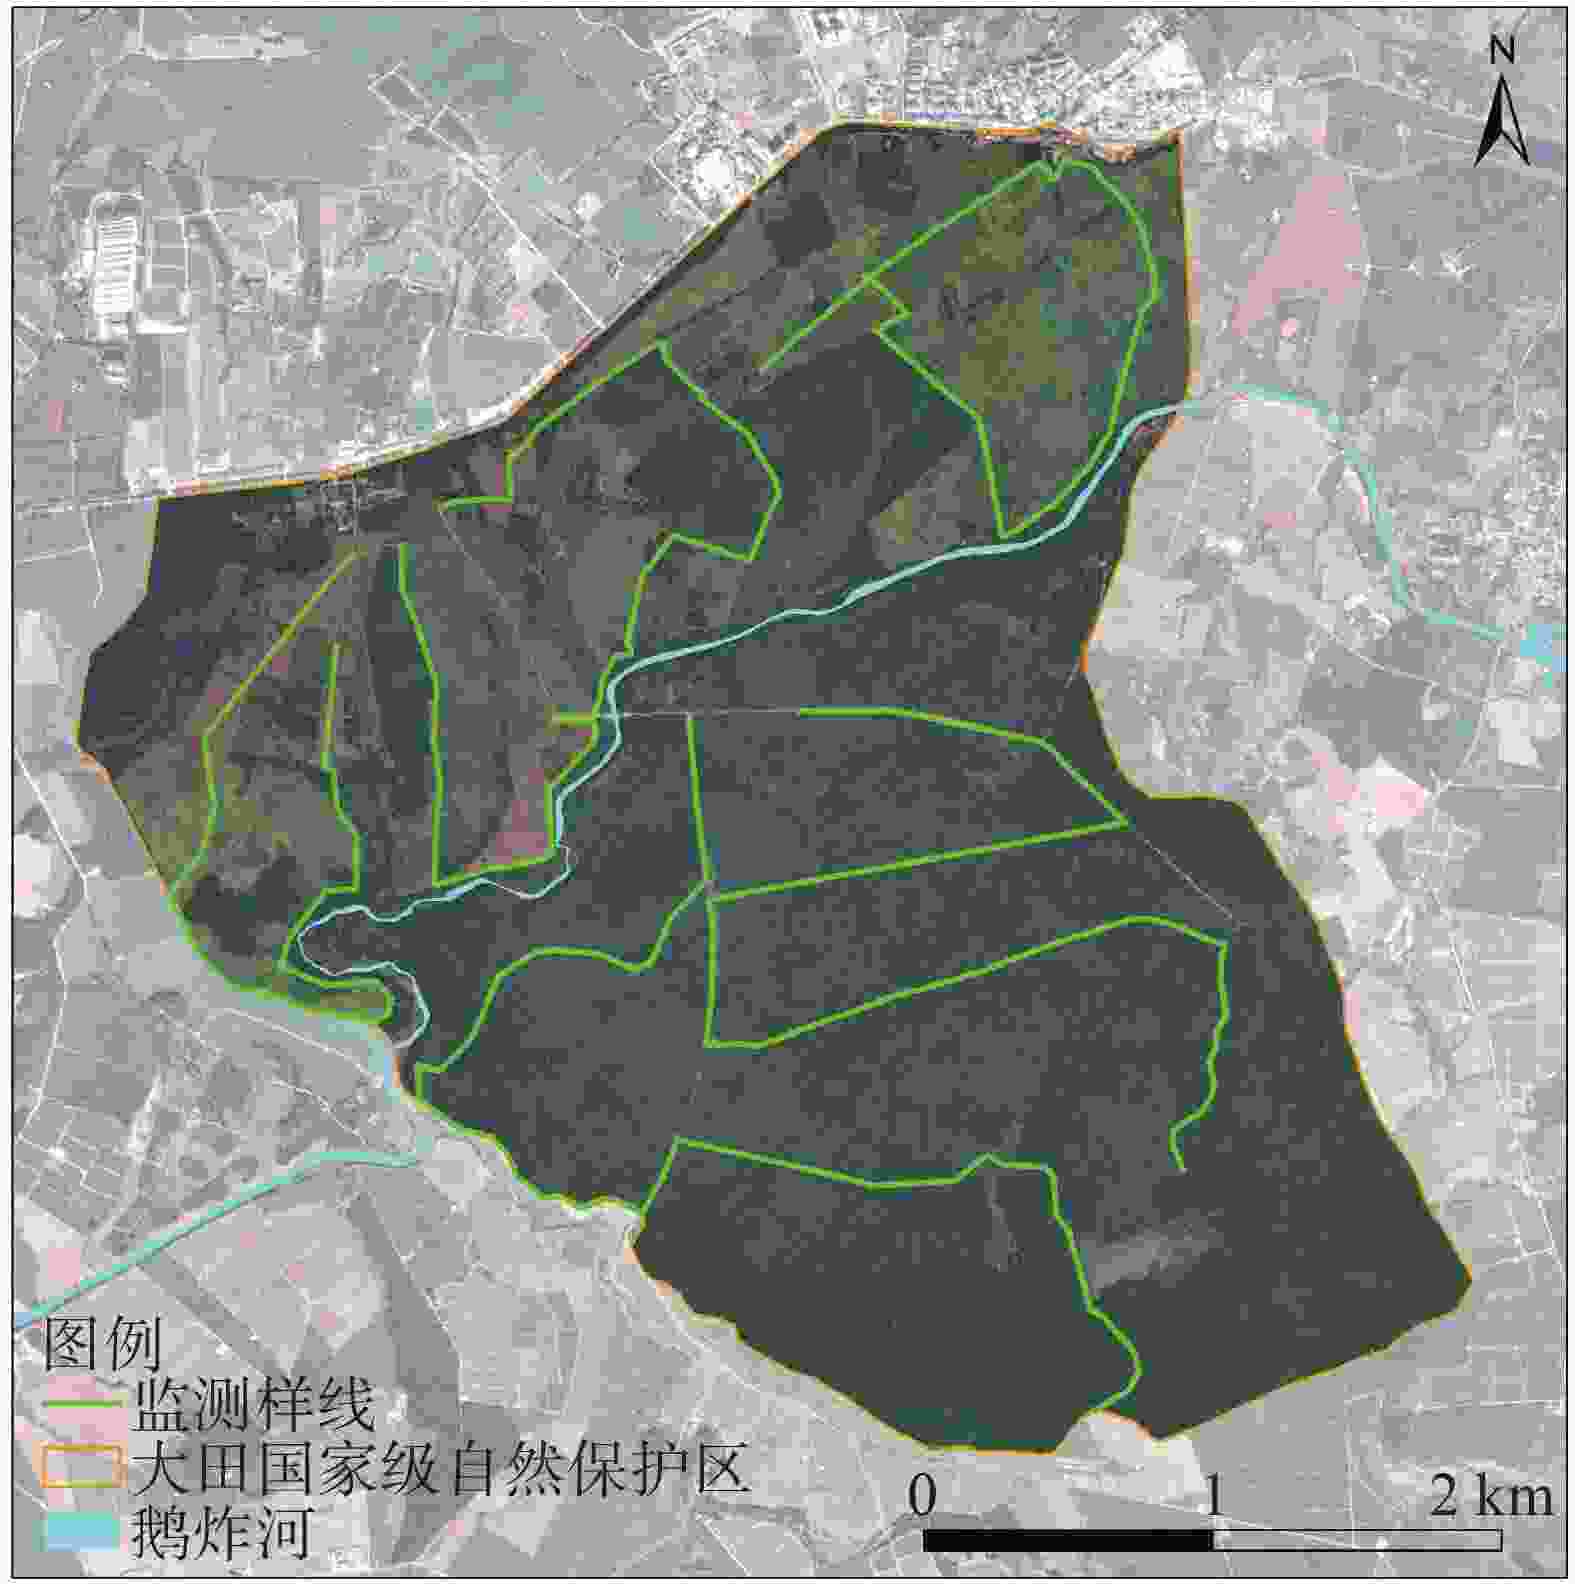
Figure 2. The line transect survey map of Hainan Datian National Nature Reserve
-
选择地形、植被、水源、气候、人为干扰等5类27个环境变量(表1)用于作为红原鸡和中华鹧鸪的潜在栖息地选择影响因子[10,15]。①地形数据:高程数据来源于地理空间数据云(
http://www.gscloud.cn/ )的ATSER GDEM版,下载分辨率为“30 m×30 m”,在ArcGIS 10.6中使用表面分析功能提取获得海拔、坡度、坡向3个地形变量;②水源数据:利用大田保护区矢量数据获得水系因子,使用ArcGIS 10.6的欧氏距离分析功能生成到河流距离的栅格数据;③植被数据:下载研究区域分辨率“30 m×30 m” Landsat 8遥感影像数据,利用ENVI 5.3软件,对该遥感影像进行监督分类,将植被类型分为阔叶林、灌丛、草甸3类,并通过遥感影像计算归一化植被指数(Normalized Difference Vegetation Index, NDVI),由于NDVI为时间序列数据,如果NDVI覆盖了像元则视为1,累加得到每一天NDVI的数据,基于这个数据计算NDVI与环境变量的响应关系;④生物气候数据:从Worldclim数据库(http://www.worldclim.org/ )下载2020年“1 km×1 km”分辨率得到的19个反映温度与降水的特点及季节性变化特征的生物气候变量;⑤人为干扰数据:依据大田保护区巡护道和居民点矢量数据,利用 ArcGIS 10.6的欧氏距离分析功能,生成距巡护道距离、距居民点距离的栅格数据。在Excel 19.0文件中保存两个物种的分布点数据,并将环境变量图层栅格统一调整为“30 m×30 m”格式,在ArcGIS 10.6中将其坐标系统统一设定为WGS_1984_UTM_Zone_49N地理坐标系统,并对图层边界进行统一处理最后转化为MaxEnt模型软件能够识别的ASCⅡ文件格式。对26个环境变量中所有连续型变量和分类变量分别进行皮尔逊和斯皮尔曼相关性分析,剔除相关系数绝对值r>0.6的变量。筛选出距水源距离、距巡护道距离、坡向、海拔等11个连续型环境变量和植被类型1个分类变量(表2)后,将它们转换为最大熵软件所需的ASC Ⅱ格式文件。变量类型
Type of variable变量代号
Code of variable变量名称
Variable单位
Unit来源
Source分辨率
Resolution气候因子 Bio1 年平均温度 ℃ Worldclim数据库(http://www.worldclim.org/) 1 km Bio2 平均日较差 ℃ Worldclim数据库(http://www.worldclim.org/) 1 km Bio3 等温性 — Worldclim数据库(http://www.worldclim.org/) 1 km Bio4 温度季节变动 — Worldclim数据库(http://www.worldclim.org/) 1 km Bio5 最暖月最高温度 ℃ Worldclim数据库(http://www.worldclim.org/) 1 km Bio6 最冷月最低温度 ℃ Worldclim数据库(http://www.worldclim.org/) 1 km Bio7 年平均温度差 ℃ Worldclim数据库(http://www.worldclim.org/) 1 km Bio8 最湿季均温 ℃ Worldclim数据库(http://www.worldclim.org/) 1 km Bio9 最干季均温 ℃ Worldclim数据库(http://www.worldclim.org/) 1 km Bio10 最暖季平均温 ℃ Worldclim数据库(http://www.worldclim.org/) 1 km Bio11 最冷季平均温 ℃ Worldclim数据库(http://www.worldclim.org/) 1 km Bio12 年降水量 mm Worldclim数据库(http://www.worldclim.org/) 1 km Bio13 年最湿月降水量 mm Worldclim数据库(http://www.worldclim.org/) 1 km Bio14 年最干月降水量 mm Worldclim数据库(http://www.worldclim.org/) 1 km Bio15 季节降雨量变化 — Worldclim数据库(http://www.worldclim.org/) 1 km Bio16 最湿季降雨量 mm Worldclim数据库(http://www.worldclim.org/) 1 km Bio17 最干季降雨量 mm Worldclim数据库(http://www.worldclim.org/) 1 km Bio18 最暖季降雨量 mm Worldclim数据库(http://www.worldclim.org/) 1 km Bio19 最冷季降雨量 mm Worldclim数据库(http://www.worldclim.org/) 1 km 水源因子 Dtw 距水源距离 m 大田保护区矢量数据 欧氏距离 人为干扰因子 Dtr 距巡护道距离 m 大田保护区矢量数据 欧氏距离 Dtp 距居民点距离 m 大田保护区矢量数据 欧氏距离 地形因子 Altitude 海拔 m 地理空间数据云(http://www.gscloud.cn/) 30 m Slope 坡度 ° 地理空间数据云(http://www.gscloud.cn/) 30 m Aspect 坡向 — 地理空间数据云(http://www.gscloud.cn/) 30 m 植被因子 VF 植被类型 — Landsat 8遥感影像数据 30 m NDVI 归一化植被指数 — Landsat 8遥感影像数据 30 m Table 1. Environment variables
变量代号
Variable code变量名称
Variable变量类型
Variable type变量代号
Variable code变量名称
Variable变量类型
Variable typeBio3 等温性
Temperature uniformity连续型
Successive typeBio6 最冷月最低温
The lowest temperature of the coldest month连续型
Successive typeBio13 最湿月降水量
Precipitation in the wettest month连续型
Successive typeBio19 最冷季降水
Precipitation in the coldest month连续型
Successive typeAltitude 海拔
Altitude连续型
Successive typeDtr 距巡护道距离
Distance from patrol road连续型
Successive typeDtw 距水源距离
Distance from water source连续型
Successive typeNDVI 归一化植被指数
Normalized difference vegetation index连续型
Successive typeSlope 坡度
Gradient连续型
Successive typeAspect 坡向
Aspect连续型
Successive typeDtp 距居民点距离
Distance from residential areas连续型
Successive typeVF 植被类型
Vegetational form分类型
Classification typeTable 2. Twelve environmental variables for habitat prediction of Red Junglefowl and Chinese Francolin
-
将整合好的两种雉类分布点及环境因子分别输入MaxEnt 3.4.2软件。在建模阶段,随机选取75% 的分布点用于建立模型,其余的25% 的分布点用于验证模型,在研究区域生成最大背景点数为10 000,最大迭代次数5 000次模拟,重复运行10次,结果以Logistic格式输出,选取10次运行中模型精度最高的结果作为栖息地适宜性评价的依据。在模型设置阶段,勾选绘制响应曲面和刀切法功能,默认其他参数设置。选取自举法(Bootstrap)为重复运行类别,并启用Random seed,使用受试者工作特征曲线(ROC 曲线)对模型进行验证,模型预测效果的衡量指标为AUC值,最终结果会同时生成刀切法(Jackfnife),检验环因子对模型预测的重要性和贡献值以及每个环境因子的反应曲线,并用来判断预测结果的准确性。当MaxEnt模型重复运行10次时,会自动计算AUC值,AUC 值范围为 0~1。 AUC值越高,则环境变量与预测物种地理分布关联性越强,物种分布预测准确性越高,预测效果越佳[16]。AUC评价标准为:0.5~<0.6为失败,0.6~<0.7为较差,0.7~<0.8为一般,0.8~<0.9为良好,0.9~1.0为优秀[17]。
-
通过模型运算得到研究区域的栖息地宜指数(habitat suitability index, HIS),采用训练敏感性(training sensitivity, TS)、特异性加和最大法(maximum training sensitivity plus specificity, MTSS)以及平衡训练遗漏率、预测面积及阈值(balance training omission, predicted area and threshold value, BTPT)分别作为适宜栖息地和次适宜栖息地的分类阈值,并将研究区域内红原鸡和中华鹧鸪的潜在栖息地质量分为适宜栖息地、次适宜栖息地和不适宜栖息地3个等级[18]。最终得到两种雉类在大田保护区的潜在适生区空间分布图。同时,利用ArcGIS 10.6软件的空间统计功能,计算不同潜在适生区面积及比例。
-
以10次重复后MaxEnt输出的平均栖息地适宜性指数作为最终的模型结果。根据最大约登指数将研究区域内的所有栅格二分类为适宜/不适宜生境。为量化研究区域内两种雉类栖息地的相似程度,并将结果输入ENMTools软件,计算它们的生态位重叠度D值和I值,这些值范围在0到1之间,数值越接近1,代表这两个物种的空间生态位分布越相似[10,19]。
-
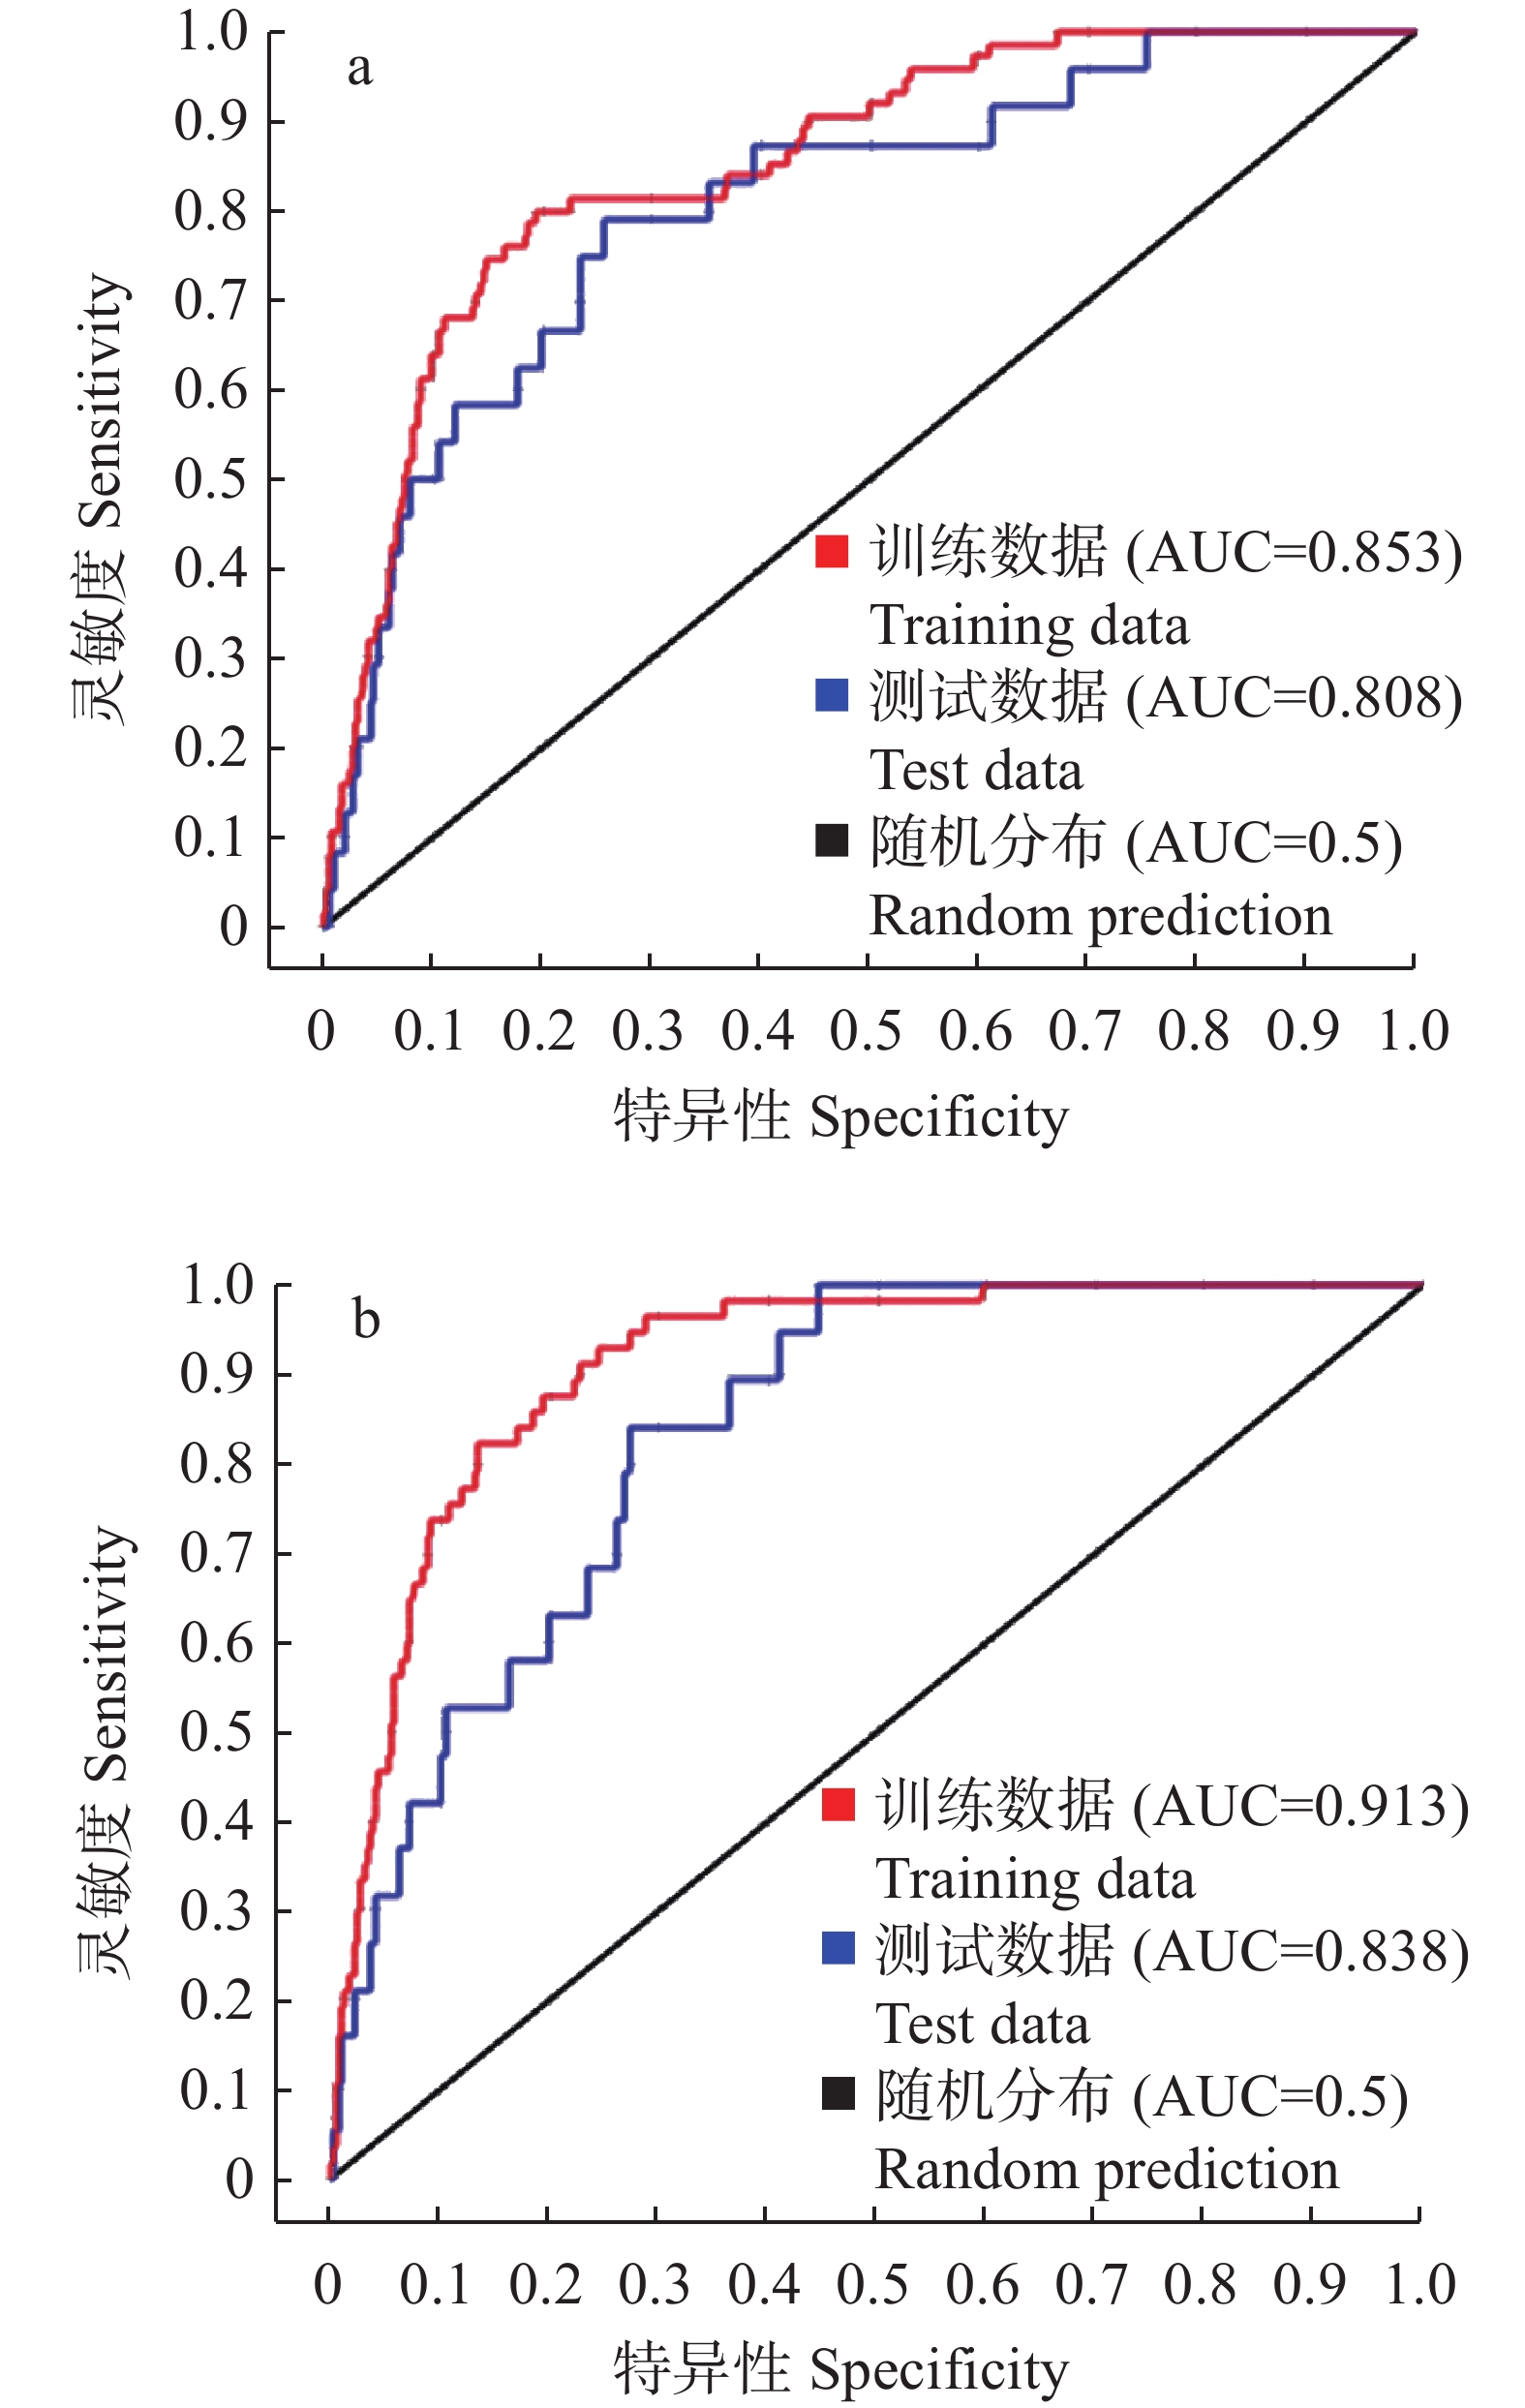
红原鸡潜在栖息地预测分布模型的训练集和测试集的 AUC 值分别为0.853和0.808,训练集和测试集的AUC差值为0.045(图3)。中华鹧鸪潜在栖息地预测分布模型的训练集和测试集的 AUC 值分别为0.913和0.838,训练集和测试集的AUC差值为0.075(图3)。两种雉类的 MaxEnt 模型预测结果均达到良好水平以上,能够较准确预测它们的潜在适宜栖息地。
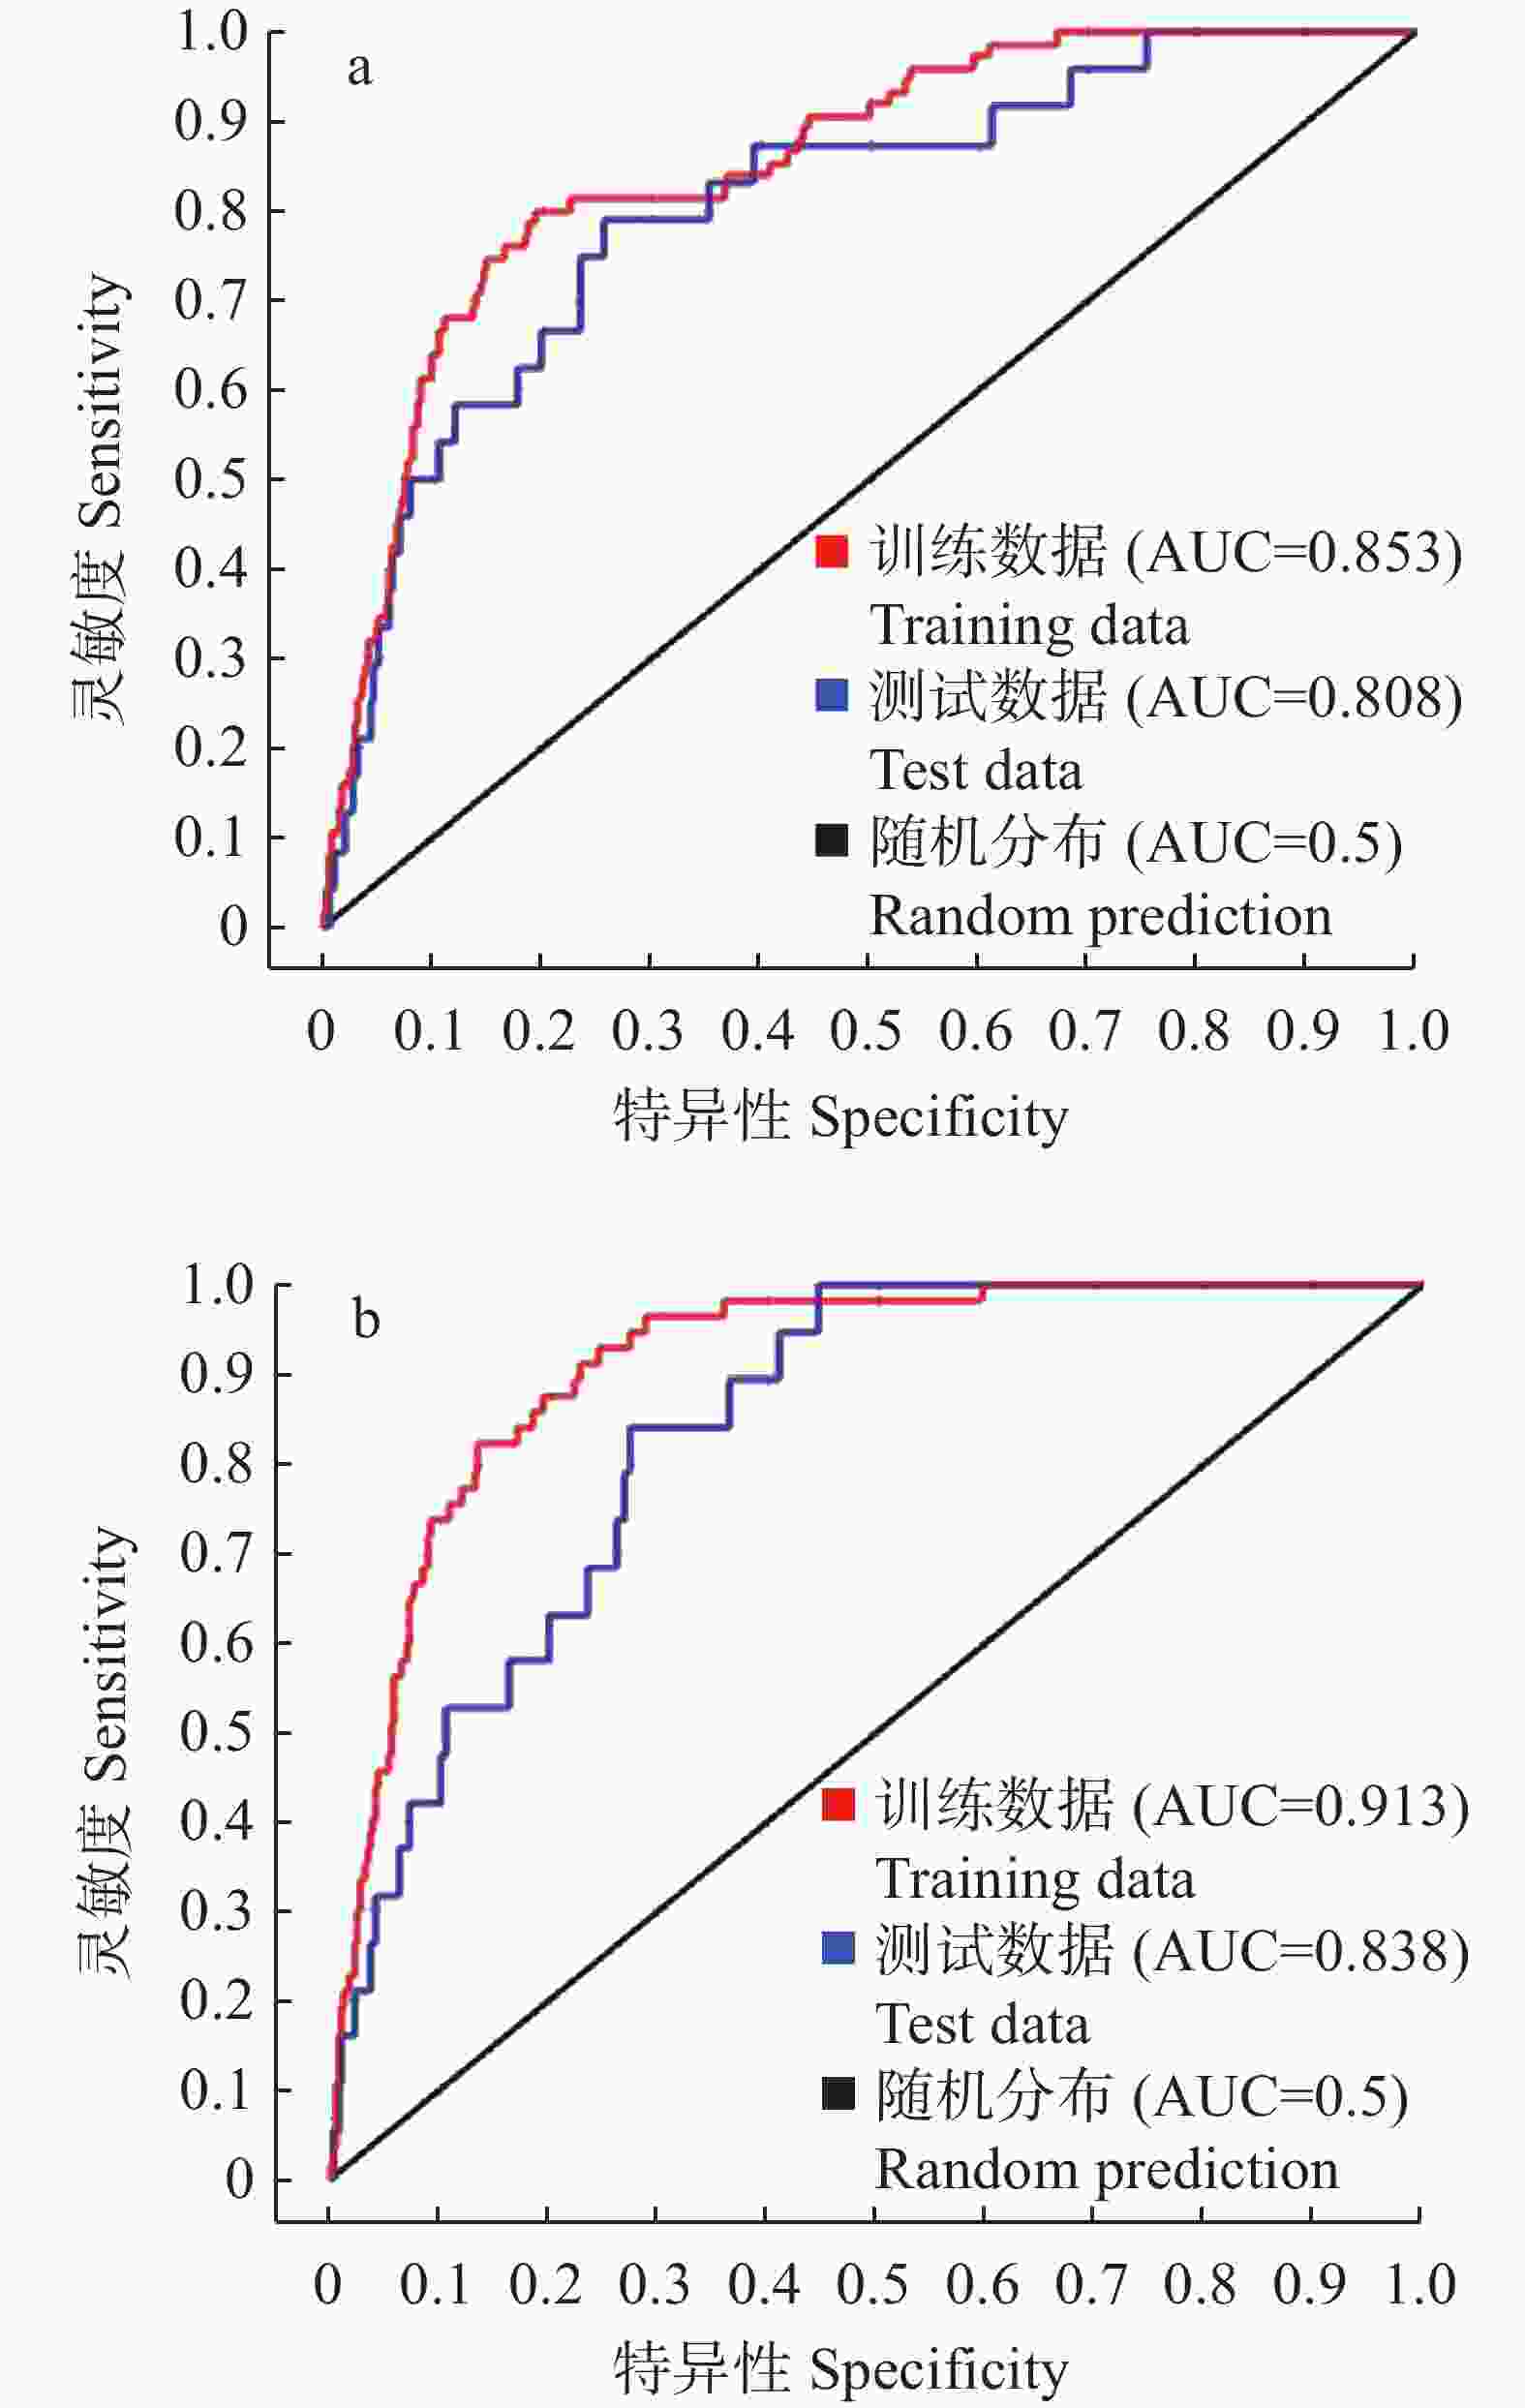
Figure 3. ROC curves predicted by the MaxEnt model for Red Junglefowl(a)and Chinese Francolin(b)
-
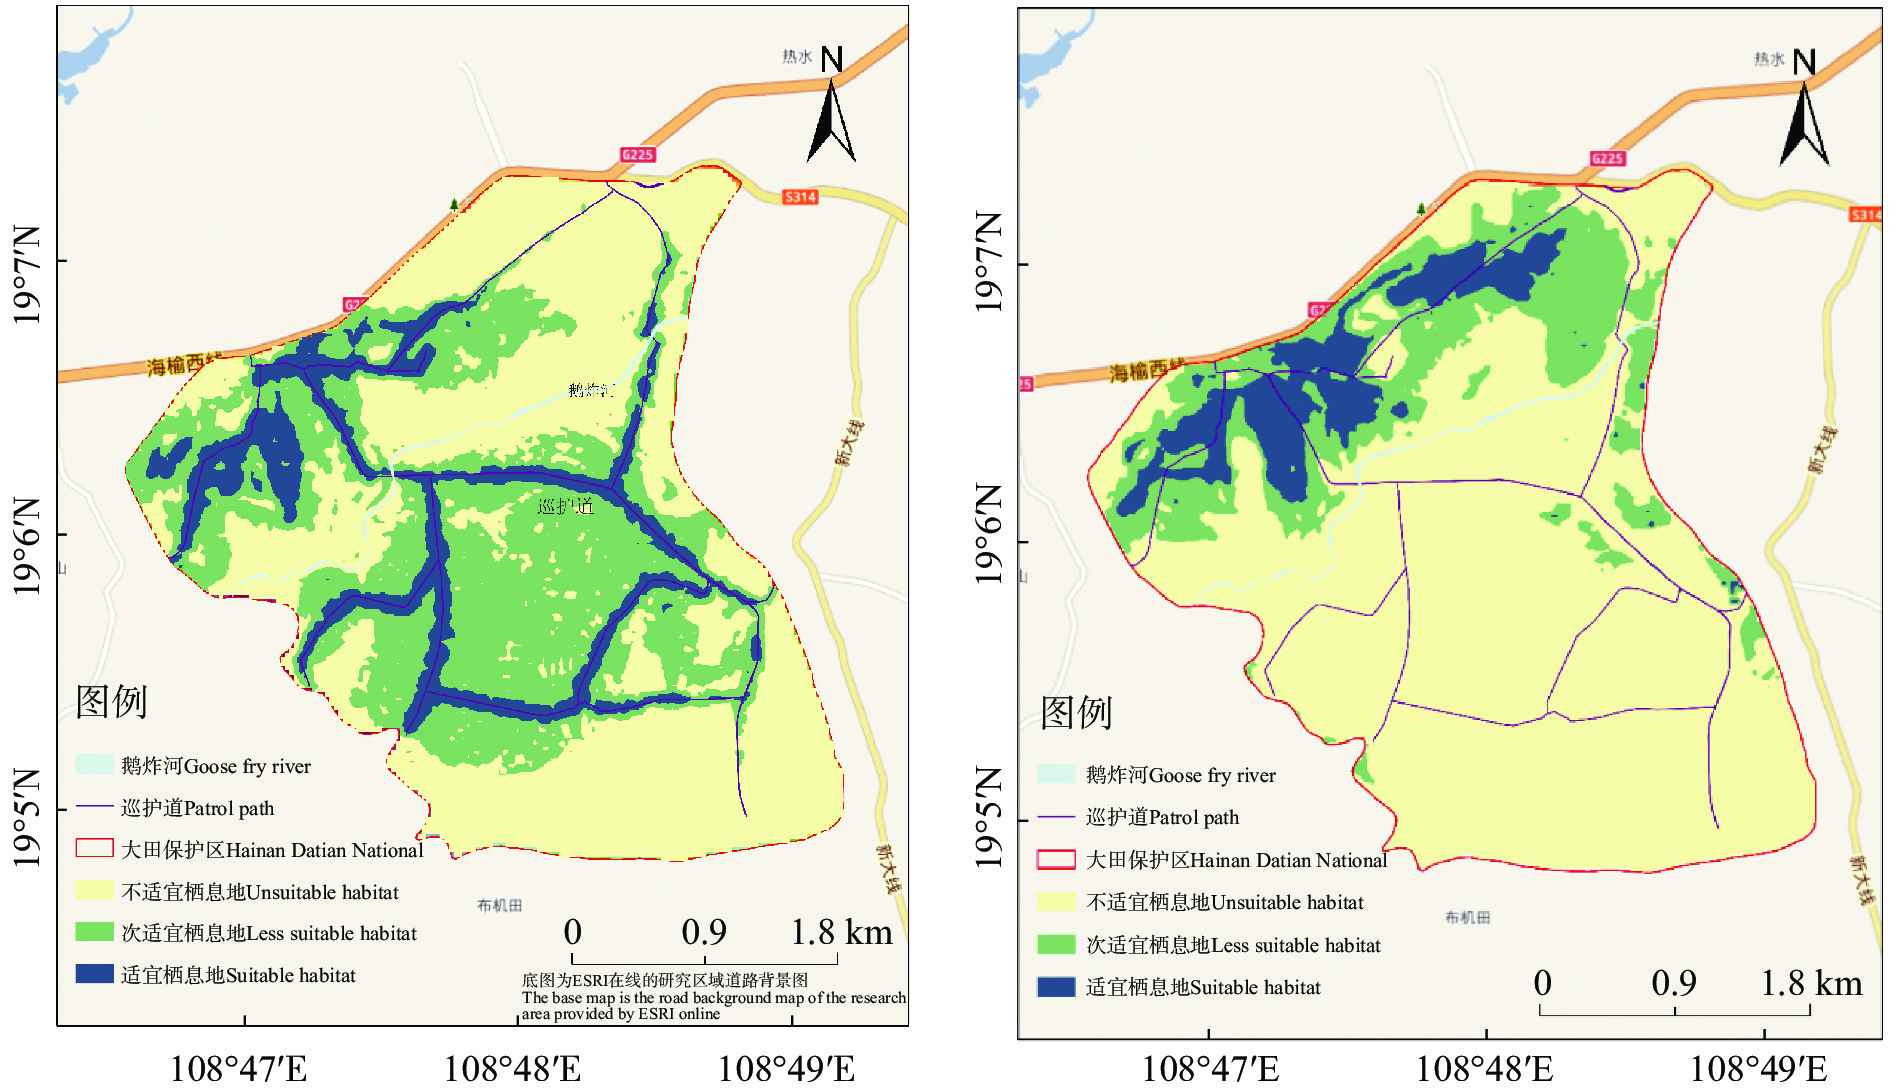
根据MaxEnt模型得到红原鸡的MTSS和BTPT值分别为0.212和0.056,中华鹧鸪的MTSS和BTPT值分别为0.196和0.057。红原鸡适宜栖息地、次适宜栖息地、不适宜栖息地的阈值分别为:HIS>0.221、0.221≥HIS>0.056、0.056≥HIS>0;中华鹧鸪适宜栖息地、次适宜栖息地、不适宜栖息地的阈值分别为:HIS>0.196、0.196≥HIS>0.057、0.057≥HIS>0。MaxEnt模型预测结果显示,研究区域内红原鸡的适宜栖息地、次适宜栖息地、不适宜栖息地面积分别为164.74、468.44、669.41 hm2,分别占总面积12.65%、35.96%、51.39%(图3和表3),主要分布于保护区的西北部和中部,结合野外调查,适宜栖息地以阔叶林为主;中华鹧鸪的适宜栖息地、次适宜栖息地、不适宜栖息地面积分别为108.78 、228.53、965.28 hm2,分别占总面积的8.35%、17.54%、74.11%(图4,表3),主要分布于保护区的北部,其适宜栖息地以草地为主。
栖息地质量等级
Habitat quality level红原鸡 Red Junglefowl 中华鹧鸪 Chinese Francolin 面积/hm2
Area/hm2百分比/%
Percentage/%面积/hm2
Area/hm2百分比/%
Percentage/%适宜栖息地
suitable habitat164.74 12.65 108.78 8.35 次适宜栖息地
less suitable habitat468.44 35.96 228.53 17.54 不适宜栖息地
unsuitable habitat669.41 51.39 965.28 74.11 Table 3. Different quality habitats and proportions of Red Junglefowl and Chinese Francolin in Hainan Datian National Nature Reserve
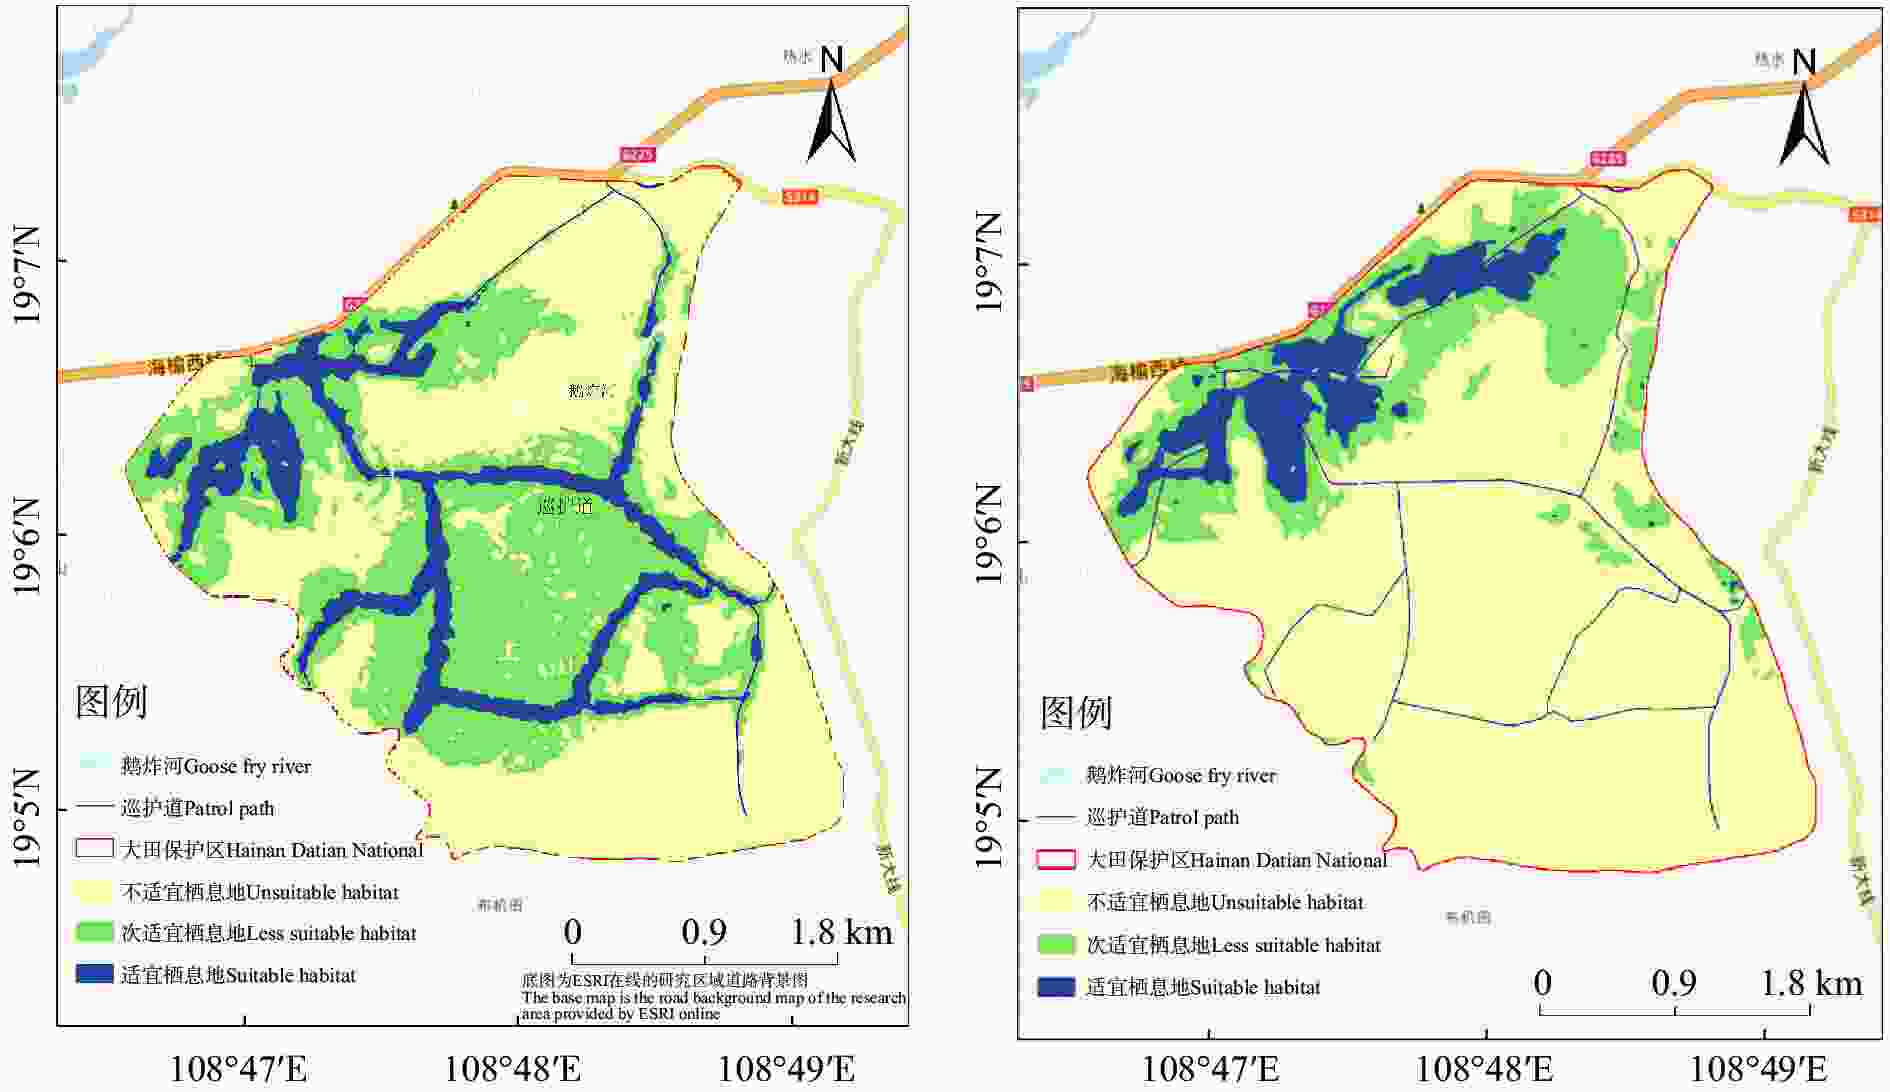
Figure 4. Distribution of suitable habitats for Red Junglefowl(left)and Chinese Francolin(right)in Hainan Datian National Nature Reserve
-
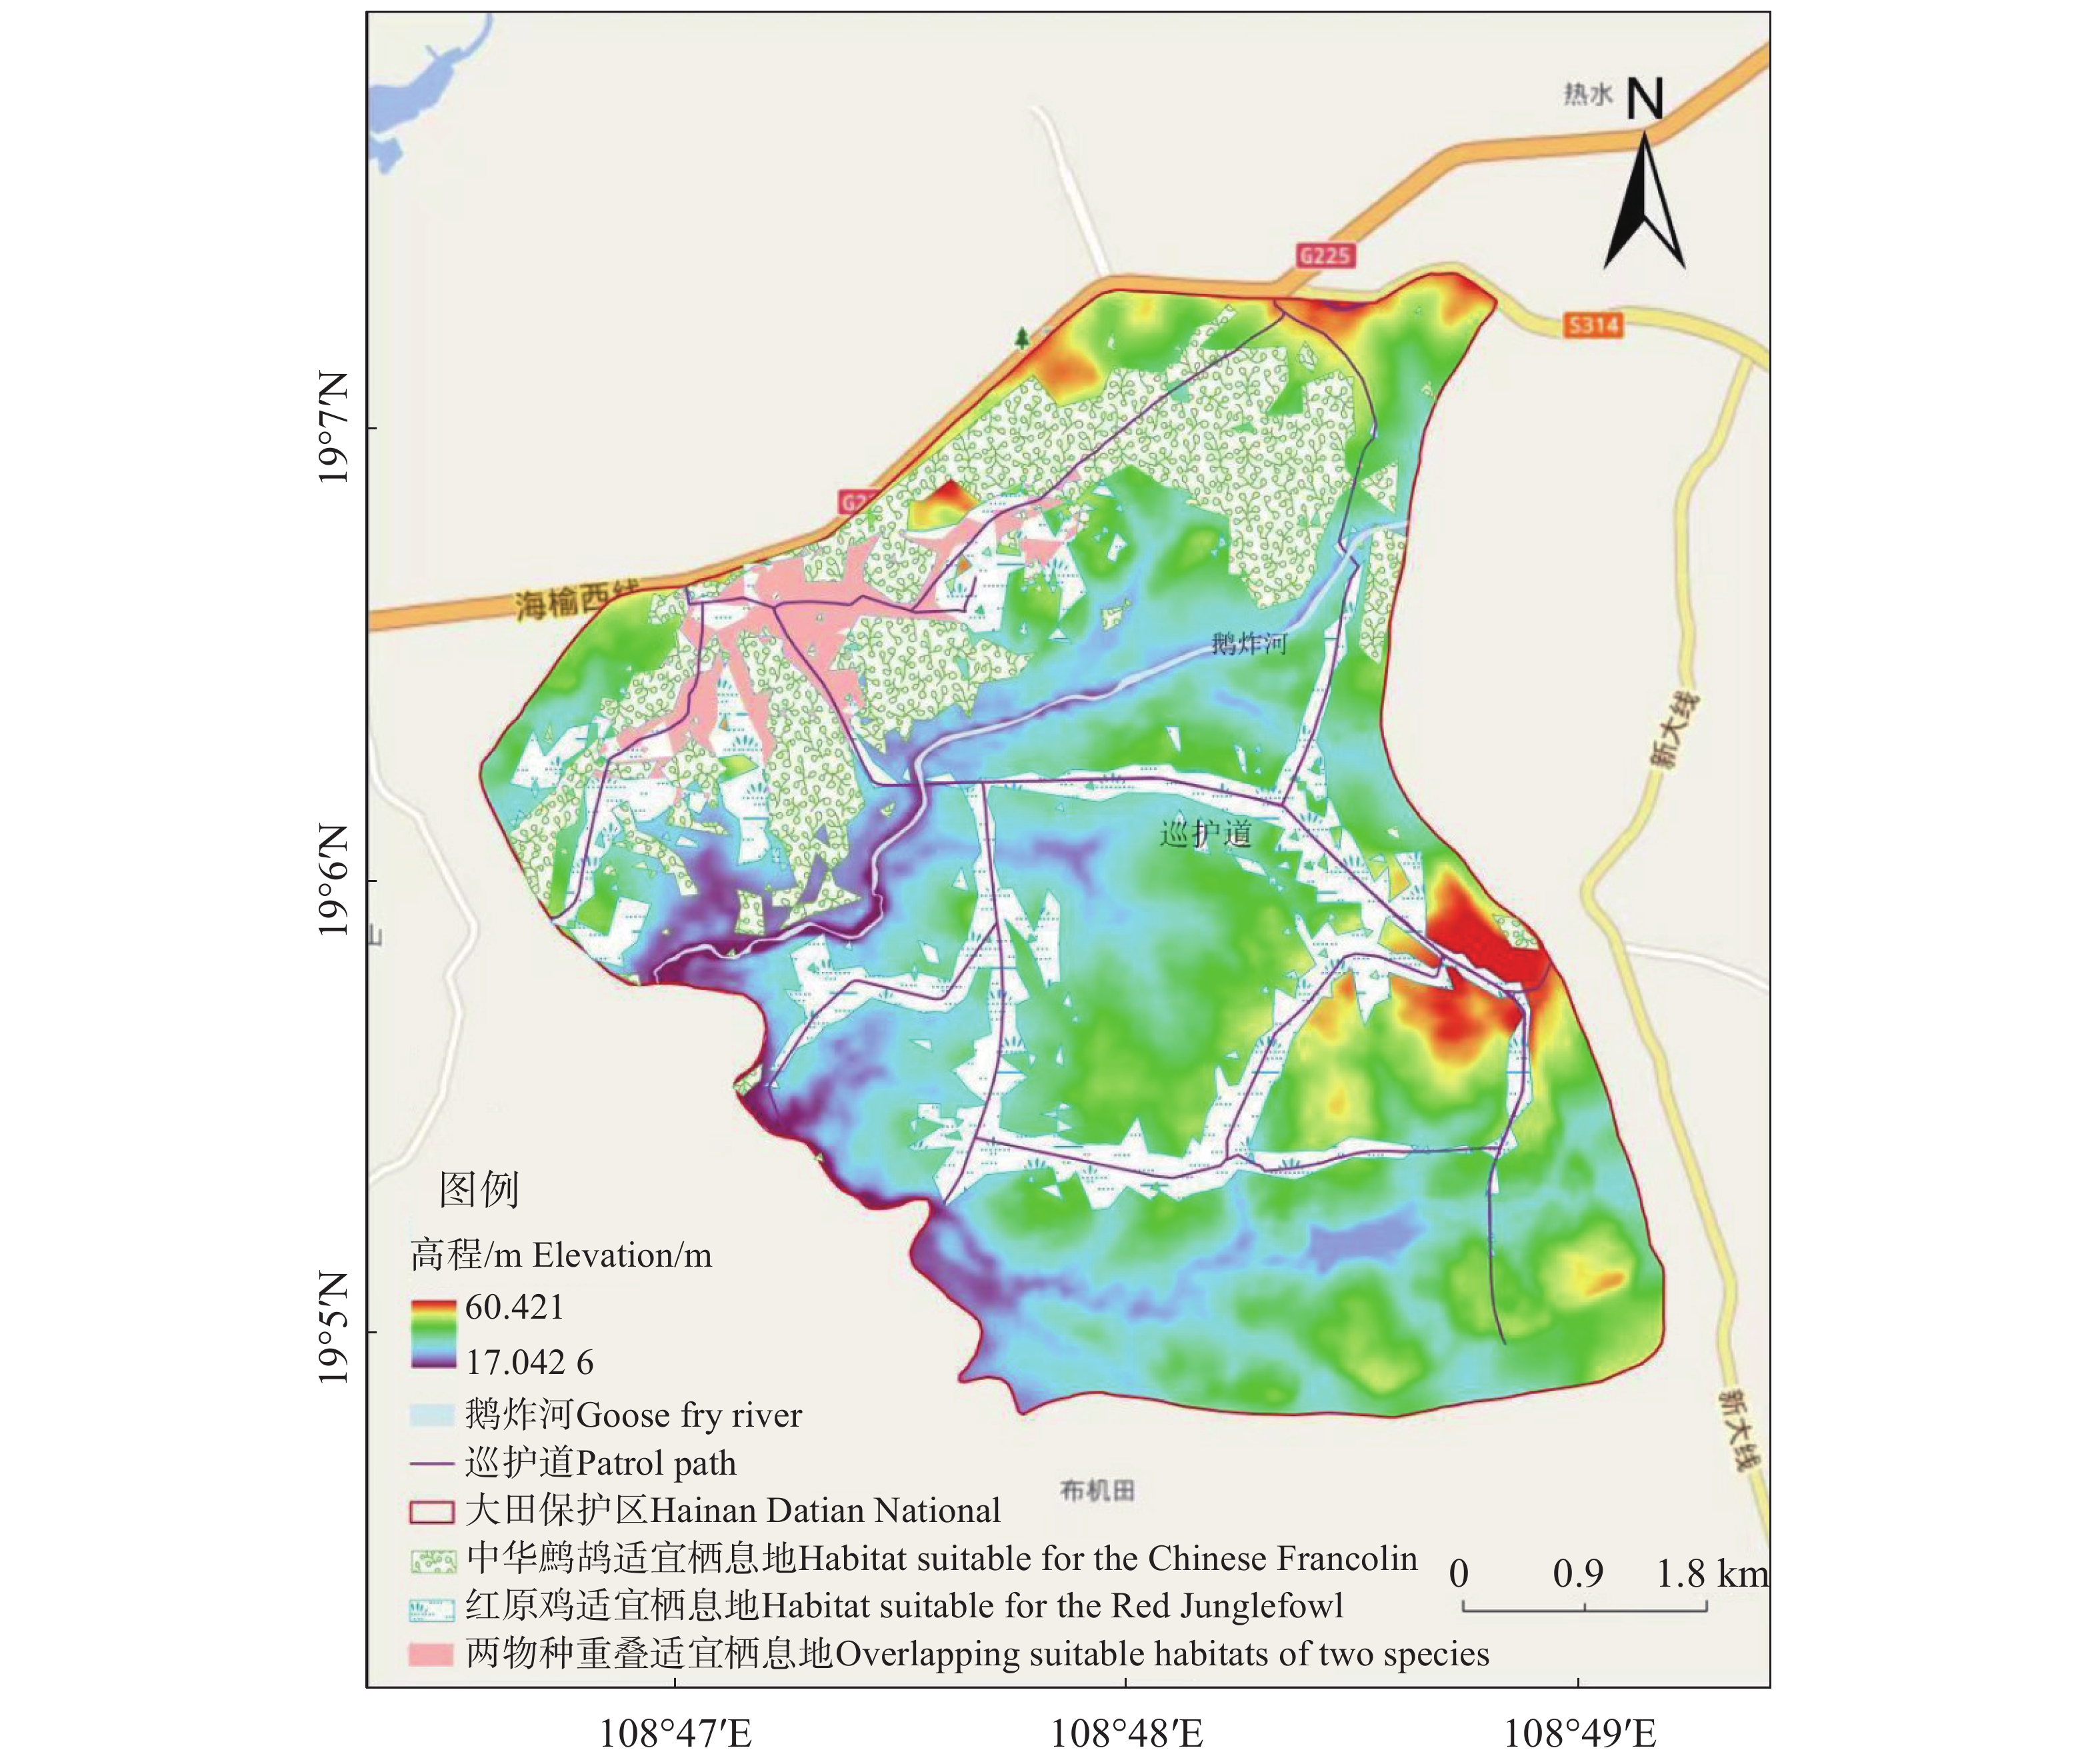
红原鸡和中华鹧鸪MaxEnt模型的最大约登指数分别为0.409和0.408,将两种雉类的模型结果二分类为适宜/非适宜生境(图5)。ENMTools软件计算得到生态位重叠指数D和I值分别为0.421和0.711。在研究区域内,红原鸡和中华鹧鸪的适宜生境面积分别为234.22 hm2和239.85 hm2。两种雉类的适宜生境重叠面积达41.31 hm2,分别占红原鸡和中华鹧鸪适宜生境面积的17.64%和17.22%。
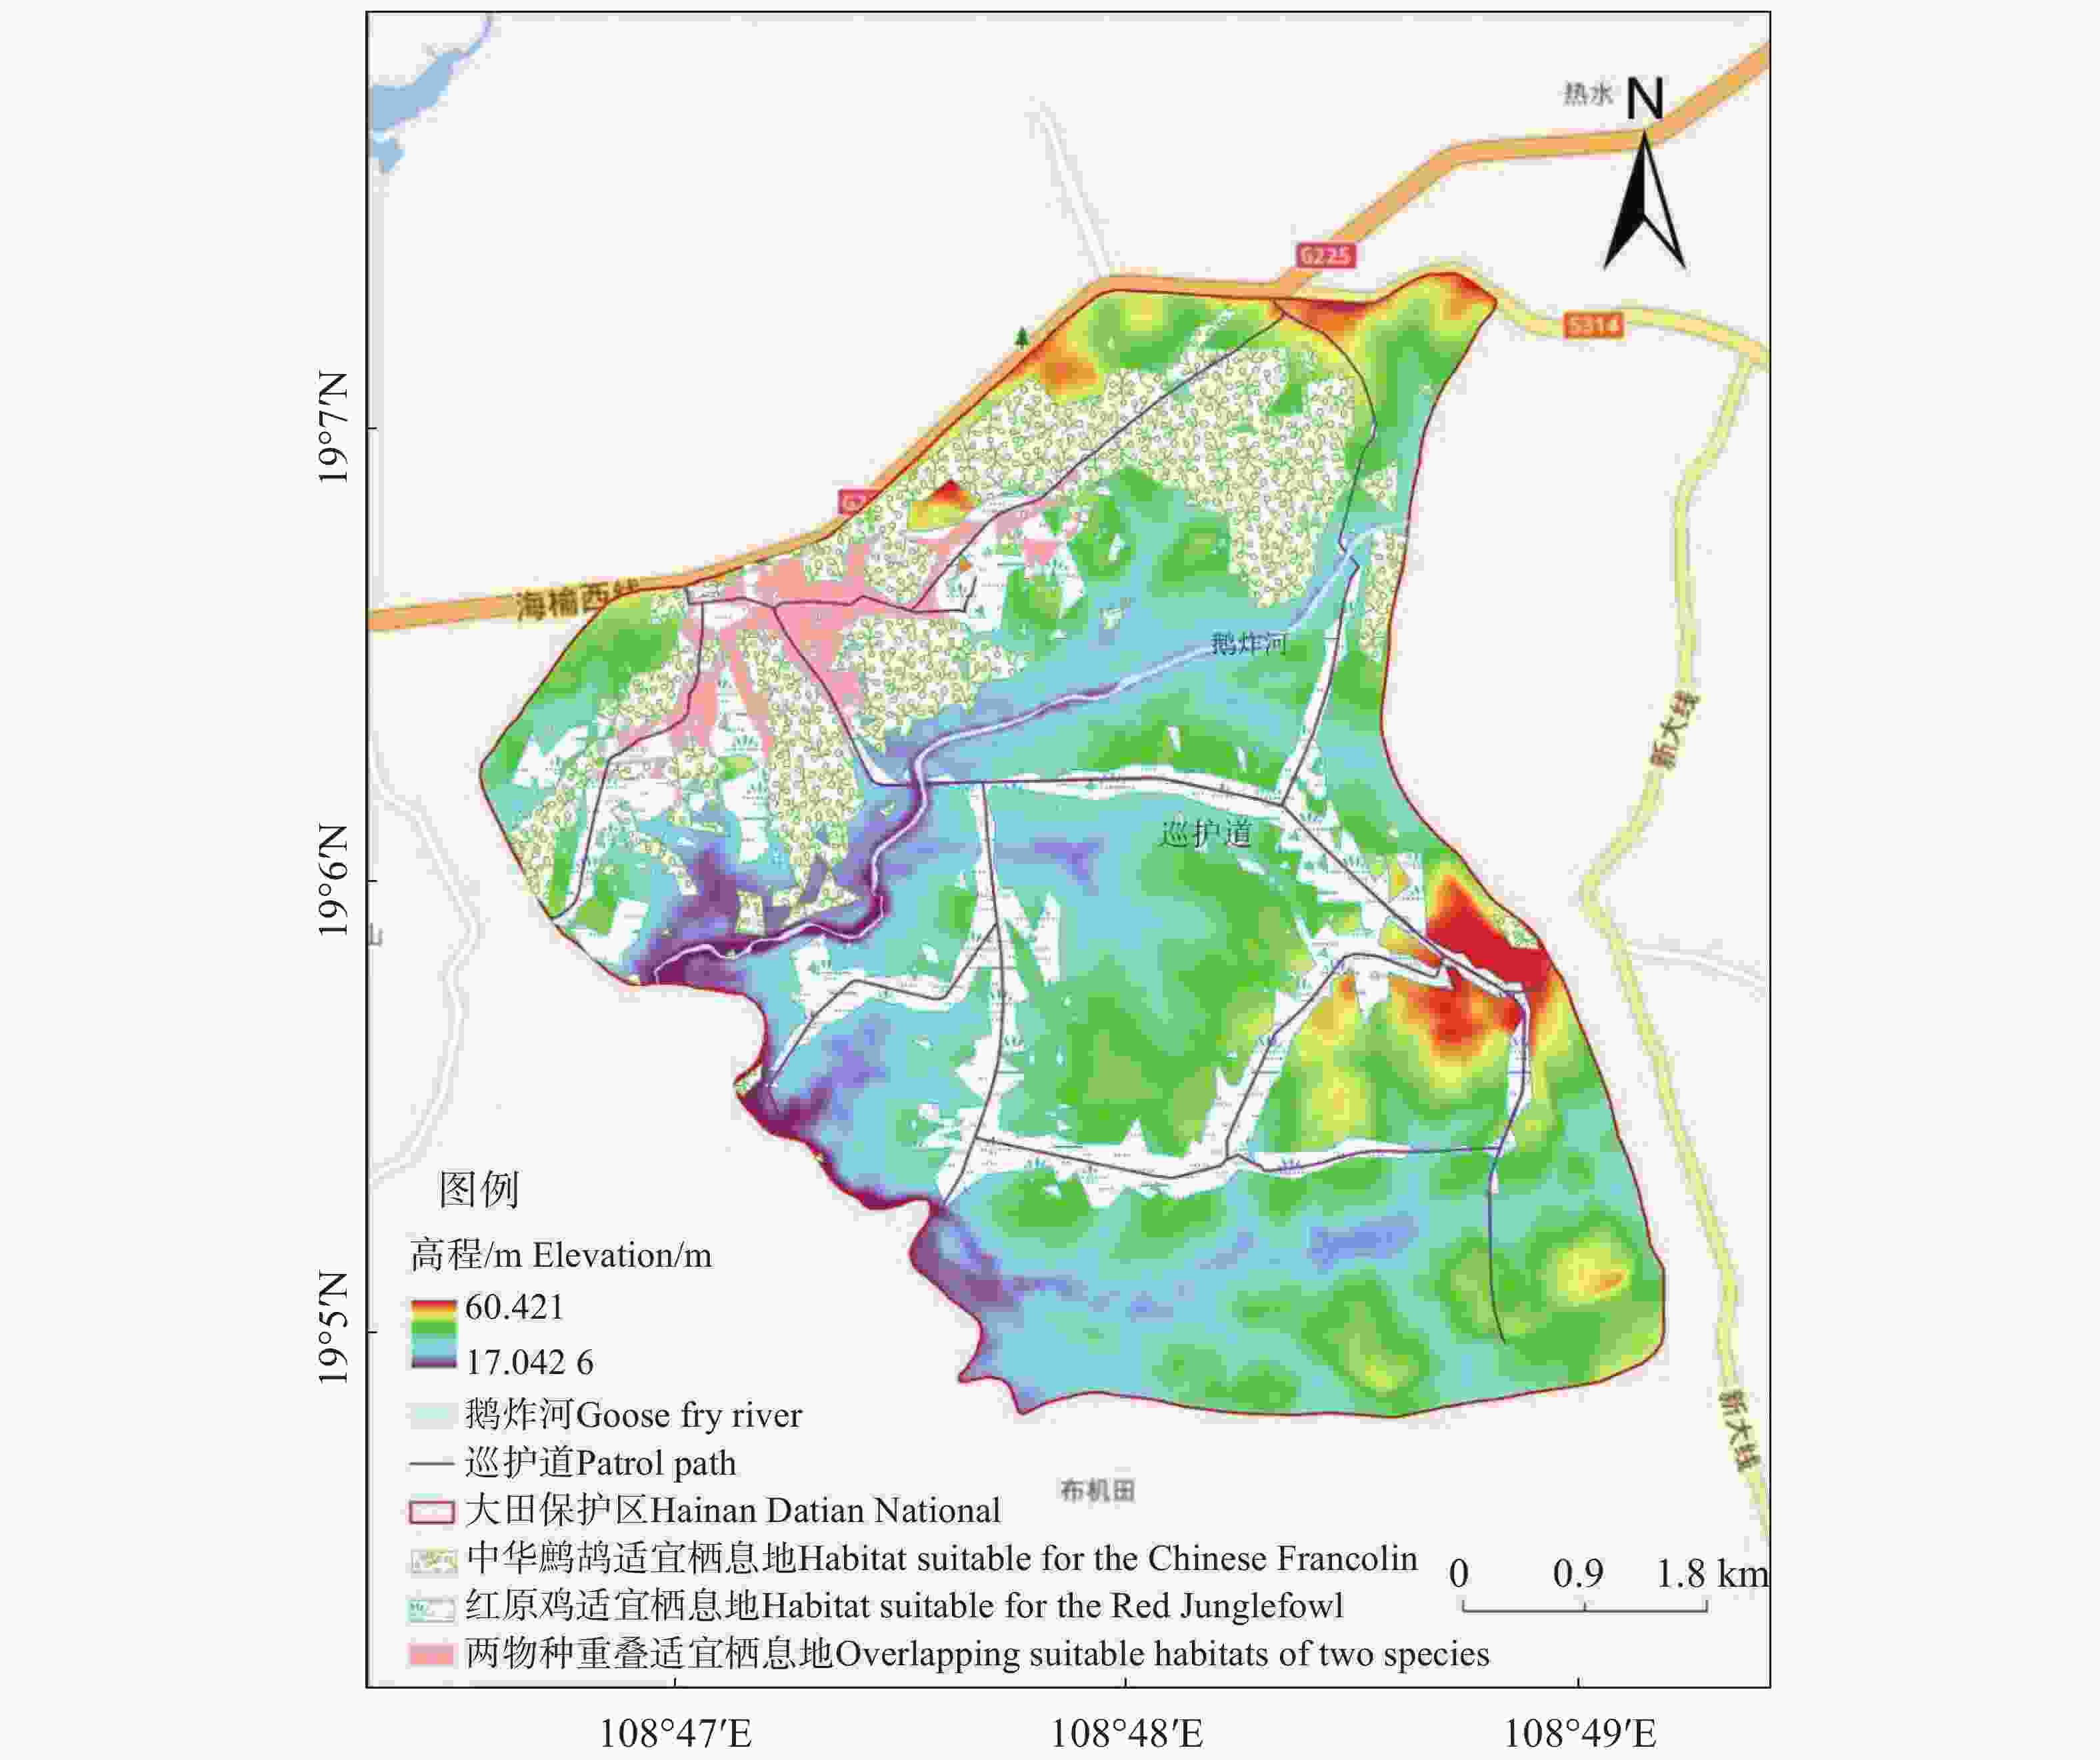
Figure 5. Overlapping distribution of suitable habitat for Red Junglefowl and Chinese Francolin in Hainan Datian National Nature Reserve
-
Jackknife检验结果表明,红原鸡和中华鹧鸪栖息地选择受到相同环境因子的影响。使用贡献率检测各环境变量对于红原鸡和中华鹧鸪分布增益的贡献,结果显示影响大田保护区内红原鸡栖息地选择的主要环境变量因子为距巡护道距离(Dtr)和距水源距离(Dtw),二者的累计贡献率达72.0%(表4),能够较好地反映红原鸡对栖息地选择的情况;影响大田保护区内中华鹧鸪栖息地选择的主要环境变量因子为归一化植被指数(NDVI)、等温性(Bio3)和距水源距离(Dtw),三者的累计贡献率达69.7%(表4),能够较好地反映中华鹧鸪对栖息地选择的情况。
变量代号
Variable code变量
Variable贡献率/%
Contribution rate/%红原鸡
Red Junglefowl中华鹧鸪
Chinese FrancolinDtr/m 距巡护道距离
Distance from patrol road58.2 6.0 Dtw/m 距水源距离
Distance from water source13.8 10.2 Altitude/m 海拔Altitude 6.3 1.7 Bio19/mm 最冷月降水
Precipitation in the coldest month5.7 2.8 Bio13/mm 最湿月降水量
Precipitation in the wettest month4.6 8.0 NDVI/d 归一化植被指数
Normalized difference vegetation index4.4 48.9 Slope/° 坡度Gradient 3.4 0.5 VF 植被类型Vegetational form 2.2 2.7 Bio3 等温性Temperature uniformity 0.8 10.6 Aspect 坡向Aspect 0.4 0.8 Bio6/℃ 最冷月最低温
The lowest temperature of the coldest month0.2 7.8 Table 4. Contribution of environmental variables
-
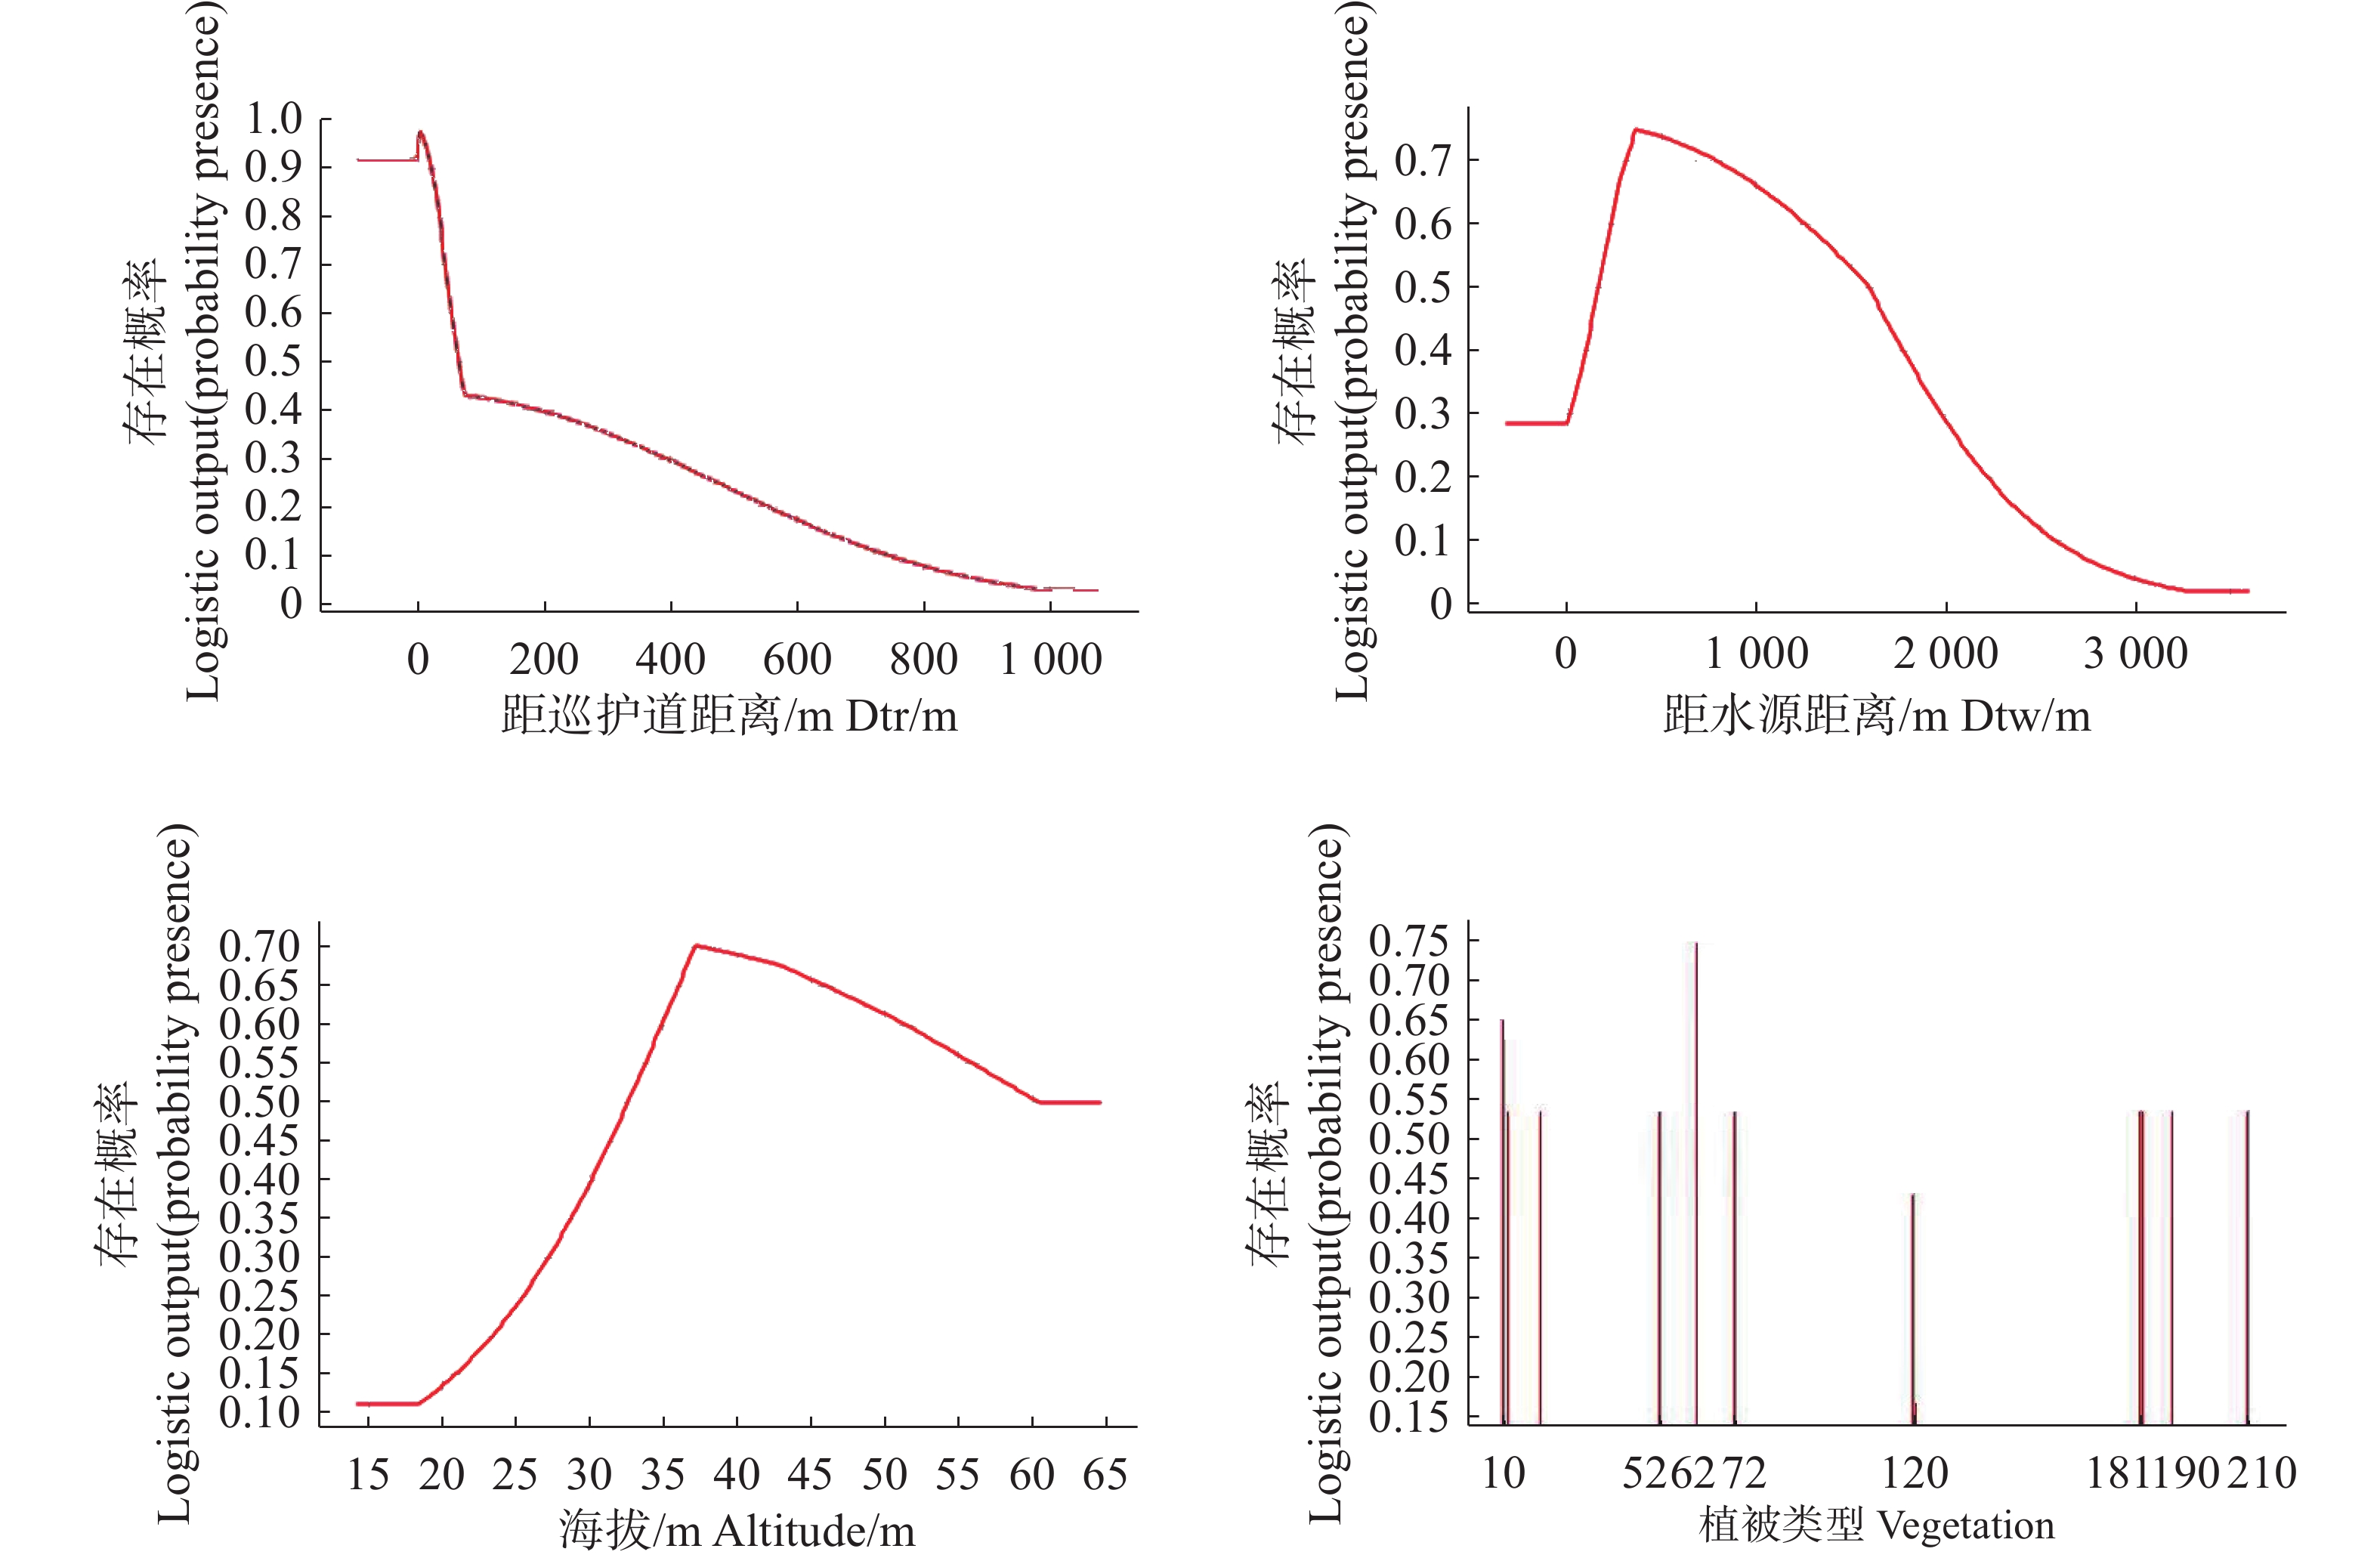
红原鸡和中华鹧鸪的潜在适宜栖息地选择随各主要环境因子数值变化而变化(图6,图7)。其中人为干扰变量距巡护道距离(58.2%)是影响红原鸡分布的主要环境因子,其分布概率随距巡护道距离(Dtr)升高而降低,主要分布于距离巡护道200 m的范围内;其次是水源和地形变量,累计贡献率为20.1%,红原鸡主要分布于距离水源400 m范围内,随水源距离的升高分布概率增加,在400 m之后随距水源距离的升高分布概率逐渐降低;海拔(Altitude)的适宜值为15~65 m,随海拔上升分布概率增加,在37 m时,达最适值,后随海拔升高分布概率降低;非连续变量植被类型的响应柱状图中灌木丛和落叶季雨林的分布概率最高,这表明在所有植被类型当中,灌木丛和落叶季雨林对红原鸡栖息地的影响最大(图6)。
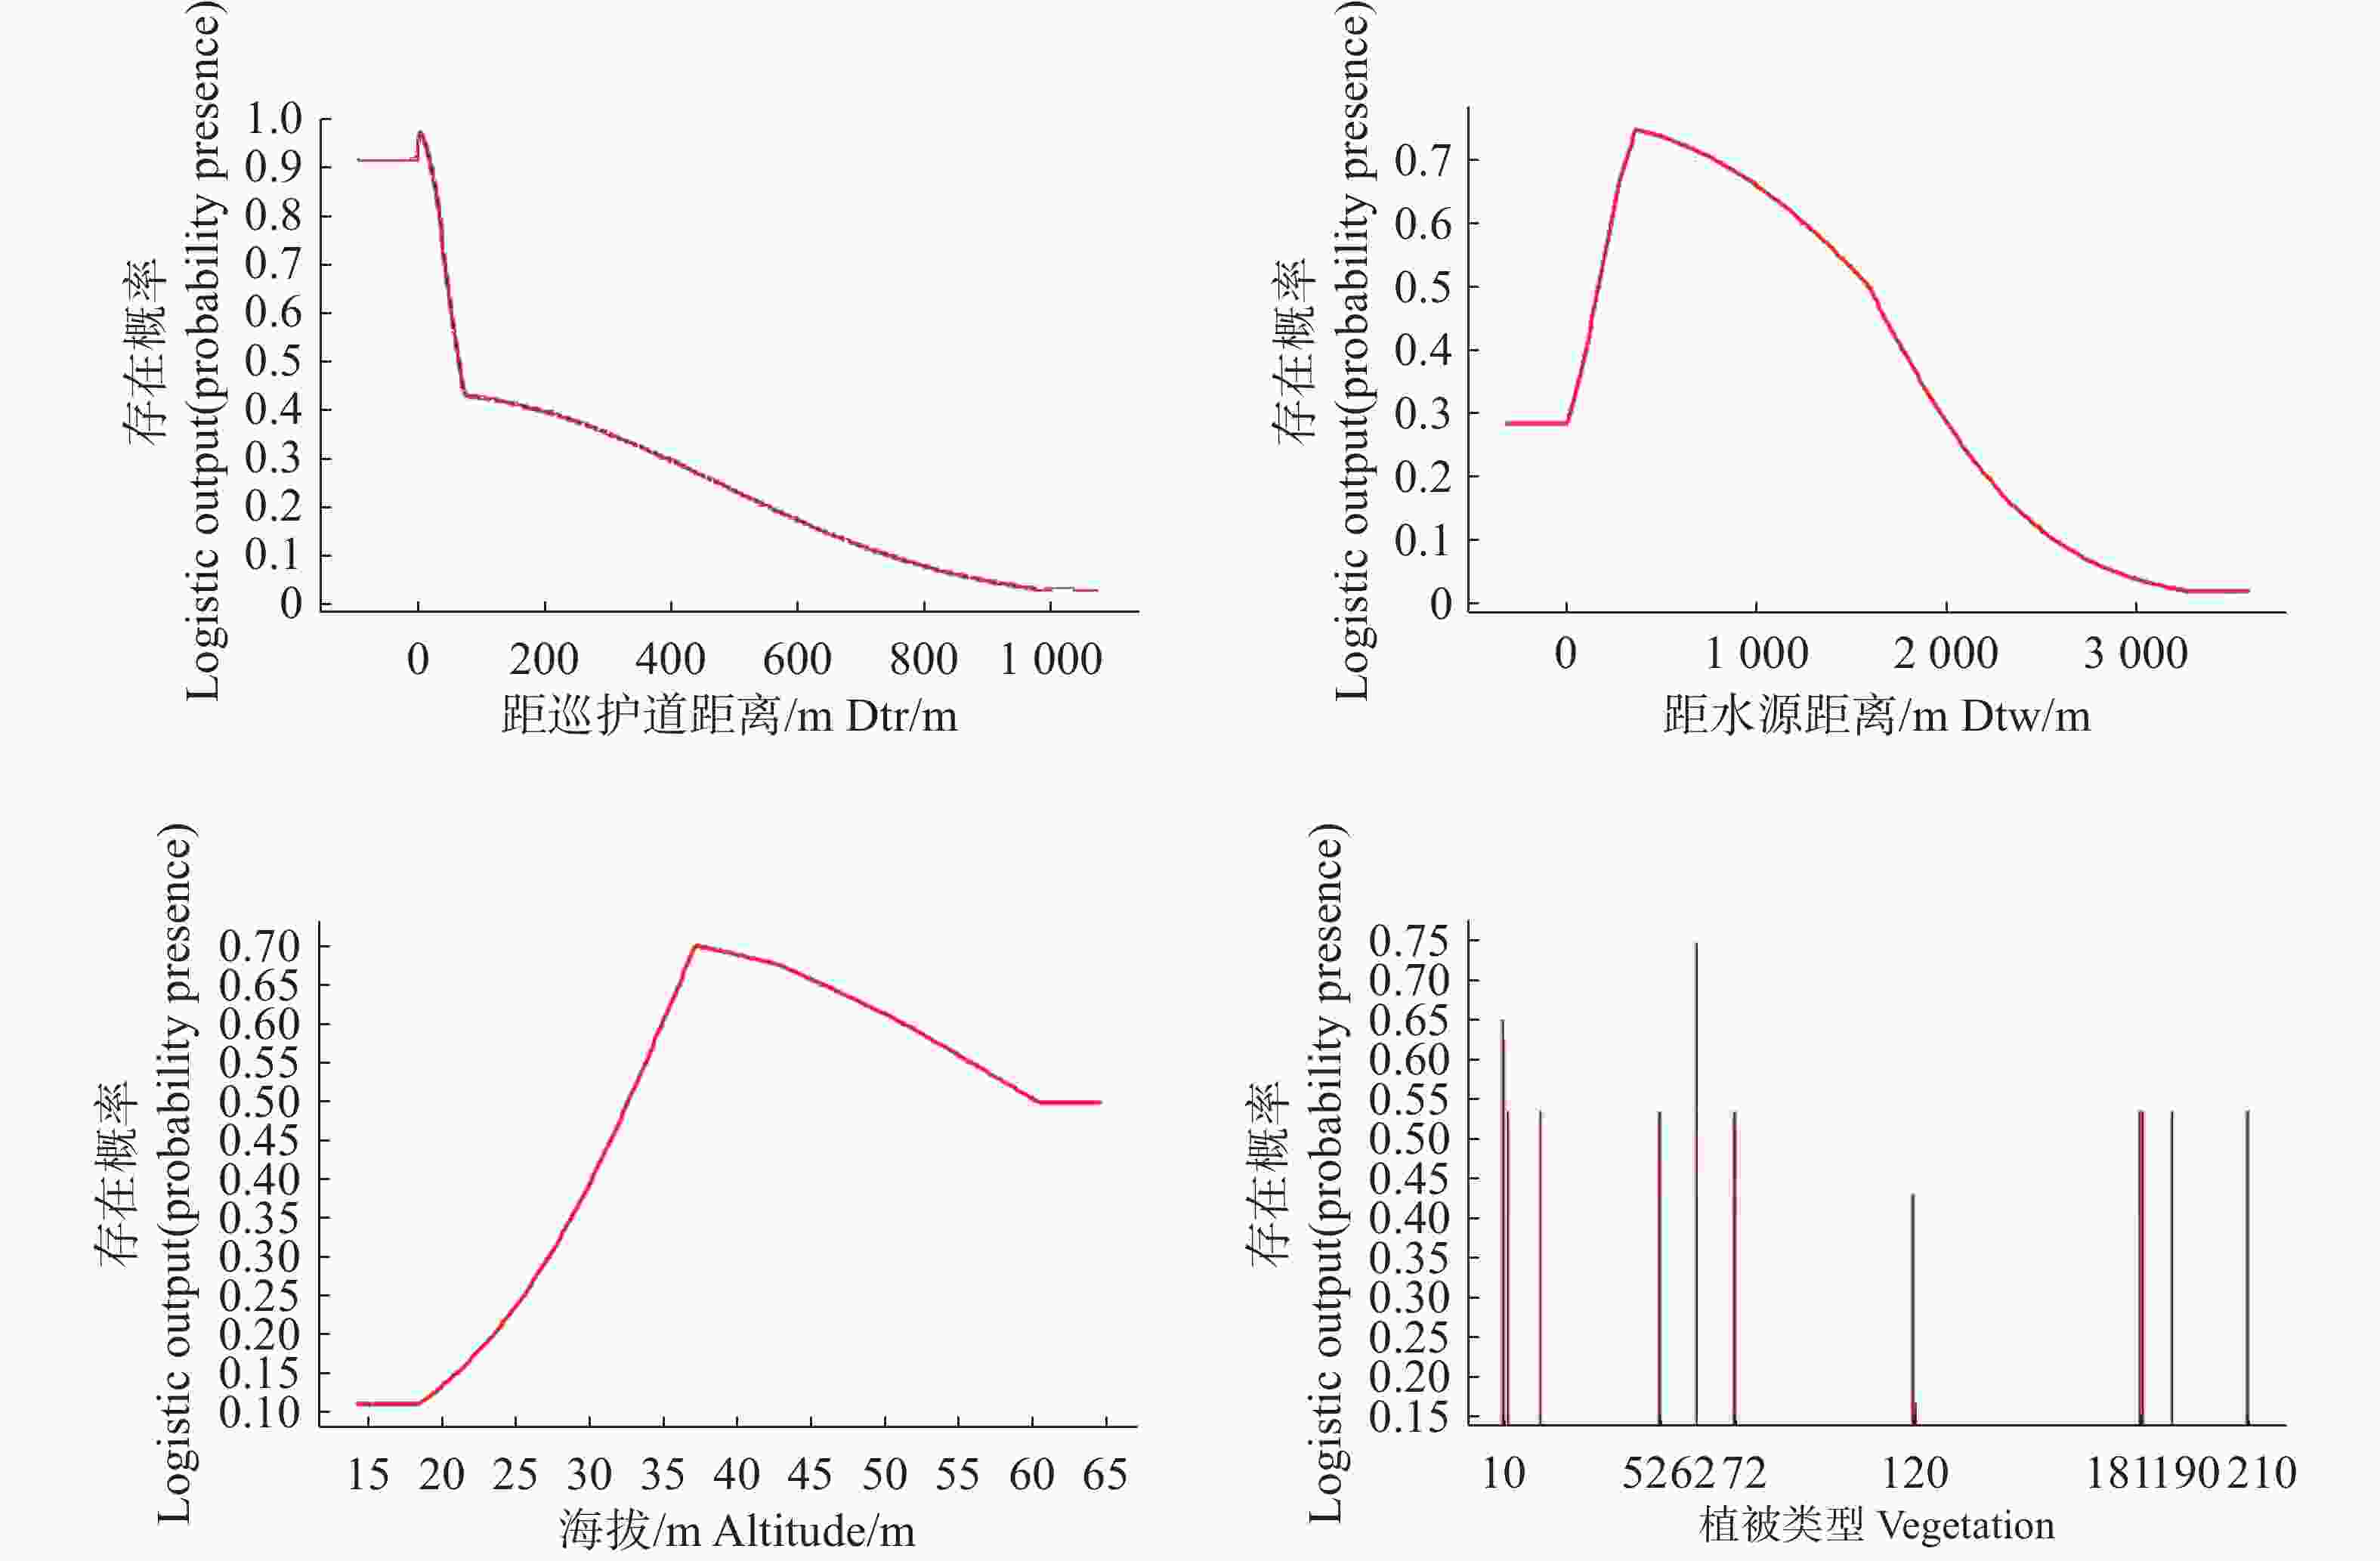
Figure 6. Response curves of major environmental factors affecting the distribution of Red Junglefowl
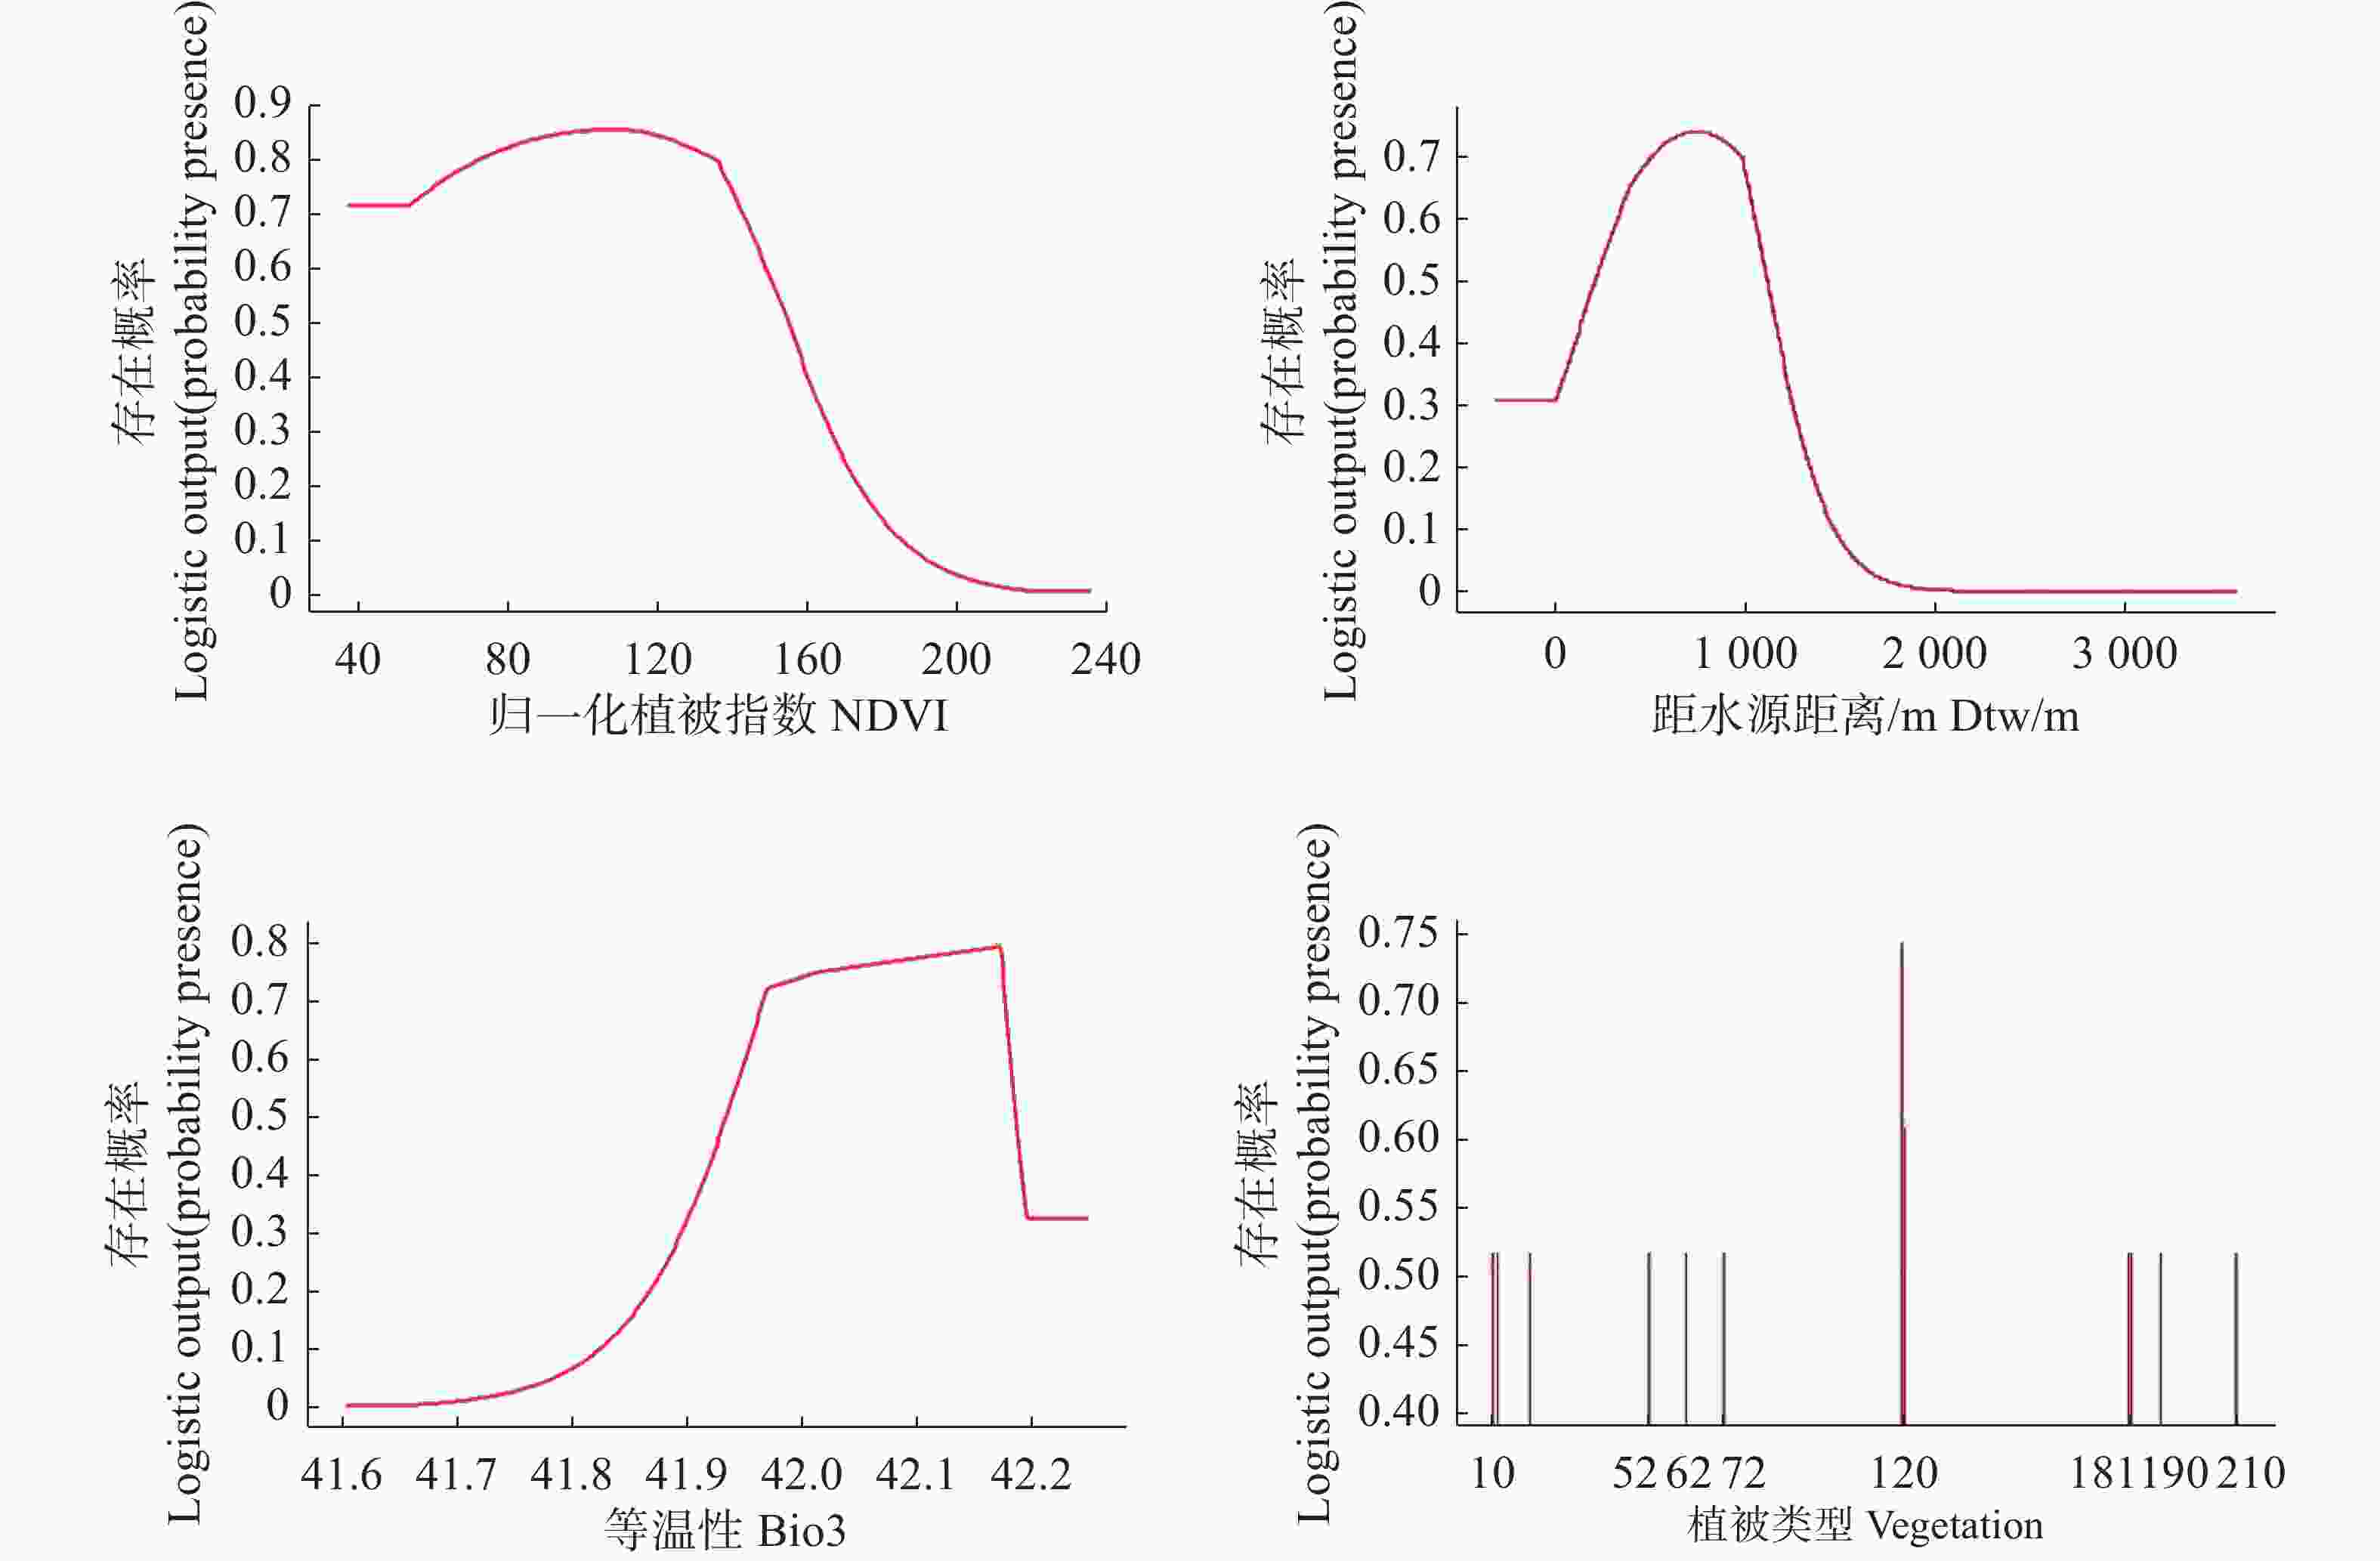
Figure 7. Response curves of major environmental factors affecting the distribution of Chinese Francolin
归一化植被指数对中华鹧鸪的分布具有较大的影响,累计贡献率为48.9%,其分布概率随归一化植被指数(NDVI)天数的增加逐渐升高,当植被覆盖天数达135 d时,其分布概率逐渐减小,主要分布于草地区域;其次是气候和水源变量,累计贡献率为20.8%,中华鹧鸪在距离水源(Dtw)500~1 000 m范围内分布概率最高,随水源距离的升高分布概率降低;等温性(Bio3)的适宜值为41.8~42.2 ℃,最适值42.0~42.18 ℃,随等温性上升分布概率增加,在42.0~42.18 ℃时,随等温性升高分布概率降低;非连续变量植被类型的响应柱状图中草地的分布概率最高,这表明在所有植被类型当中,草地对中华鹧鸪栖息地的影响最大(图7)。
-
本研究采用多种研究方法及最大熵模型对同域分布的红原鸡和中华鹧鸪的栖息地适宜性进行了综合评价。结果发现,这两种热带雉类在大田保护区发生了空间生态位分化,导致它们的适宜栖息地类型和分布区域有明显差异。同时,大田保护区内红原鸡和中华鹧鸪的适宜栖息地在空间分布上存在一定重叠。总体而言,红原鸡的适宜栖息地面积明显大于中华鹧鸪的适宜栖息地面积。
生境分化是同域分布近缘物种生态位分化最为普遍、重要的形式,其能够降低物种对空间和其他资源的竞争,促进近缘物种的相互共存[20 − 21]。大田保护区内的红原鸡和中华鹧鸪的适宜栖息地类型和分布区域存在明显差异。环境因子响应的结果表现为红原鸡适宜栖息地主要以阔叶林和靠近森林边缘的巡护道路为主,而中华鹧鸪适宜栖息地以草地区域为主。这可能与红原鸡和中华鹧鸪在生态习性上的差异性有关,中华鹧鸪主要采取隐藏觅食策略,而红原鸡则采取逃跑策略来躲避天敌和利用资源,这与它们的环境适应性有关。有研究表明,鸟类选择栖息地时会权衡隐蔽和周围环境视野[22]。中华鹧鸪为小型雉类,活动灵活,且羽色与周围环境色彩相近,形成良好的保护色。因此其更偏好于草地的生境,不依靠高隐蔽度森林来躲避敌害。另外,它们经常活动在开阔的草地区域,这有助于及时发现天敌后快速飞走的应敌策略。而红原鸡偏好于选择在阔叶林或者靠近森林边缘的巡护道活动,可能是由于体型相对于中华鹧鸪更大,且羽色与其周边环境形成明显色差。特别是雄性红原鸡,在开阔和裸露的环境更容易被发现,其被捕食的风险更高。因此,其需要在阔叶林或者靠近森林边缘的巡护道来获得隐蔽和及时逃跑林中躲避天敌。这与Li等[23]对同域分布的褐马鸡和环颈雉在微生境尺度选择差异结果相似,表现出不同的隐藏、避敌与利用资源策略。
结果表明,距巡护道距离、距水源距离和海拔是影响红原鸡宏生境选择的主要环境因子,但从关键因子来看,人为干扰因子和水源因子是影响红原鸡分布的主要关键因子。从响应曲线得出,红原鸡选择在巡护道附近分布频率较高,可能因为路边阳光充分,植被生长旺盛,从而以植物为食的昆虫增多,可为红原鸡提供丰富的食物,而道路两侧往往落叶层厚度低,更加便于红原鸡挖掘食物。本研究结果与褐马鸡取食策略相似,偏好于靠近道路边附近区域分布[24]。归一化植被指数(NDVI)、水源因子和等温性是影响中华鹧鸪分布的关键变量。当NDVI累计天数达到一定值时,中华鹧鸪表现出回避,此外,中华鹧鸪也受到等温性的强烈影响,这可能是因为温度直接影响植被的分布和季节变化[25 − 26],进而间接影响中华鹧鸪在研究区中的潜在分布。水源因子对红原鸡和中华鹧鸪栖息地的选择也具有重要影响,红原鸡相比中华鹧鸪,对水源的距离更近。表现为红原鸡倾向于距水源距离400 m范围内分布,而中华鹧鸪则主要分布于距水源1 000 m范围内分布。在水源附近常具有较高的食物丰富度,红原鸡体型较大,需要补充更多的水分和食物,因此常选择在水源附近活动。研究表明,体型较小动物对水源的需求量较小,可通过取食食物中所含的水分满足自身所需[27 − 28]。中华鹧鸪体型较小,通过食物所含水分和露水即可满足自身需求,虽也主要选择在距水源距离较近的区域内活动,但对水源距离选择性相对较弱。红原鸡与中华鹧鸪是近缘种,虽然它们在资源生态位和空间生态位有部分重叠,但存在生境分化,这为未来生境管理提供一定的参考。
生态位分化是同域分布近缘物种实现长期稳定共存的基础。根据竞争排斥原理,任何两个物种一般不能处于同一个生态位,同域分布的近缘物种必须至少有一个生态位维度的分化才能实现长期稳定共存[1]。结果表明,红原鸡和中华鹧鸪在空间生态位的利用存在差异性以实现长期稳定共存,这与对小相岭山系同域分布的血雉(Ithaginis cruentus)和红腹角雉(Tragopan temminckii)[29]和对云南省玉溪市新平和峨山交界处同域分布的绿孔雀(Pavo muticus)和白鹇(Lophura nycthemera)[30]的时空生态位分化研究结果相同。在长期自然进化过程中,每个物种均趋向于占据独特的生态位并尽量减少与同域分布其他物种生态位重叠程度[5,31]。在大田保护区红原鸡和中华鹧鸪的空间分布上适宜栖息地重叠面积少,重叠程度较低,空间生态位分化可能是两个物种共存的原因之一。然而有些同域分布物种间适宜栖息地存在高度重叠,在宏生境尺度上并没有发生明显的空间生态位分化,仅通过宏生境空间生态位的分化已无法满足同域共存的需求,因此需要通过调整其他维度生态位分化,以缓解对有限资源的竞争。例如时间生态位或营养生态位[10, 23 − 24, 28, 32 − 33]。
在大田保护区,红原鸡和中华鹧鸪是海南坡鹿的主要伴生物种。了解这两种地栖性雉类在栖息地选择和对环境因素的响应方面的差异,对于理解近缘物种的种间竞争与共存动态,制定科学的保护管理策略具有重要意义。本研究结果可能存在一些不足之处,例如红原鸡的最适宜栖息地大多分布在巡护道附近,这可能与样线调查分布位点多集中在巡护道附近和环境变量的选择有关。后期应结合红外相机技术获取两个物种的分布点数据以全面掌握潜在栖息地分布。同时,为了更全面地了解两种雉类的种间竞争和共存机制,包括微生境尺度、时间生态位和营养生态位,在更精细的尺度上和多生态位维度进行深入探讨将是未来研究的重点。
Habitat suitability evaluation and overlap analysis of sympatric Red Junglefowl and Chinese Francolin
DOI: 10.15886/j.cnki.rdswxb.20240073
- Received Date: 2024-04-30
- Accepted Date: 2025-01-03
- Rev Recd Date: 2024-10-23
- Available Online: 2025-04-15
- Publish Date: 2025-05-25
-
Key words:
- Gallus gallus jabouillei /
- Francolinus pintadeanus /
- sympatric distribution /
- niche differentiation /
- MaxEnt model /
- suitable habitat /
- habitat overlap
Abstract: Exploring the spatial ecological niche delineation between co-distributed proximate species is crucial to understand their coexistence in the community. A survey of two species of pheasants, Red Junglefowl (Gallus gallus jabouillei) and Chinese Francolin (Francolinus pintadeanus), were made at 105 and 79 distribution sites in Datian National Nature Reserve, Hainan, from March 2023 to January 2024, respectively, using the line transect method and satellite tracking technology. A maximum entropy model was used to predict the suitable habitats for these two species of pheasants by combining 12 environmental variables, and analyze their overlap. The results showed that there are differences in the distribution patterns of suitable habitats for the two species of pheasants. The suitable habitat for the Red Junglefowl was located in the north-western and central parts of the reserve, which are dominated by deciduous broad-leaved and scrub forests, while the suitable habitat of the Chinese Francolin was located in the northern part of the reserve, and was mainly in the grass area. The potential suitable habitats of the two species of pheasants were 633.18 hm2 and 337.31 hm2, accounting for 48.61% and 25.89% of the area of the reserve, respectively. The ecological overlap indices of the Red Junglefowl and the Chinese Francolin were low, with D and I values being 0.421 and 0.711, respectively, and the overlapping area of suitable habitat was 41.31 hm2, which accounted for 17.64% and 17.22% of the area of the suitable habitats for the Red Junglefowl and the Chinese Francolin, respectively. There were similarities and differences in the selection of environmental factors by the two species. Differences lie in the fact that the variables with the greatest influence on the habitat distribution of the two species of pheasants were the distance from the ranger path and the normalized difference vegetation index (NDVI), which are mainly manifested in the fact that the Red Junglefowl preferred deciduous broad-leaved forests and scrubs near the ranger paths, whereas the Chinese Francolin was more influenced by the NDVI; similarities lie in the fact that the variable with the second highest influence on the habitat distribution of the two species of pheasants was the distance from the water source, which was manifested in the fact that the Red Junglefowl and the Chinese Francolin preferred to distribute within 400 m and 500~
| Citation: | WU Guanmian, ZENG Qingling, DING Yishuo, XU Yuxin, RAO Xiaodong. Habitat suitability evaluation and overlap analysis of sympatric Red Junglefowl and Chinese Francolin[J]. Journal of Tropical Biology, 2025, 16(3): 475-486. doi: 10.15886/j.cnki.rdswxb.20240073

|
 DownLoad: