-
海草是地球上唯一一类可以完全生活在海水中的被子植物,广泛分布于全球温带和热带海岸地区,沿海岸线的分布范围长达几千公里[1]。在热带海洋植物系统中,“海草床”是地球生物圈中生产力最高、最具服务功能价值的生态系统之一,但也是受保护程度最低的生态系统之一 [2]。根据调查研究资料,海南省共有海草种类7属11种,分布于海南近岸的文昌、琼海、陵水、三亚和澄迈及南沙群岛和西沙群岛 [3]。植物地上地下资源分配反映了植物生存、生长和繁殖过程的生态系统功能[4],以及植物对环境变化的响应过程[5]。当气候、土壤、采食及干扰等环境因素发生变化,植物为了抵抗外界环境扰动,主动调整自身适应策略[6]。诸多研究表明,对海草生长、繁殖、存活及资源利用有影响的地上地下资源分配格局备受关注[7]。海草通过生物量分配格局的改变来响应生境的异质性,以提高自身的同化效率[8],更好地获取生长、发育和繁殖所需的水分、温度、光照、养分等资源[9-10],海草植物体中化学元素的循环是能量流动和物质循环的重要组成部分,例如碳氮比会影响海草的循环速率导致整个海洋生态系统的生物地球化学循环会受到影响[11-12]。草食作用对海草的影响是不可忽视的[13]。在海草床中食草动物群落的多样性会导致海草草甸结构产生相应变化。这些食草动物主要包括底栖动物(多毛类、寡毛类和腹足类)、浮游动物、植食性鱼类和龟类、虾、螃蟹以及小型肉食性鱼类、海胆、海龟和水禽等,它们多数情况下以生长在海草叶子上的附生藻类为食,但也会以海草叶子为食[14]。研究表明,草食动物的采食通常会使海草形态和结构发生变化[15],不同草食动物对海草的采食方式以及采食强度的差异性,使海草床生产力对草食作用表现出提高或降低的不同响应[16]。部分植食性鱼类可通过取食叶片对海草造成极大损害[17-18],例如损伤海草的光合组织,降低地上生物量等[19],另外,草食作用会改变海草的有机物、营养元素的分配,从而影响海草的生长状况,但不同海草物种会通过改变不同生存策略对抗草食动物的采食,以保证其正常生长。近年来,国内海草床退化的速度远高于全球海草床衰退的平均速率,海草床的退化对海南岛的近岸海洋生态系统产生了严重的影响。海草对海洋生态系统物质循环的重要性、海草资源分配方式与草食动物之间相互作用机制方面还缺乏深入研究。因此本研究以海南优势海草泰来草(Thalassia hemprichii)作为研究对象,通过设置排除不同类别的海草采食的野外原位控制试验,利用泰来草地上地下资源分配的变化,探究海草在草食压力下的响应对策和机制,旨在为海草的恢复提供新的技术依据和理论指导,提升滨海生态系统固碳潜力。
-
海南岛面积 3.39万 km2,属海洋性热带季风气候 ,年平均温度为 22~26 ℃,年均降水1 600 mm 以上,独特的地理位置及气候极大地丰富了海南岛周边海草床资源[20-21]。海南省调查到海草共有7属11种,优势种为泰来草与海菖蒲,种类数量呈现东部多、北部与南部少的特点[22]。本研究将样地设置在海南省文昌市会文镇边海村附近海域(19°25′22″E,110°45′22″N),沉积物底质以碳酸盐基质为主,海草种类以植株中等的泰来草、植株高大的海菖蒲(Enhalus acoroides)为主,以斑块状的形式进行分布,其次是植株矮小、叶片呈椭圆形的卵叶喜盐草(Halophila ovalis)[23]。
-
草食动物排除试验样地布置在文昌市会文镇边海村附近海域,距离海岸约1 km的位置。依据实际主要分布海草种类,选择海南优势海草泰来草为主的斑块布置草食动物排除试验。
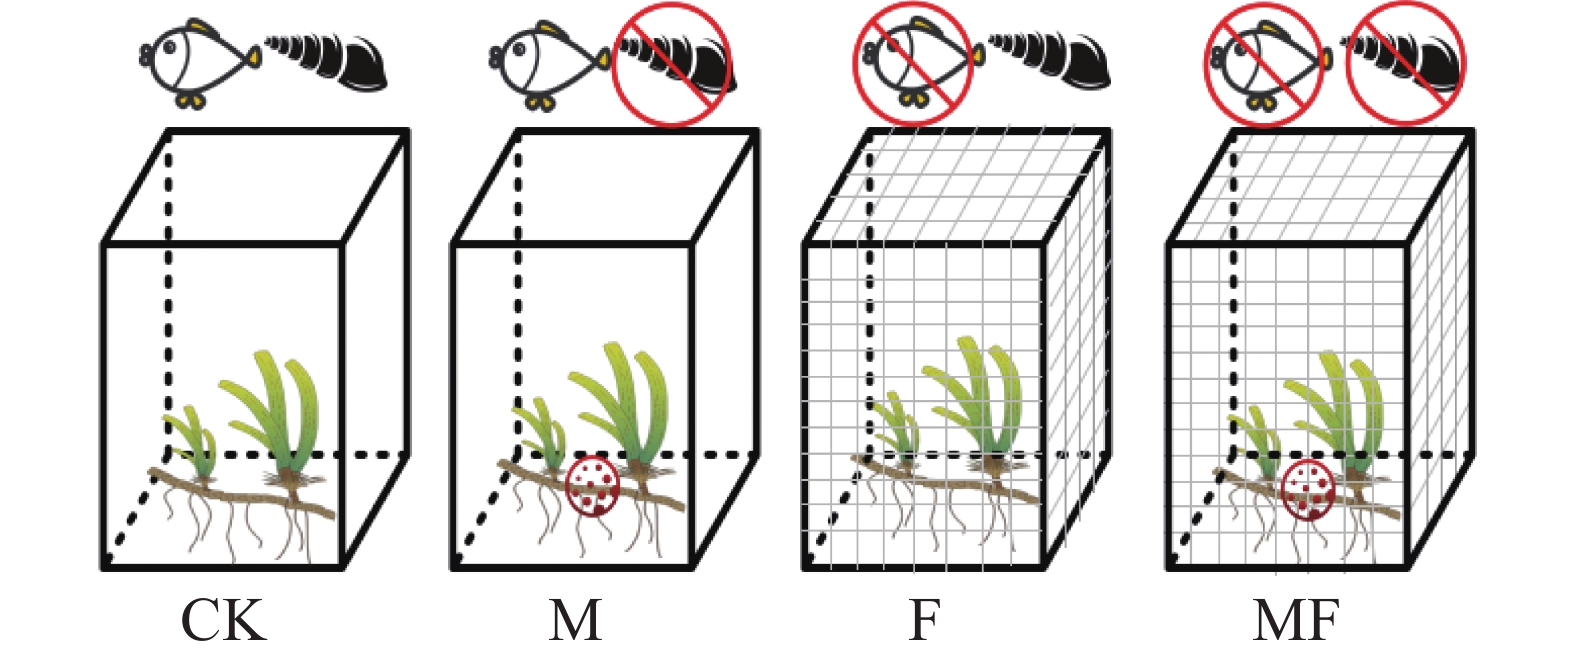
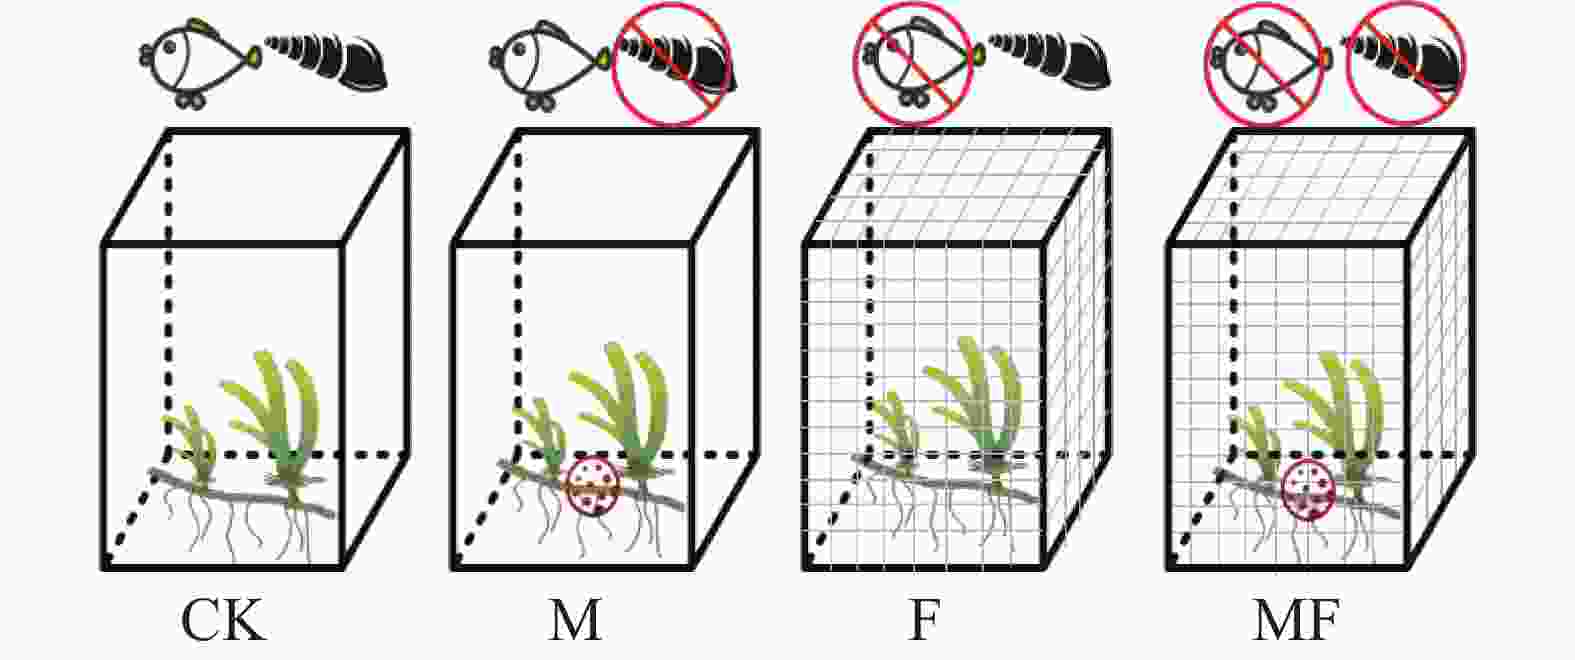
2021年5月开始,连续进行3个月的原位控制试验,此时海域处于禁渔期,排除了人为干扰,在样地设置3个试验亚区,分别为S1、S2、S3,亚区与亚区之间相隔1.0~1.5 km,由于泰来草斑块状的分布状况,导致亚区面积不固定,在每个亚区范围内随机布置4种草食作用处理,根据隔离笼、化学驱逐剂[24]的不同组合用来排除不同类型消费者对海草的采食,试验因素为草食消费者,试验处理如图1所示,分别为:CK空白对照组(不排除消费者);M放置化学驱逐剂组(排除腹足类消费者);F放置隔离笼组(排除鱼类消费者);MF放置化学驱逐剂与隔离笼组(排除两类消费者);每个亚区中每种处理设置3个重复,每种处理共9个重复;其中隔离笼使用PVC管搭建框架,用网眼为1 cm的渔网固定在PVC框架上;化学驱逐剂由97%的西维因156 g混合240 g硫酸钙加入140 mL去离子水配制而成,将配置好的驱逐剂每20 g用纱布包裹好绑在M和MF处理的隔离笼最底部靠近沉积物的位置,更好地驱逐腹足类消费者,西维因是一种氨基甲酸酯类农药,可用于海洋环境,在海水和阳光中通过水解、光解和细菌作用快速降解,半衰期为5 h,对泰来草生长影响较小。
-
试验布设于2021年5月初,自5月中旬开始采样至8月,每月选择大潮退潮时进行采样,采用挖掘法对3个试验亚区中每个处理的海草进行采集,并将海草放入自封袋中并使用装有冰袋的恒温箱将样品及时运回实验室进行处理和实验测定。将海草进行清水冲洗并将每株海草分成地上部分与地下部分测量其鲜质量,随后分别将地上部分与地下部分放于85 ℃烘箱烘干48 h后进行称重,精确到小数点后2位,得到泰来草干质量即生物量,根冠比则是地下部分干质量与地上部分干质量的比值。其中,海草有机碳含量采用 H2SO4-K2Cr2O7 外加热法测定[25],全氮和全磷含量采用半微量凯氏法提取[26]后用全自动流动分析仪测定(Proxima1022/1/1,爱利安斯科学仪器公司,法国)。
-
采用IBM SPSS Statistics R26.0.0.0 64位版本对数据进行处理和分析,不同处理对泰来草根冠比、生物量、元素含量的差异采用双因素方差分析(two-way ANVOA)和新复极差法(Duncan's new multiple range test)进行检验,P<0.05,结果以均值±标准误差进行表示并做可视化处理。采用Origin Pro 2021(64-bit)9.8.0.200软件进行图像绘制。
-
2021年6月的MF处理下泰来草的根冠比最高,7月M处理下根冠比最高,8月CK处理下根冠比最高,由表1可知,不同处理对海草根冠比有一定的影响,但泰来草的根冠比在不同处理之间没有显著性差异(P>0.05);根冠比受时间影响较大,随着时间变化,根冠比呈现出显著性增加的趋势,4种处理下的根冠比在8月均显著高于6、7月(P<0.05)。
时间 CK M F MF 6月 2.61±0.76BCa 2.56±0.85Ba 2.39±0.26Ba 2.81±0.60Ba 7月 3.28±0.59Ba 4.22±1.12Ba 2.92±0.52Ba 3.41±0.51Ba 8月 8.68±0.77Aa 7.64±1.49Aa 8.50±0.91Aa 8.41±1.95Aa 注:不同小写字母表示同一时间不同处理间的差异显著性(P<0.05),不同大写字母同一处理不同月份间的差异显著性(P<0.05),下同。 -
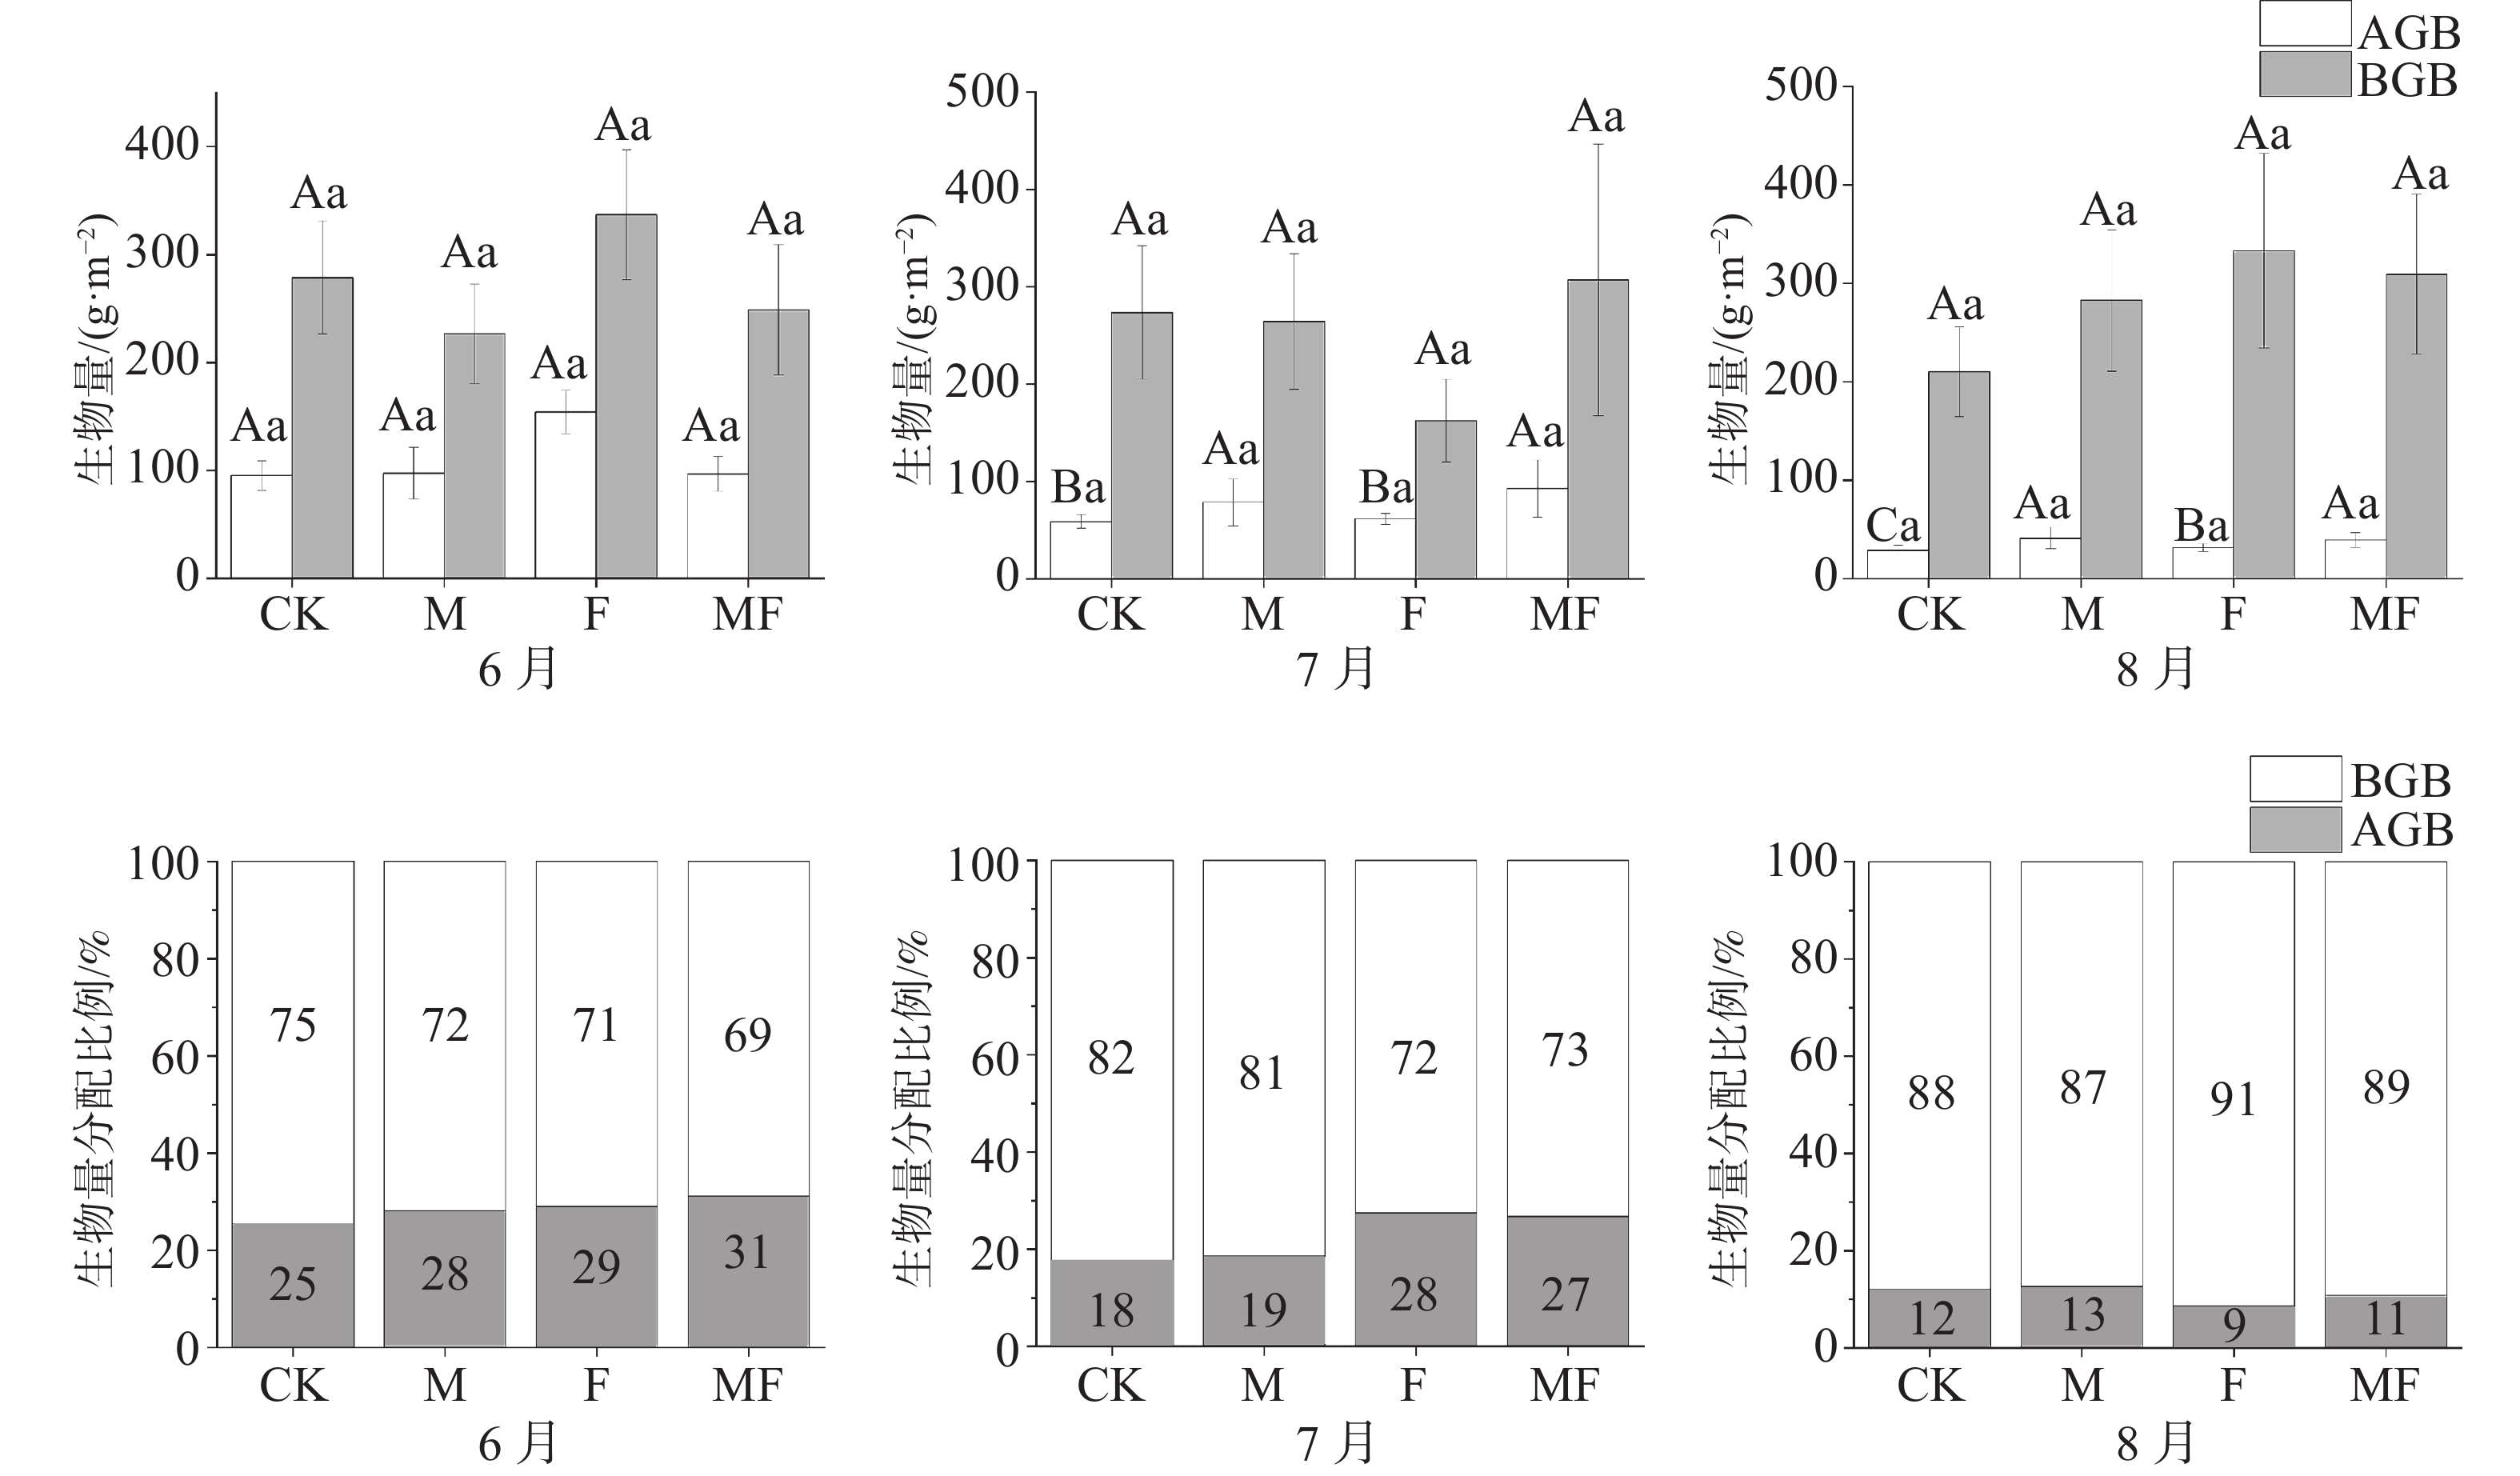
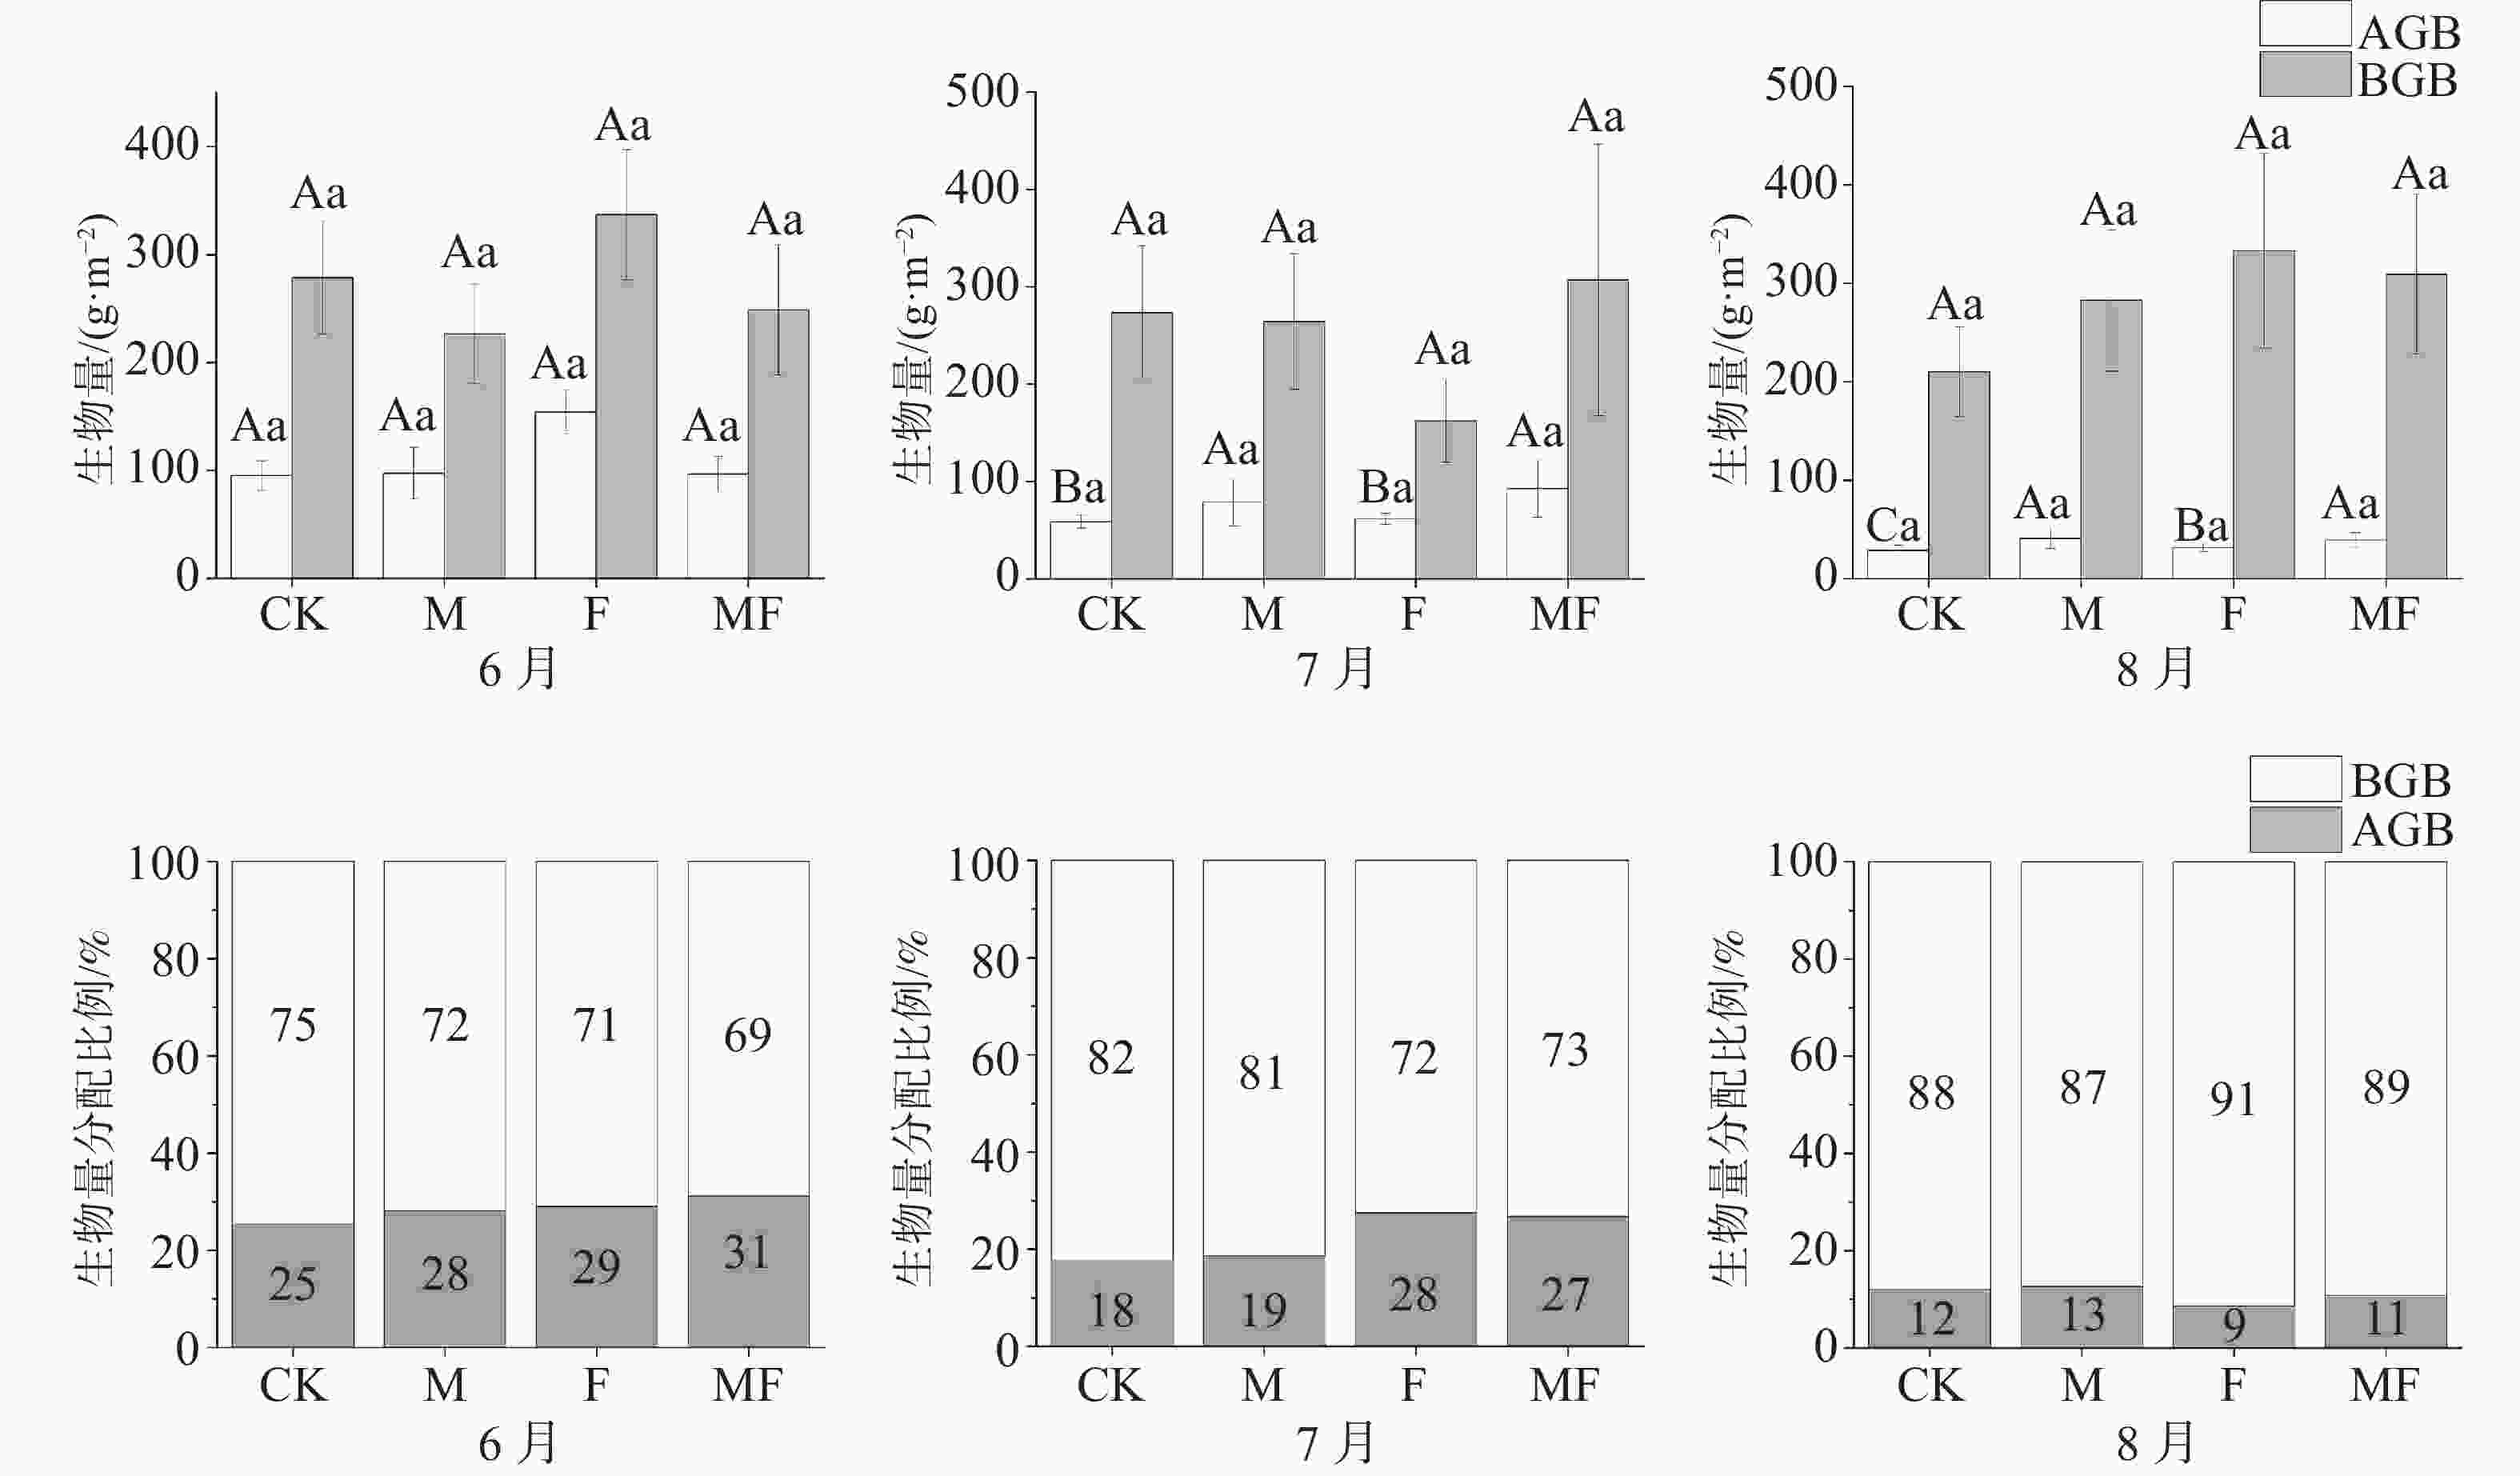
泰来草的地上部分生物量(AGB)、地下部分生物量(BGB)表现出随着草食作用的变化而变化, AGB随着排除物种的增加而表现出增加的趋势,在6、7、8月中,排除两类消费者的MF处理的AGB为(96.71±16.20)、(92.75±29.25)、(38.99±7.44) g·m−2,均大于CK处理(95.24±13.57)、(58.86±6.94)、(28.84±4.90) g·m−2。6月的F处理与其他月份之间存在显著性差异,其他处理随时间变化不明显,且处理之间无显著性差异。但AGB在4种处理下随着时间变化呈现出整体下降的趋势。不同处理和时间对BGB的影响变化不显著(图2)。
从分配比例(表2)可知,6月的AGB分配比例MF>F>M>CK处理;随着时间的变化,AGB分配比例在7月整体较6月呈现下降趋势,F>MF>M>CK处理;8月所有的处理下AGB分配比例相较6、7月最低,M>CK>MF>F处理,同时,CK、M处理较F、MF处理草食作用更严重,AGB分配比例更低。
时间 处理 地上鲜质量 地下鲜质量 地上干质量 地下干质量 6月 CK 517.65±61.19Aa 1543.70±223.74Aa 95.24±13.57Aa 278.68±52.30Aa M 608.87±171.97Aa 1386.69±206.05Aa 97.32±24.10Aa 226.63±46.14Aa F 655.69±67.15Aa 1659.07±200.13ABa 154.17±20.12Aa 337.03±60.15Aa MF 572.04±104.85Aa 1668.82±342.18Aa 96.71±16.20Aa 248.75±64.40Aa 7月 CK 356.80±44.98Ba 1555.18±333.69Aa 58.86±6.94Ba 273.72±68.36Aa M 548.68±167.79Aa 1470.90±280.44Aa 78.49±23.79Aa 264.28±69.56Aa F 465.69±50.70Ba 1050.65±252.68Ba 61.62±5.71Ba 162.45±42.71Aa MF 777.02±296.91Aa 1474.76±400.69Aa 92.75±29.25Aa 306.98±139.33Aa 8月 CK 165.39±37.36Ca 1314.02±279.42Aa 28.84±4.90Ca 210.31±45.80Aa M 242.96±78.79Aab 1606.37±371.91Aa 44.60±10.21Aa 336.76±83.40Aa F 227.90±30.80Cab 1892.52±342.54Aa 31.40±4.19Ba 333.00±98.75Aa MF 333.64±102.58Ab 1772.05±321.62Aa 49.14±11.95Aa 323.73±70.25Aa -
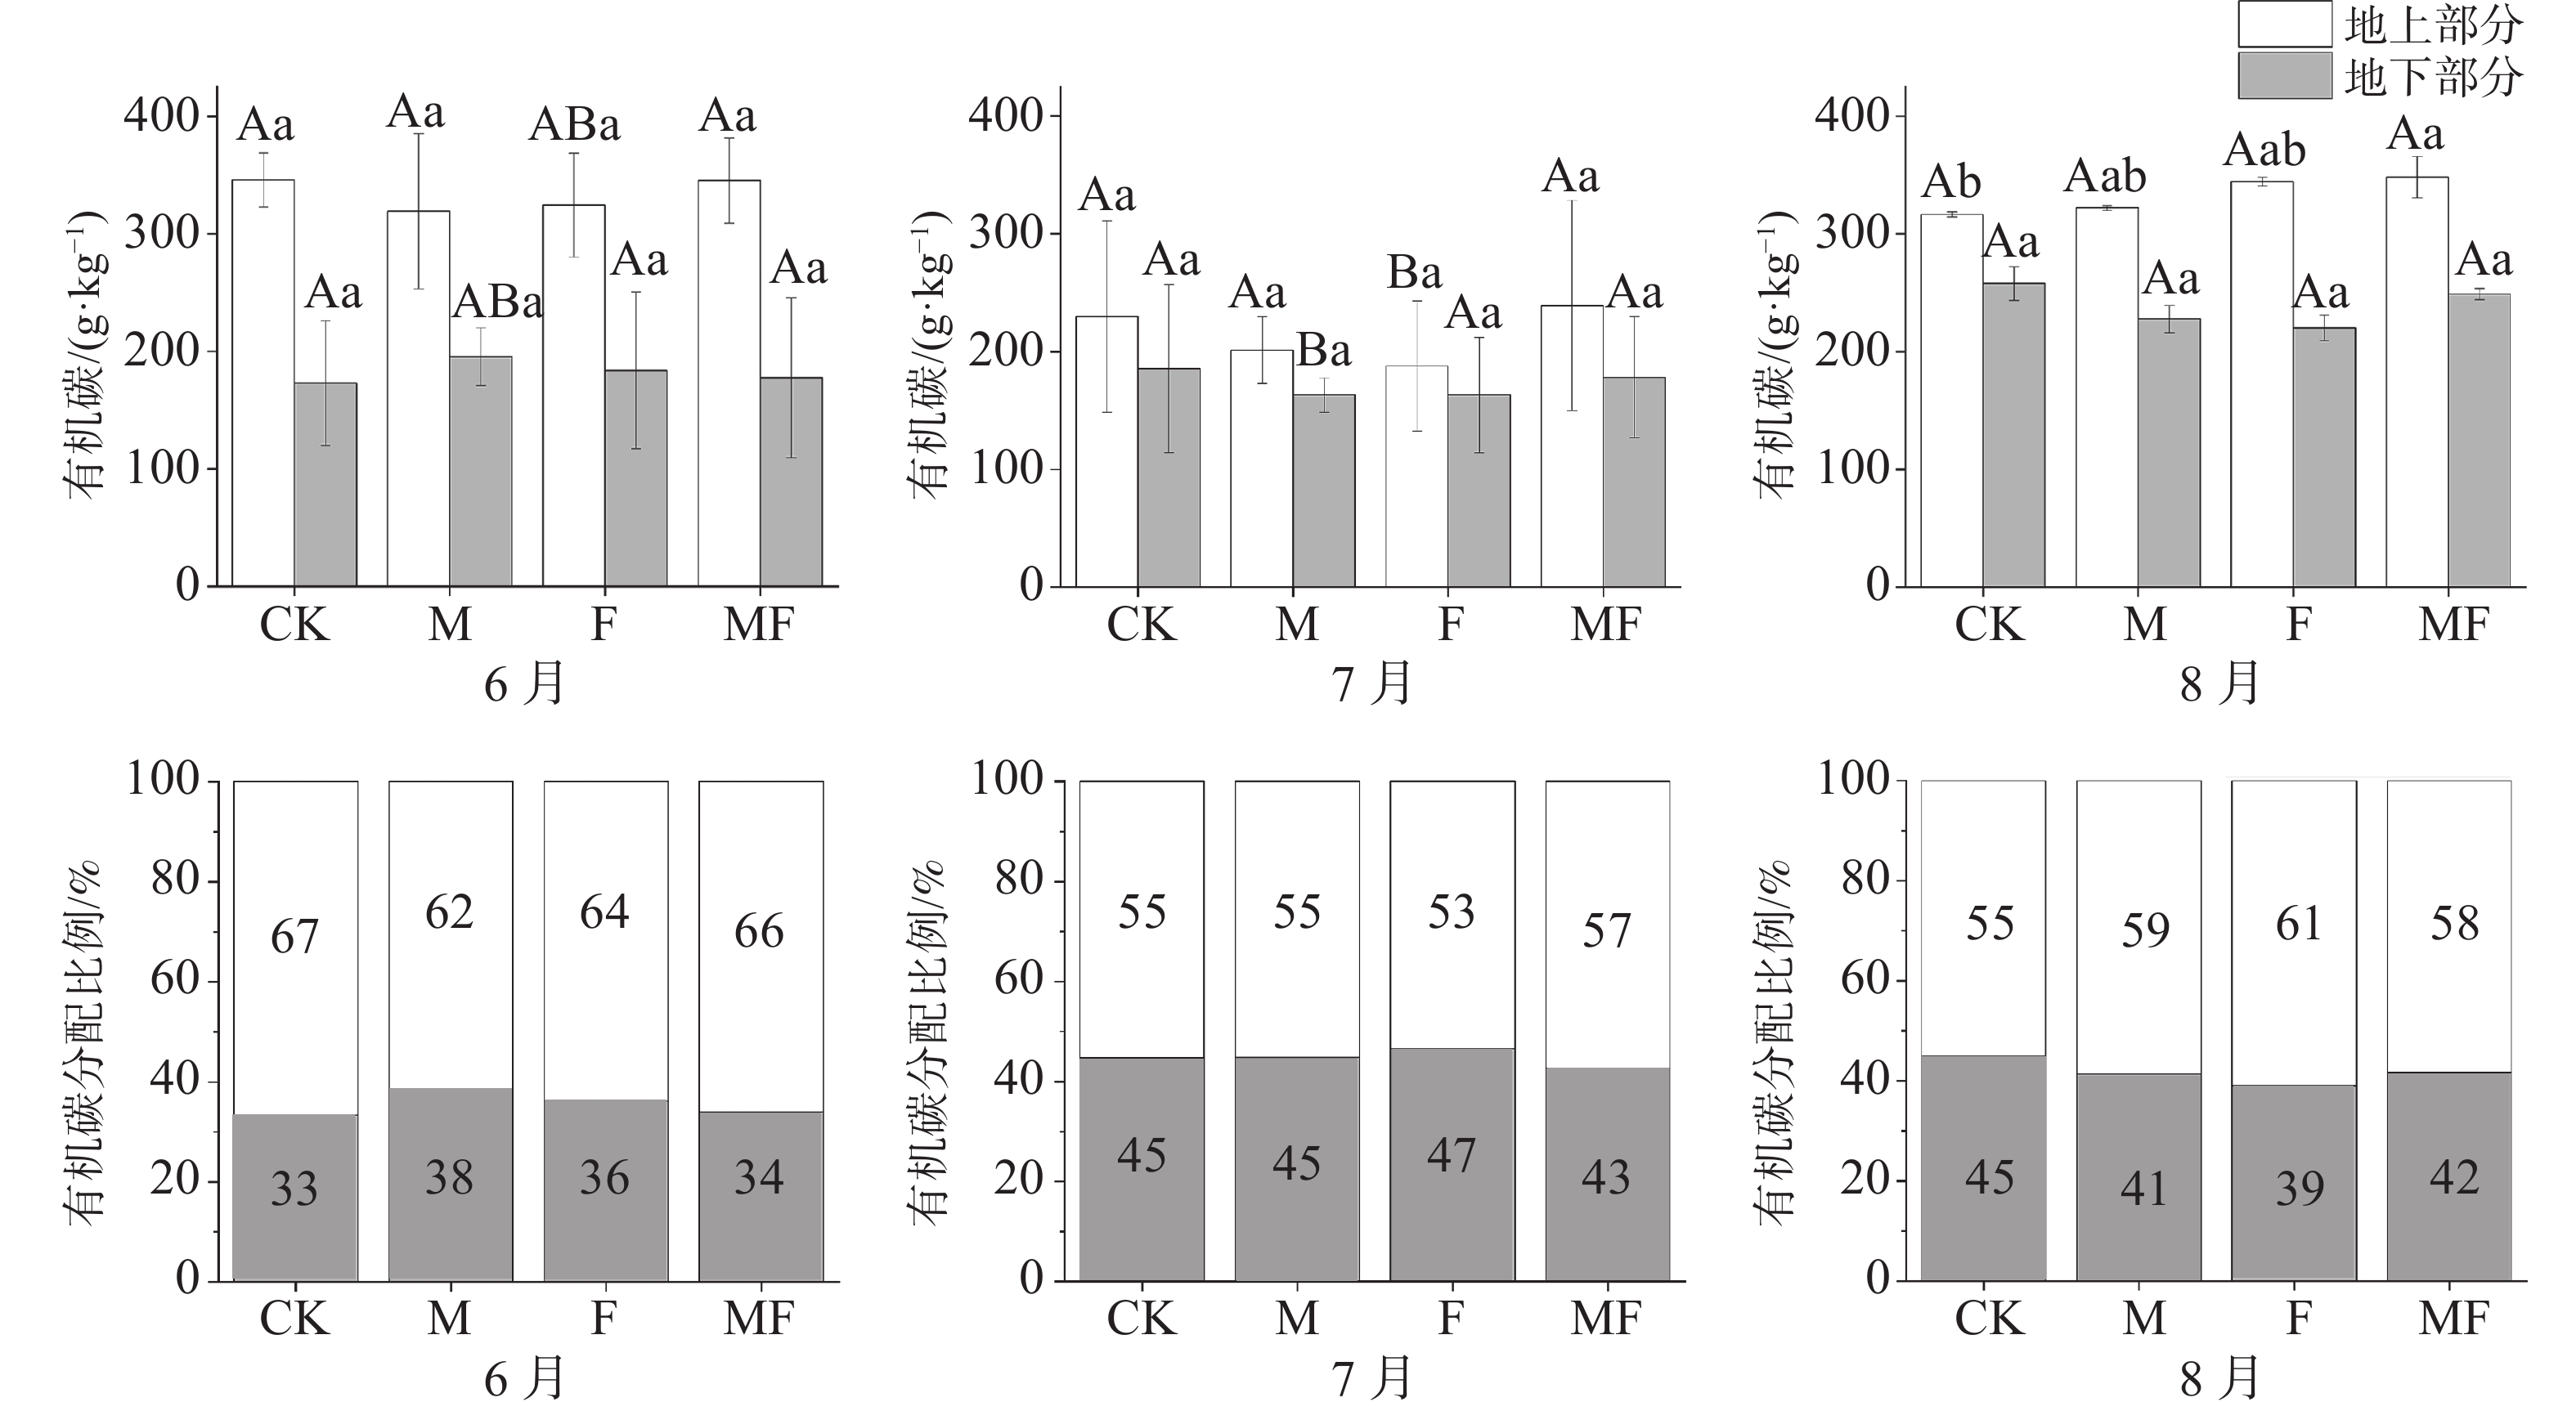
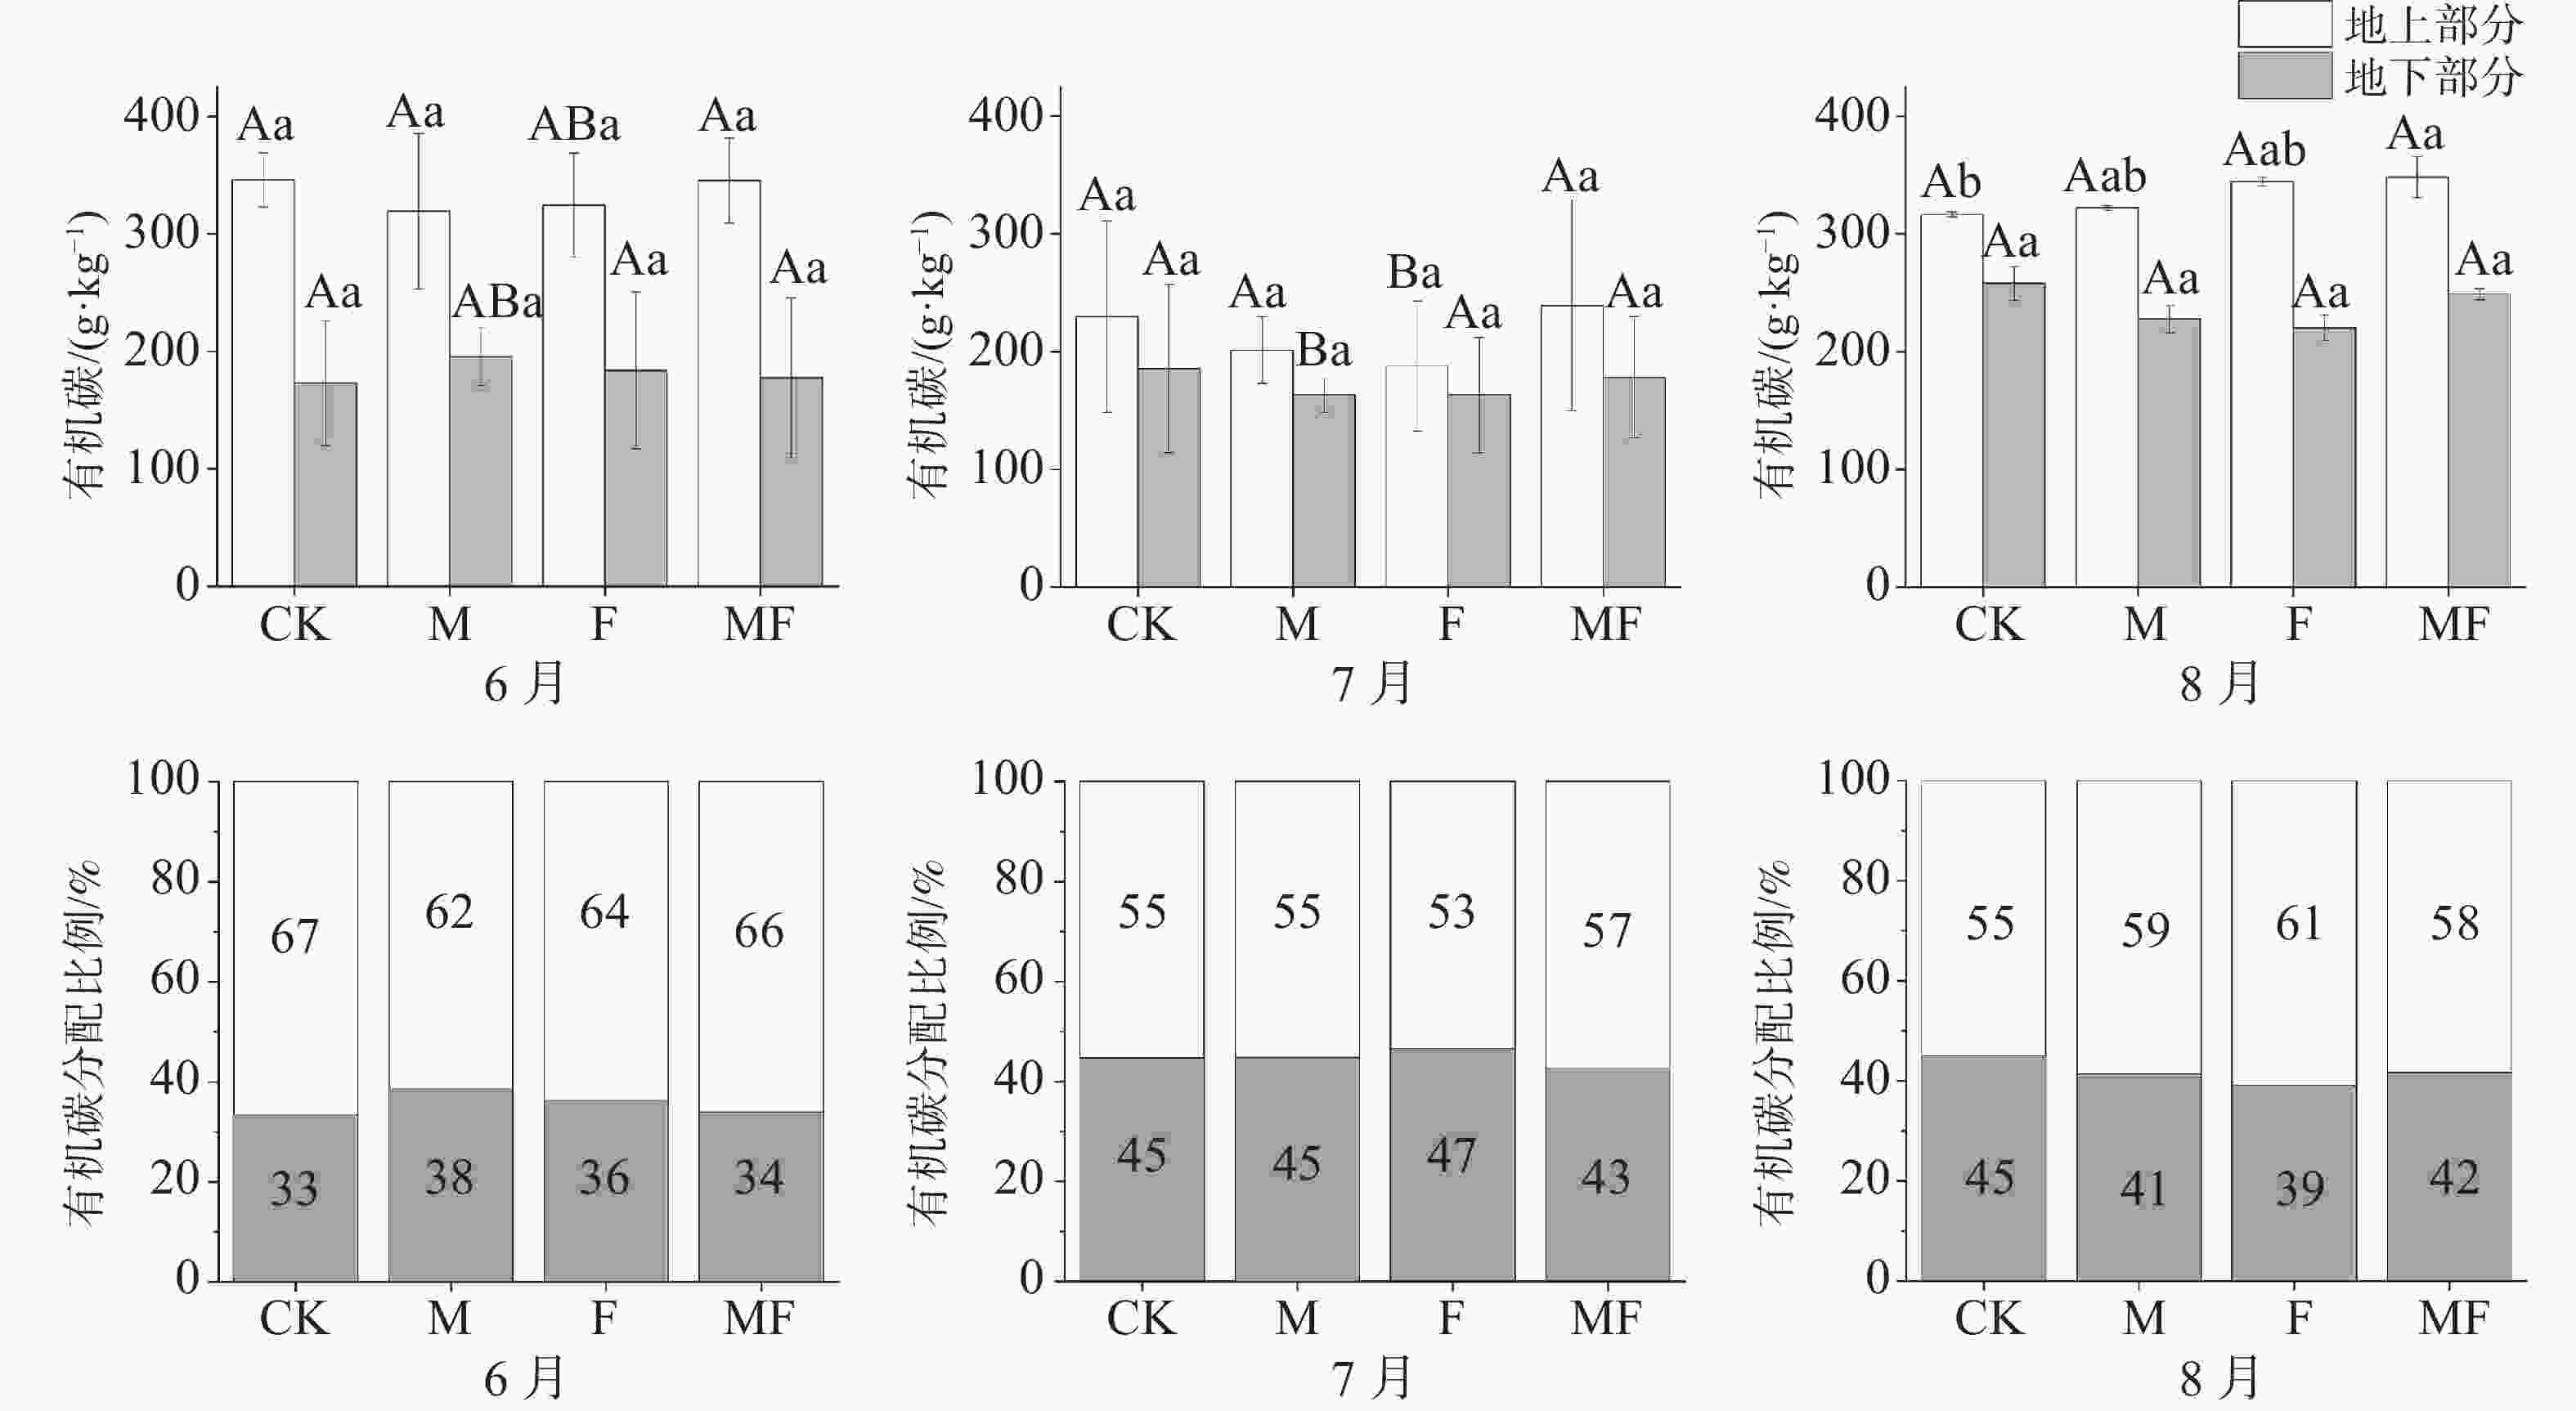
由图3可知,不同月份与不同处理下,泰来草的地上的有机碳含量均大于地下;随着时间的变化,泰来草地上有机碳含量表现出先降低后升高的趋势,地下有机碳含量表现出持续升高的趋势。除6月外,地上有机碳含量呈随排除消费者种类增多而升高的趋势,即MF处理高于CK处理。地下有机碳含量在处理间变化不显著。
从分配比例可知,泰来草地下有机碳分配比例整体上随时间变化有先升高后下降的趋势,6月,M处理地下有机碳分配比例最高,7月F处理分配比例最高,8月CK处理最高,且均高于同时间的没有草食动物采食的MF处理(图3)。
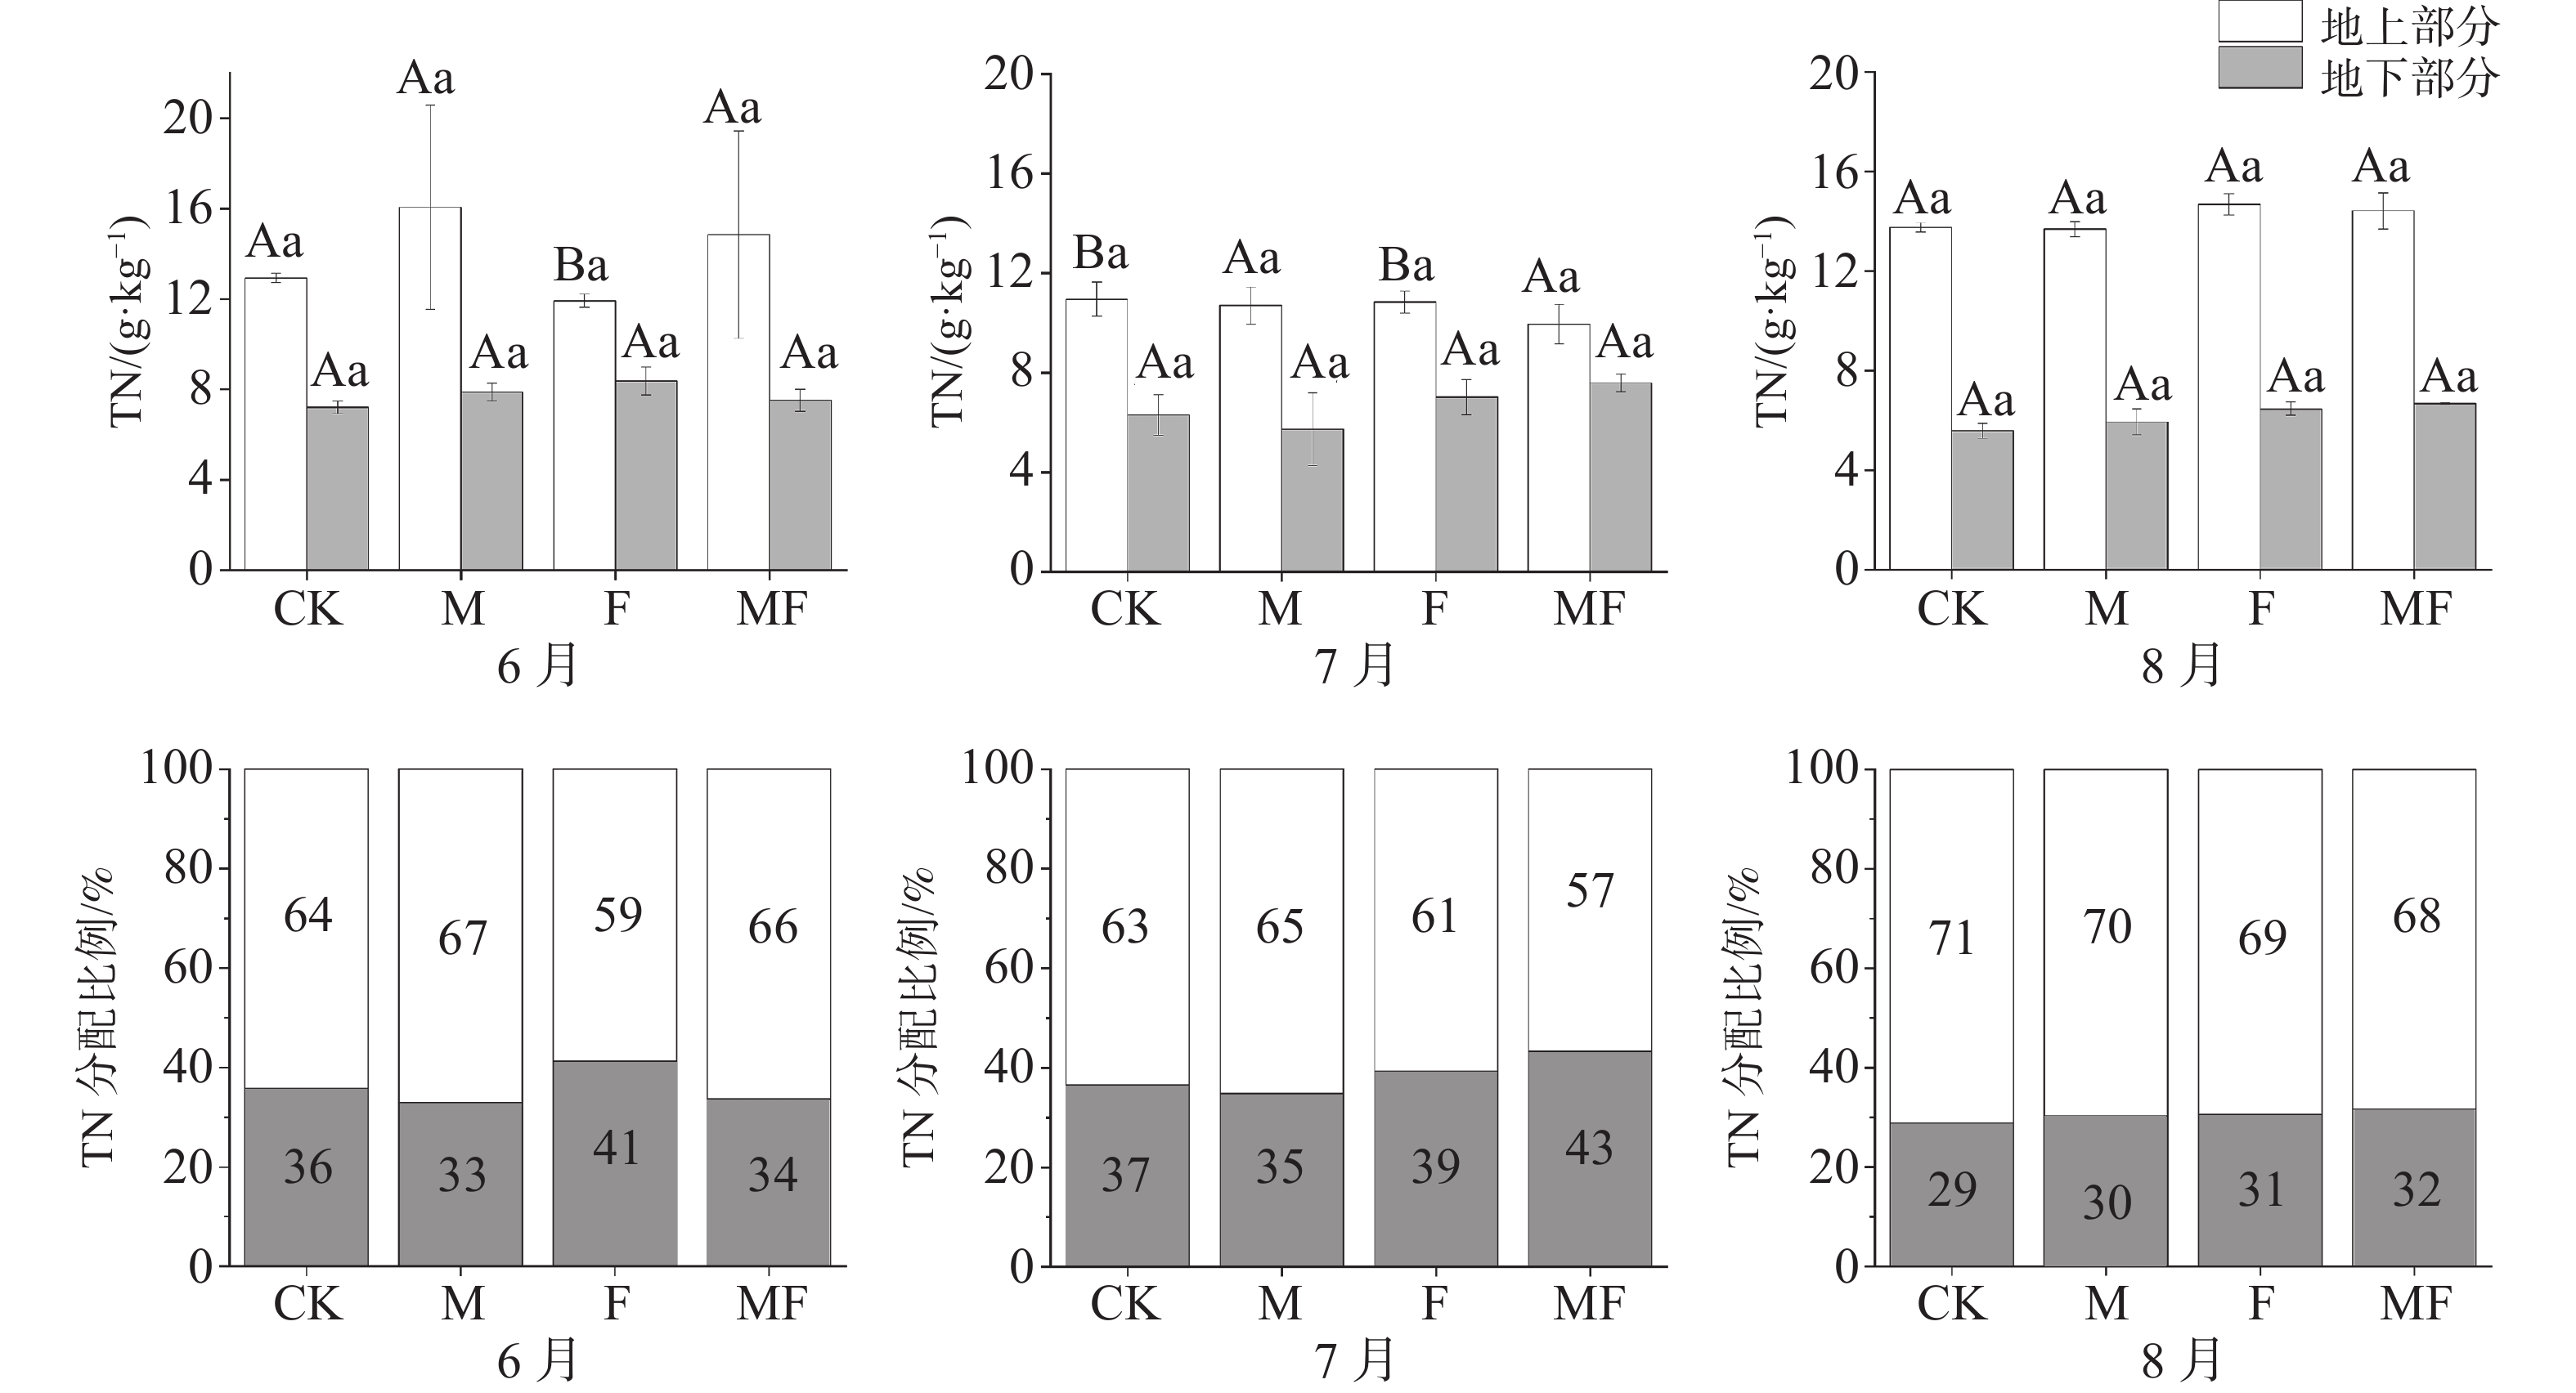
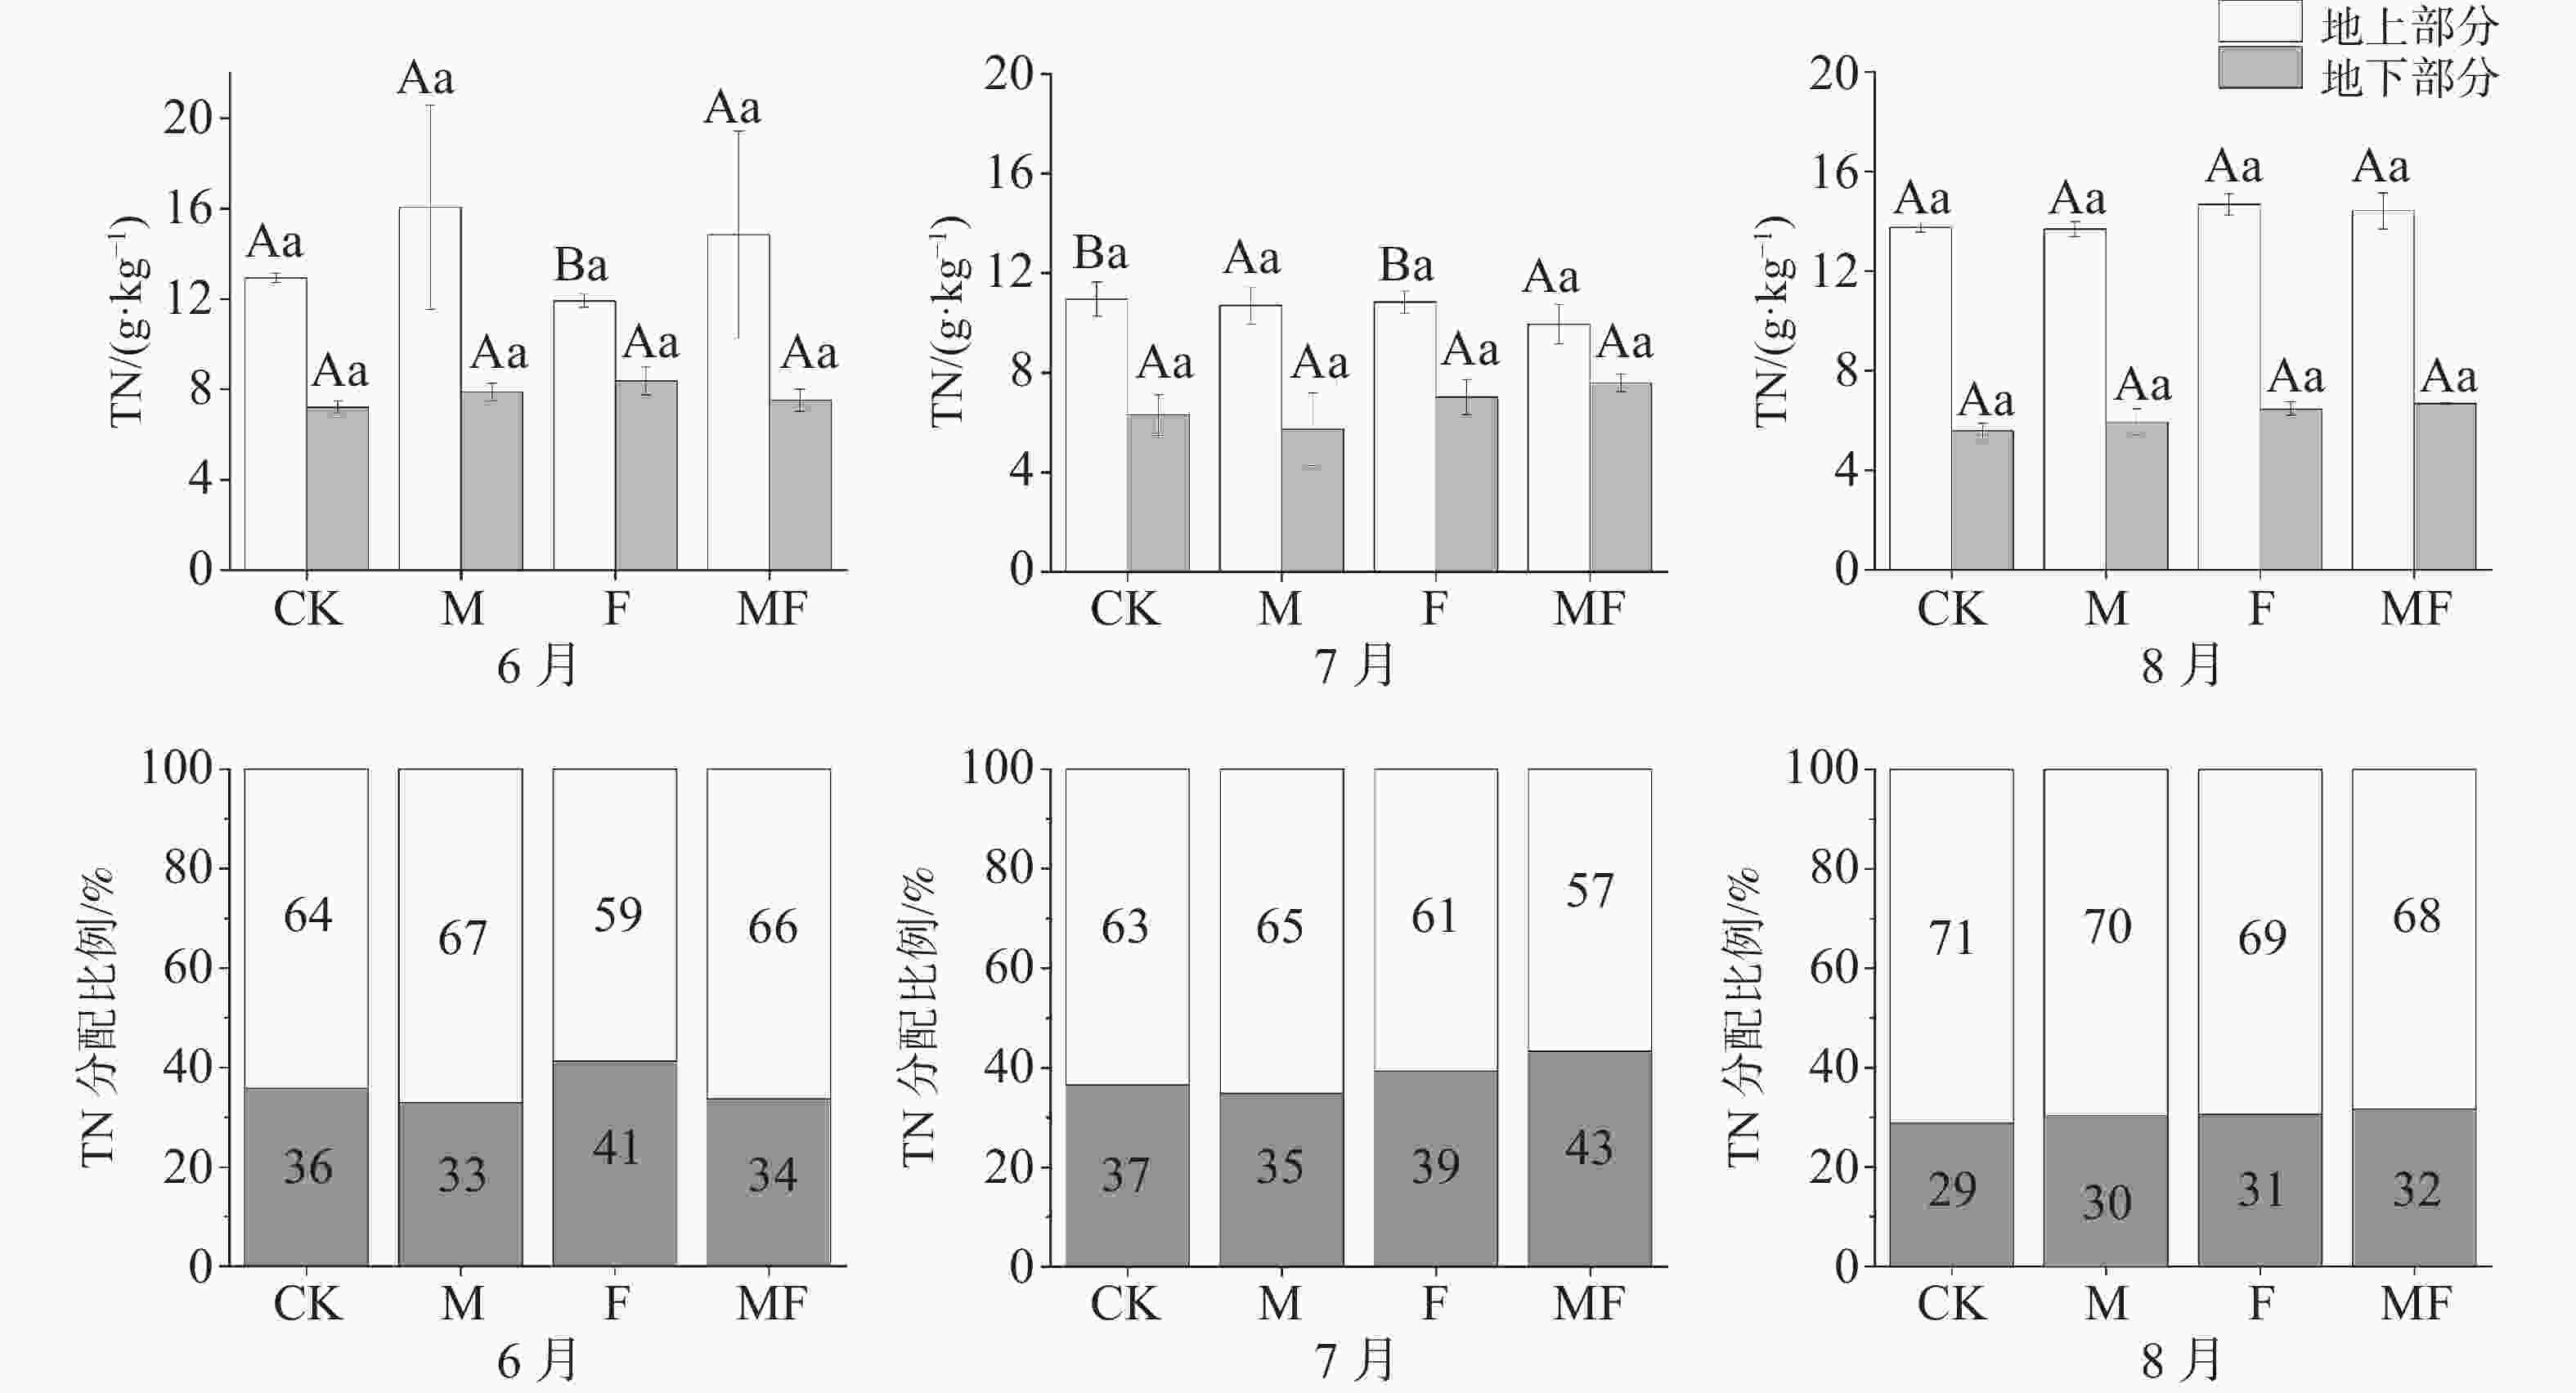
由图4可知,不同时间与不同处理下,地上TN含量均大于地下TN含量。随着时间变化,地上TN含量整体呈现出先降低后升高的趋势,地下TN含量整体呈现出降低的趋势。6月,M处理,地上TN含量最高,分配比例也最高67%;7月, MF处理的地上TN含量最低;7、8月,地下TN含量在CK、M处理下小于F、MF处理。从分配比例可知,除了6月,其他月份MF处理地下TN分配比例均大于同时间的其他处理,在没有草食作用的前提下,海草更倾向于将营养元素的储存在地下部分。
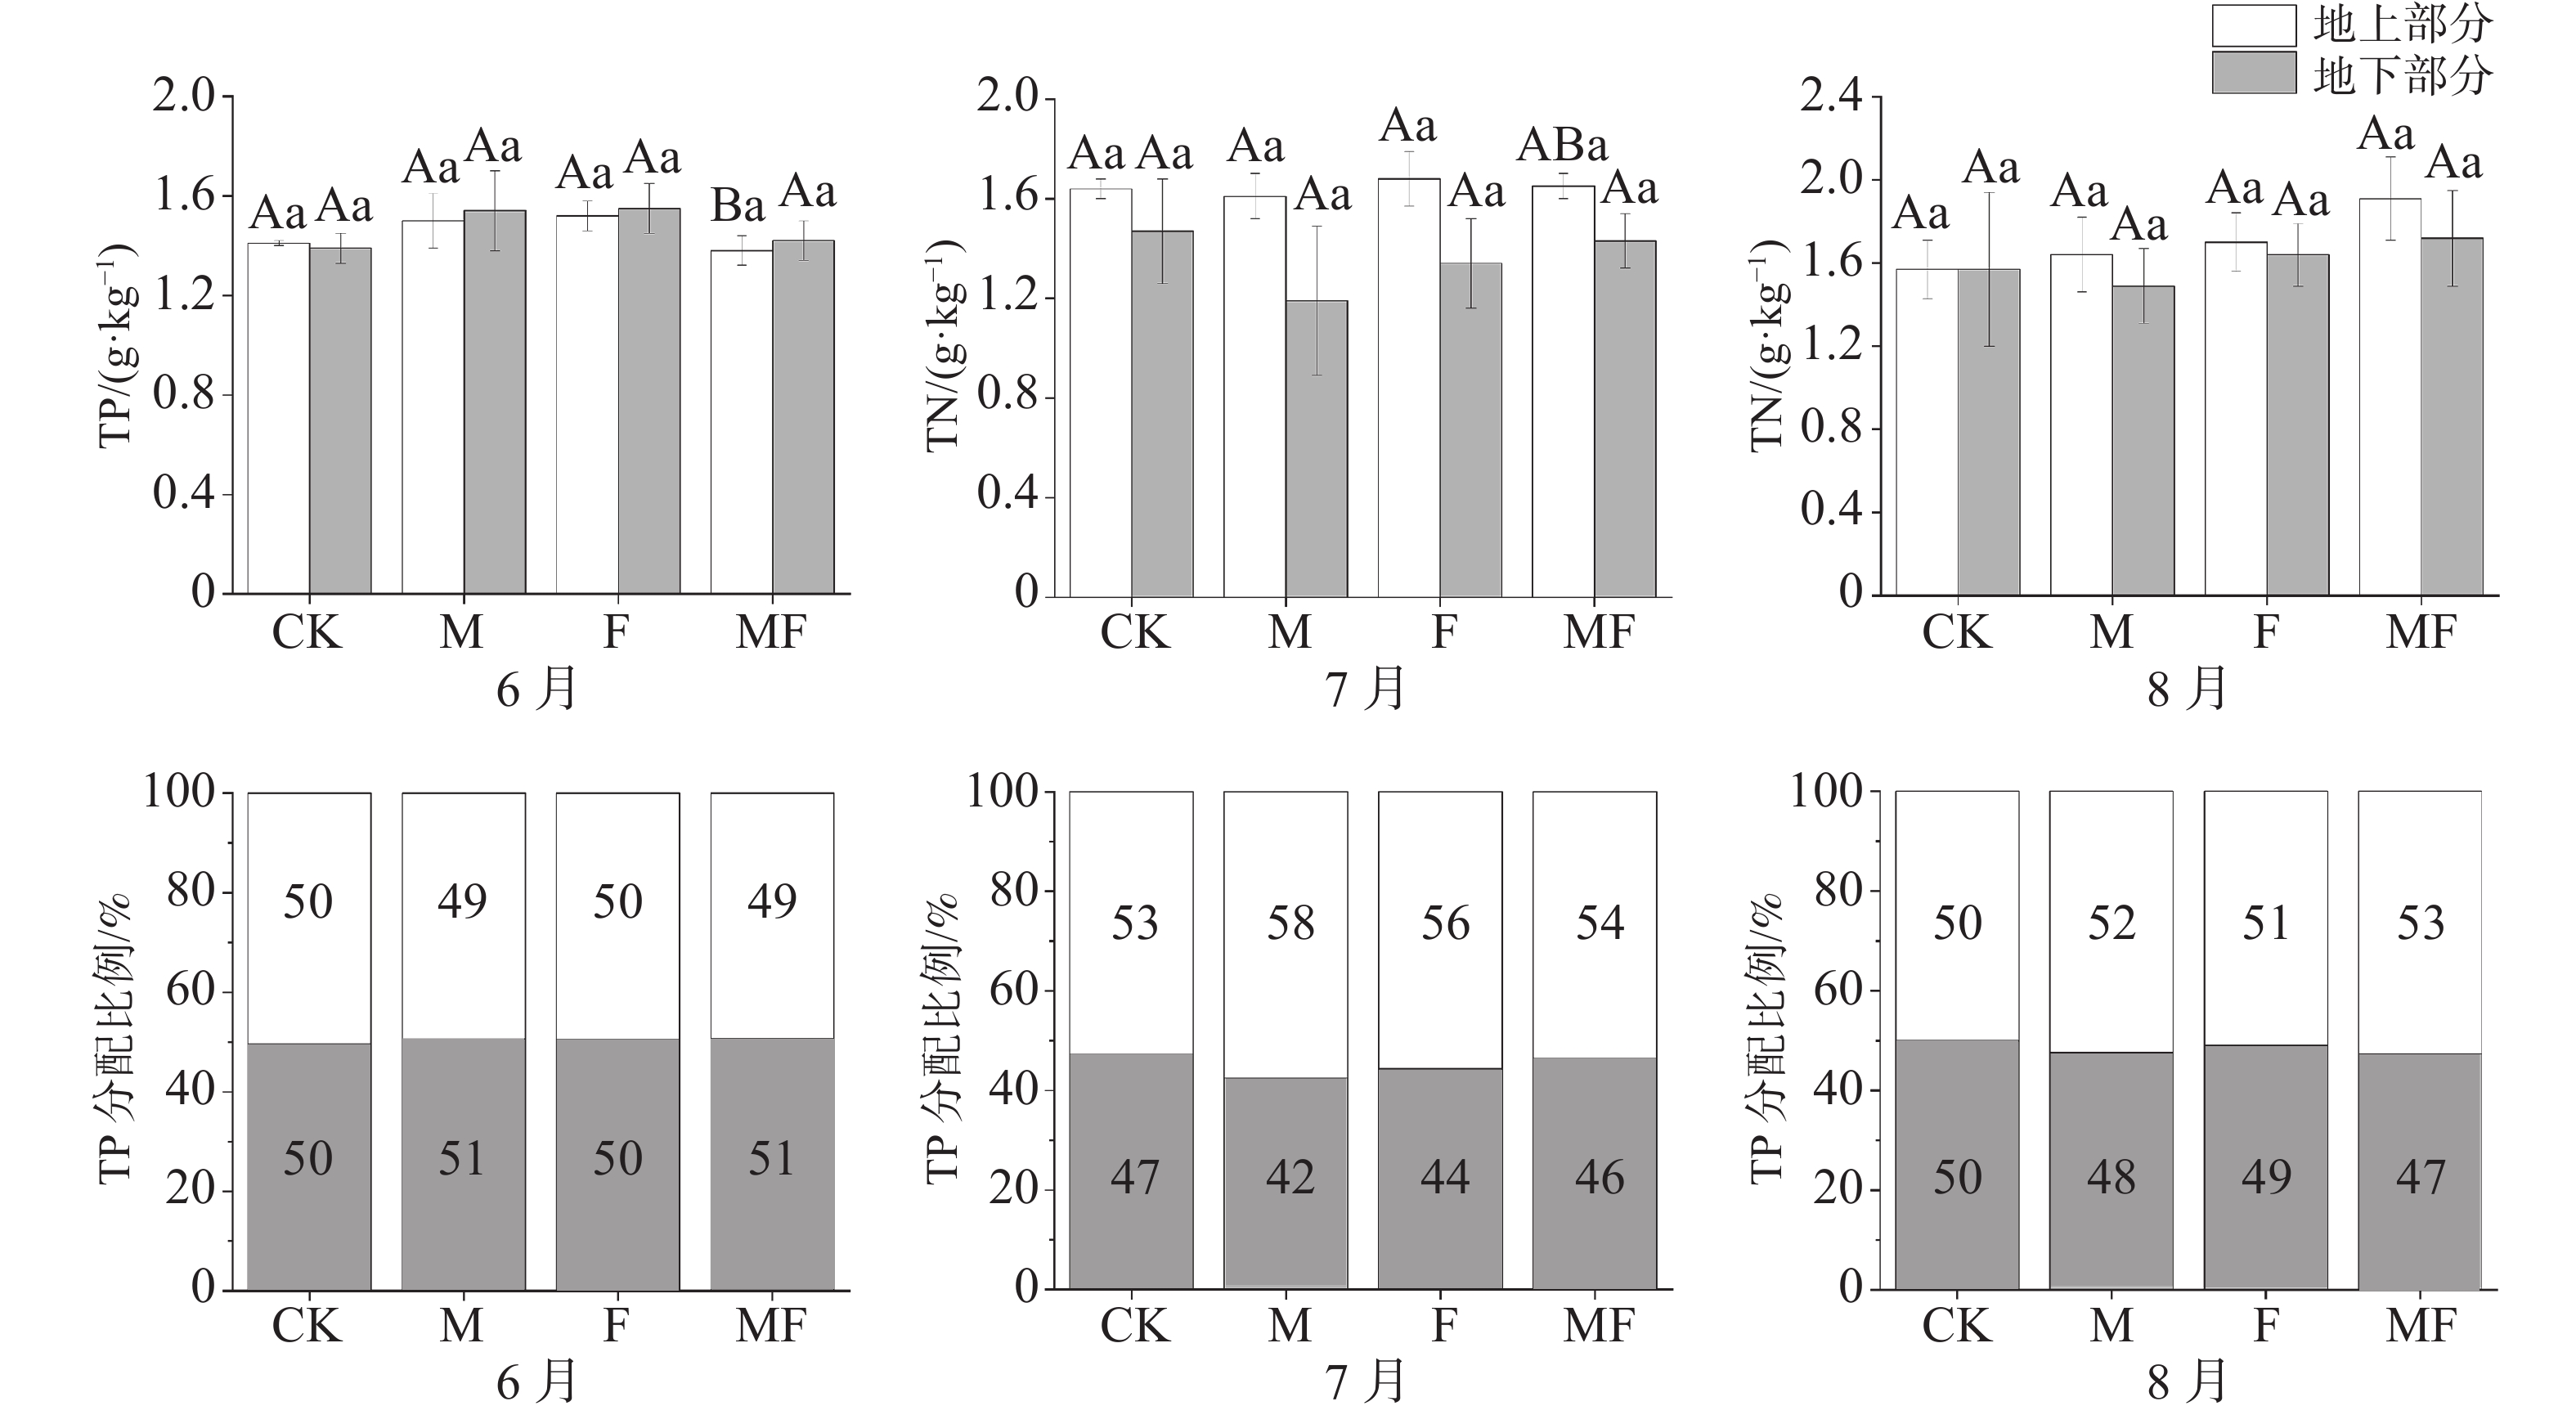
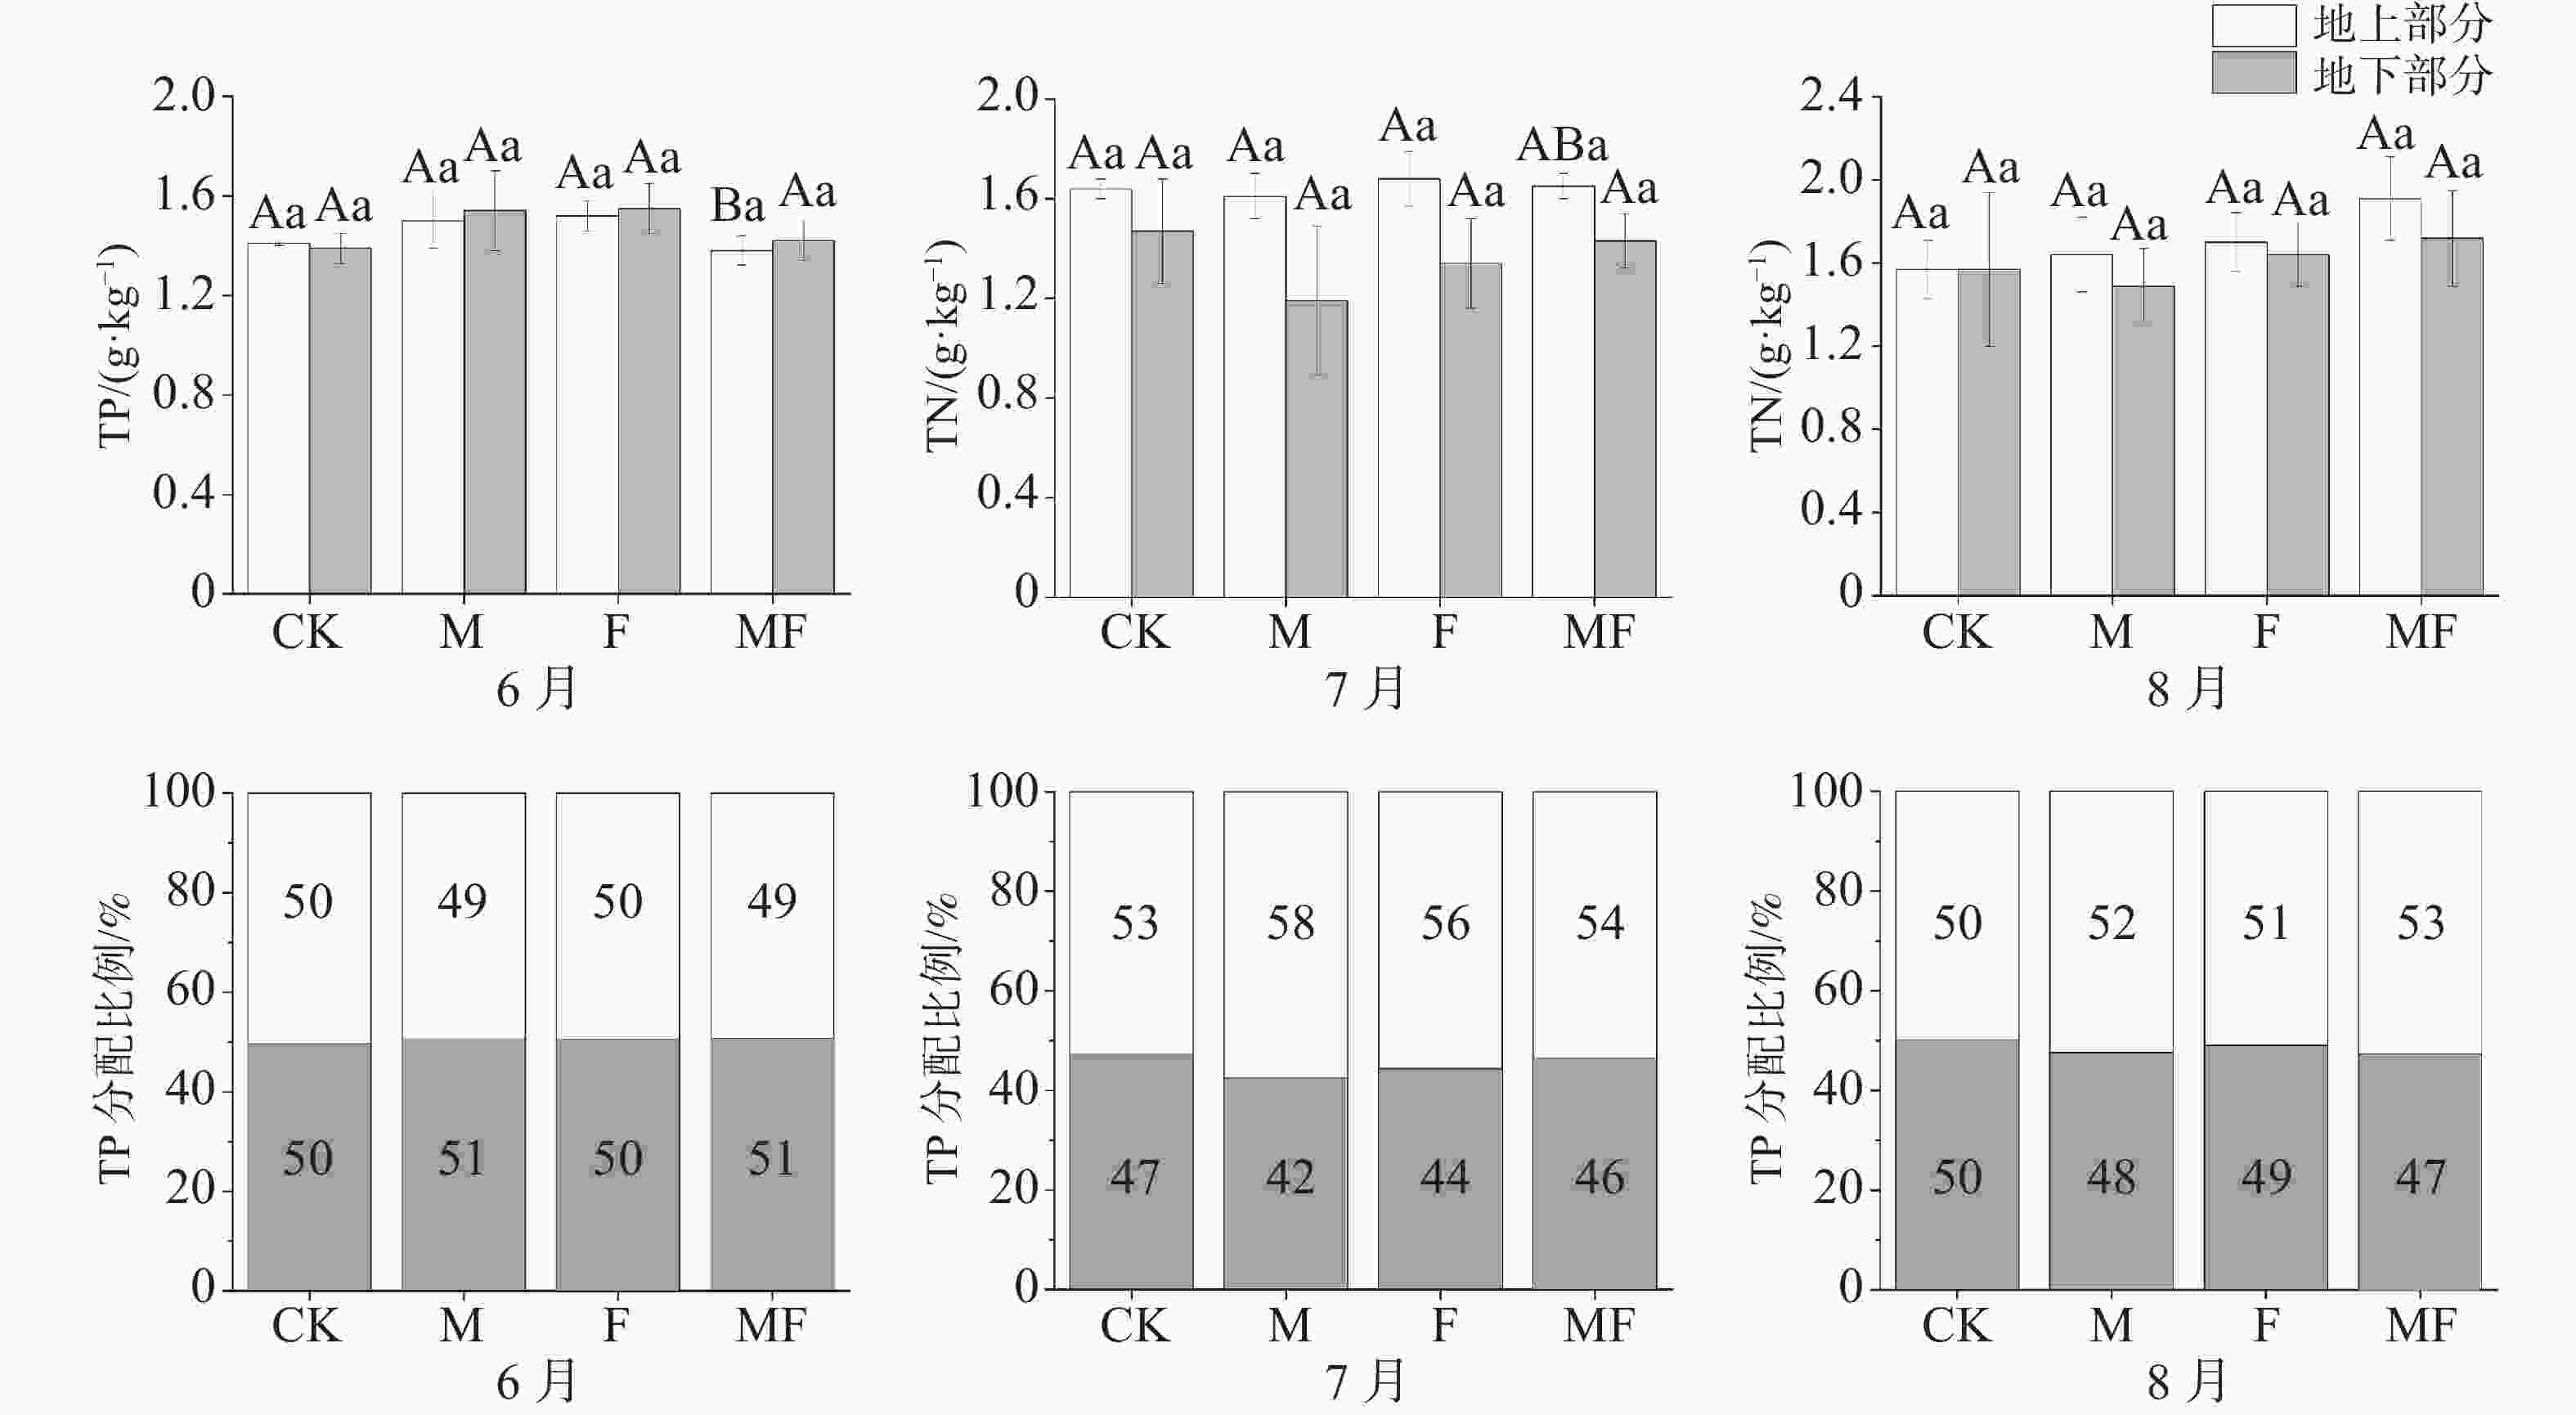
不同时间和不同处理下,泰来草地上部分与地下部分TP含量相近,分配比例在50%左右,没有显著性差异。6月,除CK处理下,其他处理地下TP含量均高于地上,而7、8月地上TP含量均高于地下;MF处理下,6月地上TP含量显著低于7、8月;从分配比例可知,7、8月地下部分TP分配比例较6月有下降的趋势(图5)。
本研究发现,草食作用会降低泰来草地上C/N,MF处理的地上C/N小于其他3种处理;地上N/P比均小于14,说明研究区域的泰来草容易受氮限制,生长速率高的有机体的N/P较低,除了6月外,其他月份MF处理的地上N/P均低于其他3种处理。
6—8月,除8月MF处理的C/P外,泰来草地上部分C/N、C/P均大于其他3种处理,而地下部分,除6月的C/P外,MF处理下的C/N、C/P均小于CK对照处理(表3)。
时间 处理 地上部分 地下部分 C∶N C∶P N∶P C∶N C∶P N∶P 6月 CK 26.58±3.50Aa 243.89±27.1Aa 9.20±0.19Aa 24.21±7.80Aa 122.09±34.47Aa 5.21±0.37Aa 6月 M 24.72±8.69Aa 212.37±43.43Aa 10.91±3.31Aa 24.67±2.36Aa 126.89±10.44Aa 5.21±0.50Aa 6月 F 27.40±4.28Aa 213.93±31.05Aa 7.86±0.36ABa 21.19±6.70Aa 120.83±47.86Aa 5.49±0.68Aa 6月 MF 28.55±8.60Aa 252.74±32.55Aa 10.58±2.88Aa 22.94±8.63Aa 128.02±52.64Aa 5.32±0.35Aa 7月 CK 21.28±8.22Aa 141.51±52.41Aa 6.67±0.25Ba 32.96±13.80Aa 142.55±59.34Aa 4.31±0.18Ab 7月 M 18.64±1.80Aa 126.04±20.19Aa 6.67±0.47Aa 33.53±9.97Aa 159.84±47.11Aa 4.78±0.05ABab 7月 F 17.20±4.88Aa 111.20±31.97Ba 6.46±0.17Ba 24.78±8.70Aa 132.99±50.23Aa 5.28±0.24Aa 7月 MF 25.71±11.29Aa 148.56±58.28Aa 6.01±0.35Aa 23.86±7.07Aa 131.34±43.60Aa 5.35±0.4Aa 8月 CK 23.05±0.46Aa 205.70±20.51Aa 8.90±0.71Aa 46.37±2.01Aa 181.17±37.59Aa 3.85±0.67Aa 8月 M 23.56±0.41Aa 202.10±24.54Aa 8.61±1.16Aa 38.72±2.87Aab 156.62±18.77Aa 4.02±0.18Ba 8月 F 23.54±0.93Aa 204.82±15.39ABa 8.76±0.96Aa 34.18±2.12Ab 136.66±15.93Aa 4.03±0.52Aa 8月 MF 24.17±0.27Aa 187.82±27.39Aa 7.75±1.06Aa 37.31±0.66Ab 149.7±17.32Aa 4.03±0.53Aa -
海草生物量的变化及其影响因素,是海草生态学的重要研究内容。海草生物量的时空变化存在一定规律,但是不能解释所有的差异。热带地区海草生物量的季节变化幅度虽然没有温带的大,但是变化更复杂、影响因素更多[27]。对于海草生物量的研究,生物因素对其影响更复杂,更难定量,其中消费者对海草的自上而下的草食作用有时会超过非生物因素的影响。适度的采食可以促进海草生长,过度的采食则往往会造成海草生物量明显下降[28]。本研究主要针对鱼类和一些小型无脊椎动物等弱草食动物的草食行为进行研究。结果发现,AGB在MF处理下高于CK处理,且随着排除物种的不同,呈现出MF>M、F>CK的趋势,这与杨持等[29]的研究结果一致。消费者的草食作用会导致海草地上生物量的减少,不同物种对于海草的采食程度不同,一定条件下,不同物种的草食作用叠加对泰来草的生物量影响大于单一物种对泰来草生物量的影响。本研究还发现,6—8月,在CK处理下,BGB持续下降,在MF处理下,BGB持续升高,6、7月,CK处理下BGB分配比例高于MF处理,主要是由于一方面,草食作用导致泰来草发生补偿生长,泰来草通过牺牲地下部分的生长维持地上部分的再生长和重建,另一方面,随着草食作用的增强,泰来草通过增加根系的生物量分配以确保吸收足够的养分来供给地上部分的生长发育,以便更好地适应环境,促进种群的扩散[30]。在 F处理下,排除鱼类消费者后,腹足消费者主要对地下部分进行采食,导致短期内BGB降低,后续由于草食作用促进了地上部分的补偿生长,向地下部分运输的光合产物增加,导致BGB逐渐升高。
草食作用的变化会影响植物对生物量资源的分配与利用。研究表明,大型草食动物如儒艮、绿海龟等的采食作用显著降低了海草地上生物量以及生物量的分配[31],由于样地草食动物种类的原因,本试验仅研究了中型草食动物对泰来草生物量以及分配比例的影响,至于更多不同种类的消费者以及长期排除实验对海草生物量以及分配的影响还需要后续深入研究。
-
根冠比是指植物地下部分与地上部分的干重的比值,消费者对海草的草食作用会影响海草的根冠比,根冠比的大小反映了植物地下部分与地上部分的相关性[32]。研究表明,消费者的草食作用去除了部分海草的叶片和芽,导致短时间内根冠比的增加,经过一段时间后根冠比会逐渐降低,主要是由于采食作用促使海草发生补偿生长从而刺激了地上部分的生长,大部分光合产物或贮藏物被地上部分利用,地下部分的供应被削弱,地下部分吸收的水分和矿质元素增加了对剩余的地上部分的供应导致地上部分生长要优于地下部分的生长。本研究取得了与Liu等[33]研究基本一致的结果,在6、7月,4种处理中排除了鱼类的F处理的根冠比最小,排除了鱼类消费者的采食,腹足类消费者对于海草根系的采食加重了地下部分的损失,导致泰来草根冠比降低。
此外,根冠比还可用来度量植物的可利用比例。在草食作用下泰来草的根冠比增加,消费者可采食部分的比例降低[34]。本研究表明,随草食作用增强,根冠比也随之增高,说明泰来草会通过增加对地下部分的生物量分配来躲避消费者对地上部分的采食。
-
适当的草食作用会加速内部各组织器官间营养循环,提高海草生产力,成为组成生态系统动力学的一个重要部分[35]。海草的营养元素在海草植株内的迁移、分配可以反映出在不同草食作用下,海草与草食行为的相互关系以及海草的响应策略。海草的补偿生长主要表现在根茎和叶片间资源的再分配[36],如从未破坏组织向破坏组织重新分配资源和能量的能力等。
本研究结果表明, MF处理地上有机碳含量均高于CK处理,这与Liu等[37]研究结果一致。6月,CK处理的地下有机碳分配比例最低,说明消费者的草食作用导致有机碳由地下向地上运输。7、8月泰来草地下有机碳分配比例CK>MF,说明草食作用导致泰来草补偿生长地下部分从沉积物中吸收有机碳用来供应地上部分的生长。8月泰来草地下TN分配比例整体小于6、7月,说明时间影响大于处理对它的影响。在 8月,不同处理下,地下TN分配比例为MF>F>M>CK,说明消费者对泰来草的采食影响了TN含量的分配,补偿生长导致TN倾向于向受破坏的地上组织运输。 不同时间和不同处理对泰来草地下TP分配比例影响不明显。
草食作用对泰来草的C/N、C/P、N/P的影响可以反映植物的生境状况,并能了解植物生长受养分的限制情况。研究表明,养分平衡时的海草N/P为14,高于此值,生长受磷限制,反之受氮限制[38] 。研究样地的泰来草N/P<14,容易受到氮限制。泰来草地上部分的C/N、C/P相较于MF处理的持续下降,M与F处理表现出类似于CK处理的先降低后升高的趋势,由于没有草食作用泰来草的生长速率较高,因此MF处理的N/P也小于其他处理。
-
泰来草地上地下资源分配的变化表明草食作用对泰来草的生长状况影响显著,消费者的采食会降低泰来草的地上生物量,增大根冠比,改变营养元素的分配格局。
(1)随着草食作用的加强,泰来草地上、地下生物量随草食作用的增加而显著降低,生物量分配格局是地下生物量>地上生物量,且生物量均随草食作用的增强而降低。
(2)随着草食作用的加强,泰来草的生物量根冠比增加,为再生提供充足的能量保证,使泰来草的抗逆能力增加。
(3)随着草食作用的加强,补偿生长改变了泰来草的碳分配,加速了沉积物的磷循环,泰来草的地下部分有机碳、TP含量分配比例增加,且草食作用加速了泰来草氮循环速率,促使TN含量对地上部分的分配增加,试验样地附近海域泰来草生长受到了N限制,导致地下部分TN含量分配比例降低。
(4)草食作用降低了地上、地下部分的生物量,从而降低了有机碳含量,又因为补偿生长,加速了氮磷循环速率所以导致C/N、C/P降低,N/P升高。
综上所述,草食作用改变了泰来草地上、地下的资源分配,泰来草为了提高对资源的吸收和同化速率,维持种群延续,增加了向地上部分的生物量分配。泰来草为适应草食作用表现出的资源分配格局的变化,不仅有利于生态系统组成与结构稳定性的维持,同时,在一定程度上可以减缓海草的退化,为海草生态系统的恢复提供依据。
Effects of herbivory on resource allocation of the above and below ground parts of seagrass Thalassia hemprichii
DOI: 10.15886/j.cnki.rdswxb.20220103
- Received Date: 2022-12-01
- Accepted Date: 2023-03-20
- Rev Recd Date: 2023-02-22
- Available Online: 2023-11-24
- Publish Date: 2023-11-24
-
Key words:
- herbivory /
- Thalassia hemprichii /
- traits /
- root to shoot ratio
Abstract: The structure and function of seagrass ecosystems were changed and the diversity and service function of the seagrass ecosystems were affected by the top-down regulation of herbivorous effects on the seagrass. Different herbivores have different effects on resource allocation of the above ground and below ground parts of the seagrasses due to their different feeding capacity. Thalassia hemprichii, a dominant seagrass in Hainan Province, was selected to simulate the response of functional traits (root-shoot ratio, biomass and element content) to herbivoring effects on T. hemprichii by setting up isolation cage in situ and placing chemical expellant (Sevin) to exclude feeding effects of different consumers on the seagrass. The results showed that the root-shoot ratio of the seagrass T. hemprichii increased with time, but there was no significant difference in root-shoot ratio between different treatments. Grazing by consumers reduced the biomass of T. hemprichii. The above ground biomass of T. hemprichii in the treatment (MF) with exclusion of two consumers, both gastropods and fish, was higher than that of the blank control treatment (CK) without excluding consumers. Herbivory increased the above ground seagrass allocation ratio of organic carbon and total nitrogen to maintain normal growth of T. hemprichii, but the herbivorous impact on the total phosphorus content was not significant (P>0.05). In general, herbivorous effects increased the root-shoot ratio and regulated the allocation of biomass, organic carbon, total nitrogen, and total phosphorus in above ground and below ground parts of T. hemprichii, which was used to improve the absorption and assimilation rate of the resources, avoid grazing by the consumers, and maintain the population of T. hemprichii.
| Citation: | JIA Biying, LIU Siyu, ZHAO Yanghe, MAO Wei. Effects of herbivory on resource allocation of the above and below ground parts of seagrass Thalassia hemprichii[J]. Journal of Tropical Biology, 2023, 14(6): 593-601. doi: 10.15886/j.cnki.rdswxb.20220103 |



 DownLoad:
