

-
珊瑚礁生态系统拥有较高的初级生产力和生物多样性,为人类提供了极具价值的生态服务功能,比如丰富的渔业和旅游资源[1-2]。作为珊瑚礁生态系统的主要框架生物,造礁石珊瑚的生长得益于共生虫黄藻提供的光合作用产物,其能满足珊瑚的大部分能量需求。作为交换,造礁石珊瑚能为共生虫黄藻提供光合作用所需的二氧化碳(CO2)、无机营养和稳定的环境。但是,近年来表层海水升温和海洋环境污染威胁着造礁石珊瑚与虫黄藻的共生关系,共生关系的破裂将进一步导致珊瑚白化或死亡,珊瑚礁生态系统呈不断退化趋势[3-5]。随着人类对海岸带的开发日益加剧,海水悬浮物(Suspended solid)已经成为近岸珊瑚礁生态系统的主要胁迫因子之一。大量陆源颗粒物质随地表径流输入珊瑚礁区,造成海水悬浮物浓度显著升高,同时水体浊度也明显增加。海水悬浮物会产生遮蔽效应,降低共生虫黄藻的光合效率[6-7]。悬浮物还会缓慢释放出氮、磷等营养物质,促进水体中其他藻类的爆发生长,进一步加剧该遮蔽效应。海水悬浮物浓度的升高能对造礁石珊瑚的生存产生诸多消极影响,从而不利于珊瑚礁生态系统的稳定性,但相关了解仍然十分有限。
本研究于2020年5−9月期间调查了3个礁区(崖州湾、凤凰岛和西岛)的海水悬浮物质量浓度,并测定了礁区中普哥滨珊瑚(Porites pukoensis)的共生虫黄藻密度、叶绿素a+c2含量,以及共生双方的超氧化物歧化酶(Superoxide dismutase,SOD)、过氧化氢酶(Catalase,CAT)、谷胱甘肽S-转移酶(Glutathione S-transferase,GST)、一氧化氮合酶(Nitric oxide synthase,NOS)和酚氧化物酶(Phenoloxidase,PO)的活力,进而分析礁区悬浮物质量浓度差异对普哥滨珊瑚生理活性的影响,以期揭示造礁石珊瑚对高浓度悬浮物的的生理适应机制。此外,本研究还挑选了敏感生物标志物构建综合评价指标,旨在用以评估悬浮物对普哥滨珊瑚的影响程度。
-
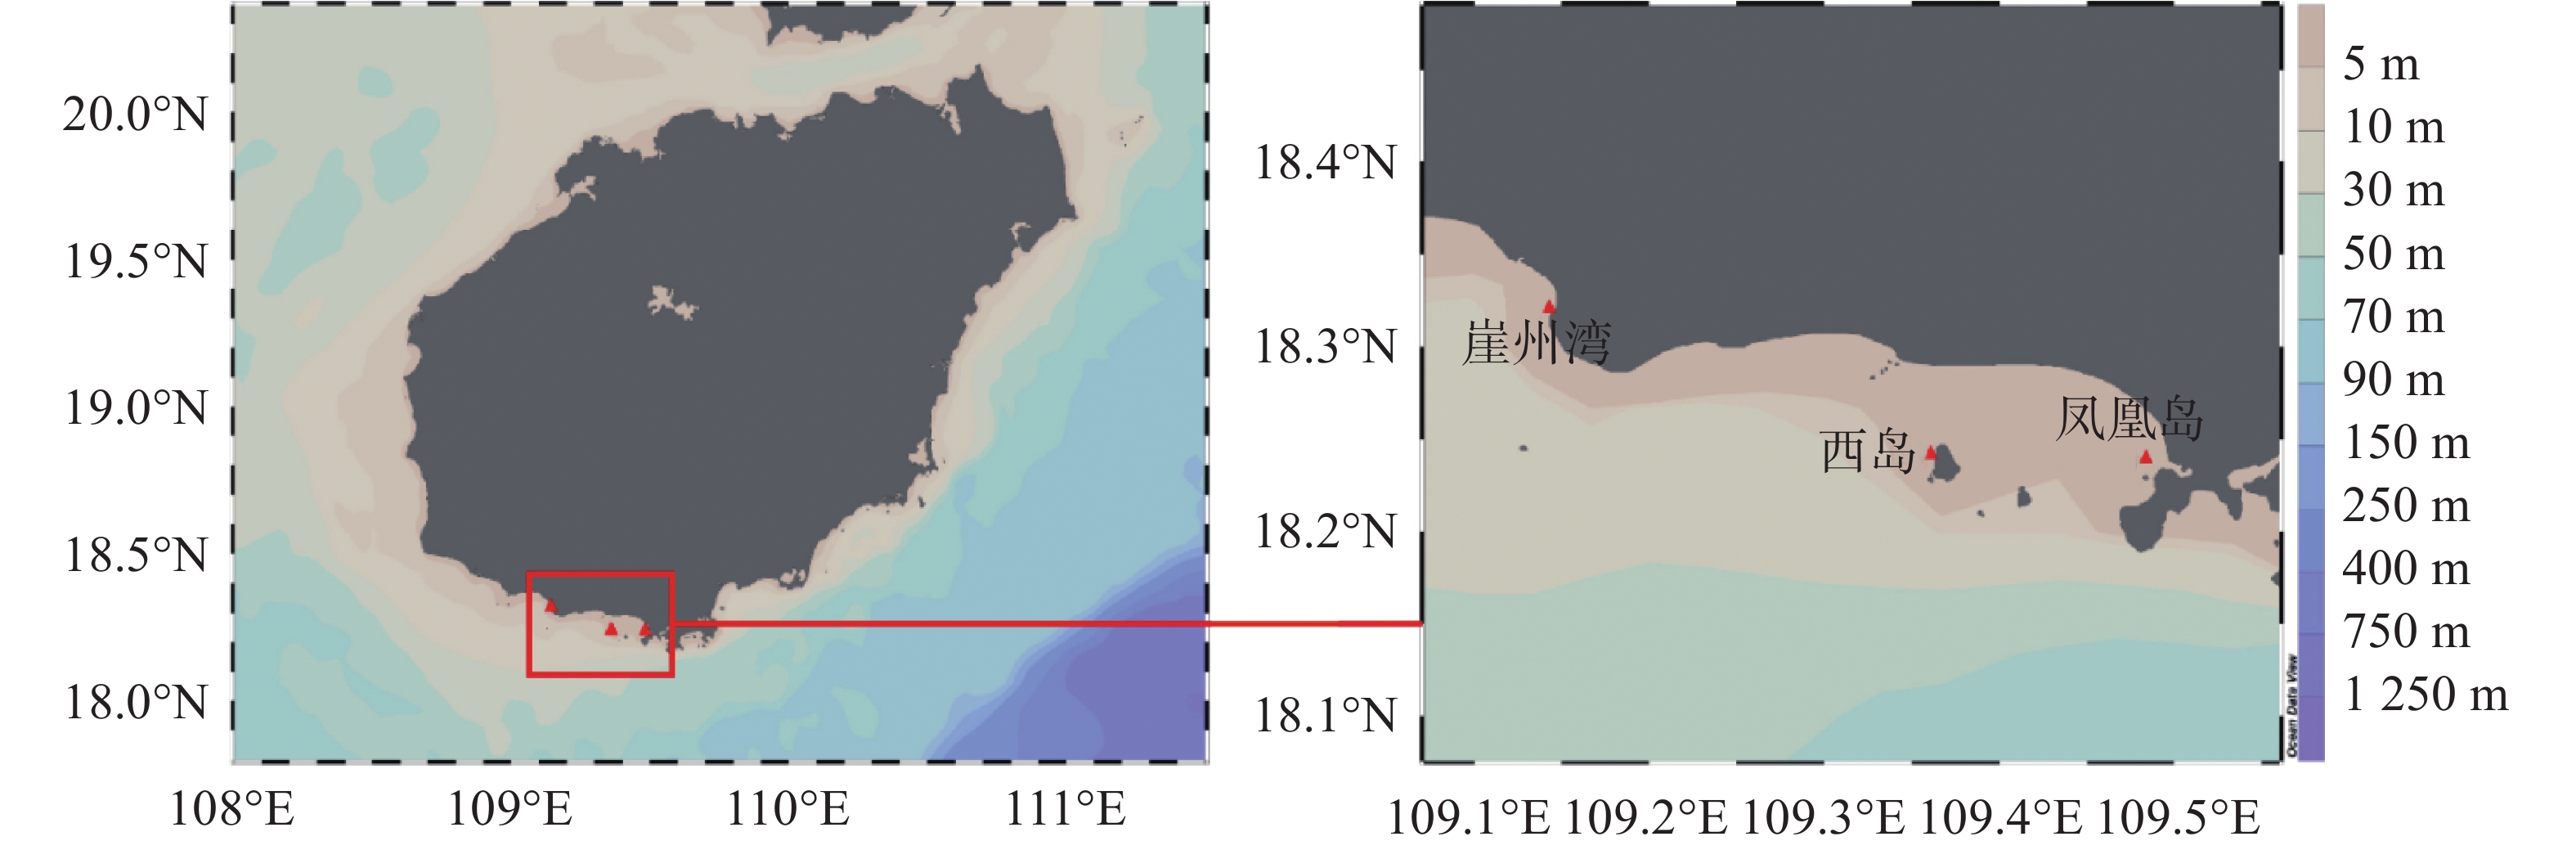
于2020年5−9月期间,每月在三亚崖州湾(18°19′13″N,109°8′47″E)、凤凰岛(18°14′27″N,109°29′05″E)和西岛(18°14′28″N,109°21′54″E)3个礁区进行取样。每次每个站点用采水器取5份1.5 L表层海水,同时潜水员下潜至水下3 m左右,用锤子和凿子凿取5块不同亲本的普哥滨珊瑚样品。海水装在卡盖式采样瓶内低温避光保存,珊瑚立即置于铝箔袋并在干冰中保存。海水和珊瑚样品均于当日运回实验室开展后续实验。取样位置见图1。

-
磷酸盐缓冲溶液(PBS, 377 mmol·L−1 NaCl,2.7 mmol·L−1 KCl,8.09 mmol·L−1 Na2HPO4,1.47 mmol·L−1 KH2PO4,pH7.4),100%丙酮,4%甲醛,10 mmol·L−1左旋多巴(L-DOPA)溶液,总SOD测定试剂盒(A001-1-1,南京建成生物工程研究所有限公司),CAT测定试剂盒(A007-1-1,南京建成生物工程研究所有限公司),GST测定试剂盒(A004-1-1,南京建成生物工程研究所有限公司),总NOS测定试剂盒(A014-2-2,南京建成生物工程研究所有限公司),BCA蛋白质定量检测试剂盒(C503021-0500,上海生工生物工程股份有限公司)。
-
海水中的悬浮物浓度的测定严格按照《海洋监测规范》(GB 17378.4-2007)[8]第4部分进行。先将0.45 μm孔径的滤膜(TJMF60,天津市津腾实验设备有限公司)放置于50 ℃恒温干燥箱中6~8 h烘干至恒重,然后用电子分析天平(BSA224S-CW,赛多利斯科学仪器有限公司)称重,并放入硅胶干燥器中保存。过滤时,用不锈钢镊子将烘干滤膜取出,放置在搭配有隔膜真空泵(GM-0.5A,天津市滕津实验设备有限公司)的滤器内。过滤1 L表层海水后,将滤膜置于50 ℃恒温干燥箱中充分干燥,再用电子分析天平称量滤膜质量。海水悬浮物质量浓度计算公式:
-
使用装有过滤海水(经0.22 μm孔径的滤膜过滤)的Waterpik洗牙器(WP-462EC,洁碧有限公司)冲洗普哥滨珊瑚的表面组织。取1 mL冲洗液,7 204 r·min−1 4 ℃离心10 min,将共生虫黄藻沉淀重悬于0.2 mL 4%甲醛溶液中,在光学生物显微镜(E100,尼康仪器有限公司)下使用Sedgwick-Rafter计数板进行计数[9]。采用铝箔纸包裹法[10]计算被冲洗的珊瑚骨骼表面积。共生虫黄藻密度计算公式:
-
取上述2 mL冲洗液,7 204 r·min−1 4 ℃离心10 min,然后用PBS清洗共生虫黄藻沉淀,重复离心清洗直至镜检无珊瑚组织碎屑。向共生虫黄藻沉淀中加入2 mL 100%丙酮溶液,4 ℃下萃取24 h。最后,11 617 r·min−1离心15 min,采用可见分光光度计(UV-1100,上海美谱达仪器有限公司)分别在630 nm和663 nm处测量萃取液的吸光值[11]。叶绿素a+c2的总含量参照JEFFREY等[12]的方程计算,每个共生虫黄藻的叶绿素含量表示为pg·cell−1 [13]。
-
用装有预冷PBS(4 ℃)的洗牙器冲洗普哥滨珊瑚的表面组织,取6 mL冲洗液于7 204 r·min−1 4 ℃离心10 min,取上清液用于珊瑚酶活的检测。然后用2 mL PBS重悬共生虫黄藻沉淀,重复离心清洗直至镜检无珊瑚组织碎屑。加入0.5 g氧化锆破碎珠(0.5 mm粒径,11079105z,上海睿铂赛生物科技有限公司)和1 mL预冷PBS,用生物样品均质仪(Bioprep-24,杭州奥盛仪器有限公司)彻底破碎共生虫黄藻细胞,参数为振幅6 m·s−1,每破碎1 min冰浴3 min。最后,7 204 r·min−1 4 ℃离心10 min,取上清液用于共生虫黄藻酶活的检测。使用SOD、CAT、NOS和GST检测试剂盒测定上述上清液中的总酶活力。珊瑚的PO总活性测定参考PALMER[14]描述的方法,将珊瑚上清液与L-DOPA溶液反应后于490 nm处测定吸光值用以表示其总酶活力。最后,采用BCA蛋白定量检测试剂盒测定上清液中的总蛋白浓度。将普哥滨珊瑚及其共生虫黄藻的总酶活力除以蛋白浓度,计算得出相应的酶比活力(U·mg−1或ΔOD490 mg−1·min−1)。
-
所有数据以平均值 ± 标准差表示。采用双因素方差分析不同站点的海水悬浮物浓度差异。采用PCA分析普哥滨珊瑚及其共生虫黄藻的各项生理活性指标主效应,采用Spearman秩方法分析海水悬浮物浓度与各生理指标之间的相关性。综合生物标志物响应(Integrated Biomarker Response)指数分析参照文献[15]的方法。统计分析的显著差异定义为P < 0.05。
-
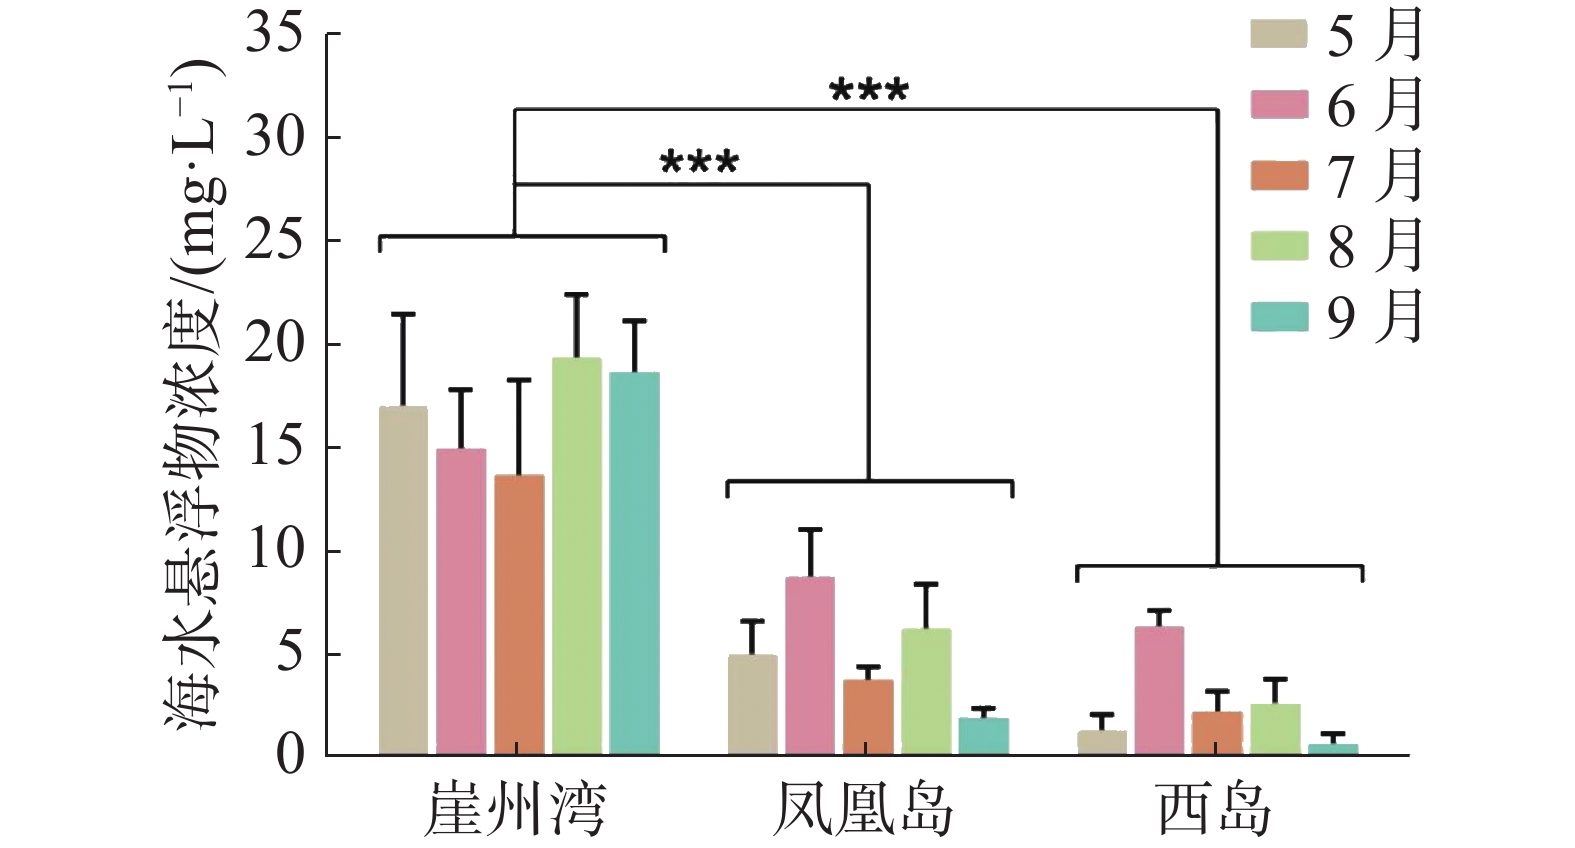
2020年5−9月,崖州湾礁区的海水悬浮物月平均质量浓度为13.7~19.4 mg·L−1,总平均质量浓度为16.3 mg·L−1;凤凰岛礁区的海水悬浮物月平均质量浓度为1.9~8.8 mg·L−1,总平均质量浓度为5.3 mg·L−1;西岛礁区的海水悬浮物质量浓度最低,月平均质量浓度为0.7~5.3 mg·L−1,总平均质量浓度为2.6 mg·L−1。双因素方差分析结果显示,崖州湾的海水悬浮物质量浓度显著高于凤凰岛和西岛(P < 0.05)(图2)。

-
从表1可见,普哥滨珊瑚SOD、CAT、NOS、GST和PO活力的平均值分别为111.60、119.83、9.46、253.99 U·mg−1和0.087 ΔOD 490 mg−1·min−1,SOD、NOS和PO活力的最高月平均值均来自6月份崖州湾,而CAT和GST活力的最高月平均值分别来自8月份西岛和5月份崖州湾。共生虫黄藻的平均密度为2.97×10⁶ cells·cm−2,叶绿素a+c2的平均含量为5.87 pg·cell−1,两者的最高月平均值都在7月份崖州湾。此外,共生虫黄藻SOD、CAT、NOS和GST活力的平均值分别为205.69、141.89、20.50和939.58 U·mg−1,SOD与NOS活力的最高月平均值均见于6月份凤凰岛,而CAT和GST活力的最高月平均值分别见于8月份凤凰岛和5月份西岛。
生理指标 月份 站点 崖州湾 凤凰岛 西岛 共生虫黄藻密度/(106 cells·cm−2) 5月 1.786±0.763 2.428±1.086 1.864±0.502 6月 3.689±1.512 4.821±0.608 2.674±0.341 7月 3.240±1.434 3.186±0.859 3.669±0.810 8月 3.805±1.144 4.175±1.189 2.888±0.756 9月 2.621±0.559 1.759±0.561 1.953±0.310 叶绿素a+c2含量/(pg·cell−1) 5月 4.269±1.810 2.351±1.516 5.134±0.767 6月 7.727±1.612 8.629±1.051 7.453±2.435 7月 4.845±3.01 5.974±1.797 6.869±1.755 8月 3.889±1.343 3.274±0.732 5.403±0.951 9月 8.25±1.875 6.649±2.091 7.319±2.174 珊瑚SOD活力/(U·mg−1) 5月 96.557±18.723 91.042±24.651 111.76±52.316 6月 174.365±75.431 149.883±88.966 68.109±50.648 7月 62.977±25.87 91.307±40.783 70.2±28.036 8月 122.752±35.68 92.791±37.929 130.209±95.128 9月 142.572±33.835 175.89±95.847 93.649±37.845 珊瑚CAT活力/(U·mg−1) 5月 42.548±15.742 40.784±21.284 67.636±50.313 6月 185.755±72.074 109.32±41.769 84.729±23.426 7月 148.234±44.363 213.818±23.847 137.154±45.086 8月 52.892±26.047 134.084±25.884 224.758±66.305 9月 135.837±11.744 150.012±60.795 69.901±22.223 珊瑚NOS活力/(U·mg−1) 5月 14.395±6.721 18.818±4.303 23.125±10.762 6月 33.877±25.169 9.495±4.450 10.888±7.496 7月 5.776±1.611 6.408±2.278 5.381±2.071 8月 2.308±2.261 1.359±0.917 1.782±1.742 9月 1.822±0.832 3.457±2.505 3.049±0.949 珊瑚GST活力/(U·mg−1) 5月 695.678±296.248 264.556±121.349 372.585±214.535 6月 186.977±85.356 319.531±365.753 494.294±499.845 7月 130.213±85.169 261.35±120.612 201.435±39.626 8月 90.904±59.698 137.689±60.233 205.653±137.246 9月 126.226±106.951 184.134±86.244 138.556±75.664 珊瑚PO活力/(ΔOD490 mg−1·min−1) 5月 0.0963±0.0467 0.0954±0.021 0.1279±0.0438 6月 0.1815±0.0418 0.1256±0.06 0.1105±0.0365 7月 0.1112±0.0384 0.1031±0.0174 0.1099±0.0357 8月 0.0445±0.0148 0.0389±0.0105 0.0499±0.0183 9月 0.0274±0.006 0.0465±0.0093 0.0339±0.0108 虫黄藻SOD活力/(U·mg−1) 5月 150.226±59.635 304.454±206.143 181.206±144.336 6月 112.355±66.322 388.6±146.152 239.389±138.104 7月 291.84±57.683 237.028±61.139 193.867±27.792 8月 56.681±33.557 86.351±52.701 131.422±88.059 9月 215.992±91.034 372.934±175.208 122.963±88.74 虫黄藻CAT活力/(U·mg−1) 5月 68.129±68.685 90.707±83.761 64.624±39.025 6月 154.1±74.579 275.716±115.045 184.314±76.283 7月 90.911±38.769 82.17±40.522 19.407±11.627 8月 83.671±33.861 340.214±124.129 114.47±42.137 9月 131.68±77.868 324.237±142.653 103.993±42.481 虫黄藻NOS活力/(U·mg−1) 5月 18.288±5.553 30.984±13.002 8.581±3.987 6月 42.994±15.7 84.53±17.596 48.802±26.827 7月 19.762±3.157 16.589±5.501 11.897±2.792 8月 6.3±1.303 7.187±5.29 5.362±2.124 9月 1.059±1.248 3.215±1.137 2.01±0.725 虫黄藻GST活力/(U·mg−1) 5月 719.759±403.716 1821.457±2090.806 2368.352±2154.323 6月 505.725±6.894 1058.016±262.674 948.036±477.025 7月 485.931±256.245 332.666±205.209 143.135±37.214 8月 285.938±224.64 230.056±130.254 284.081±142.298 9月 1222.728±548.522 2078.299±1085.766 1609.518±837.705 -
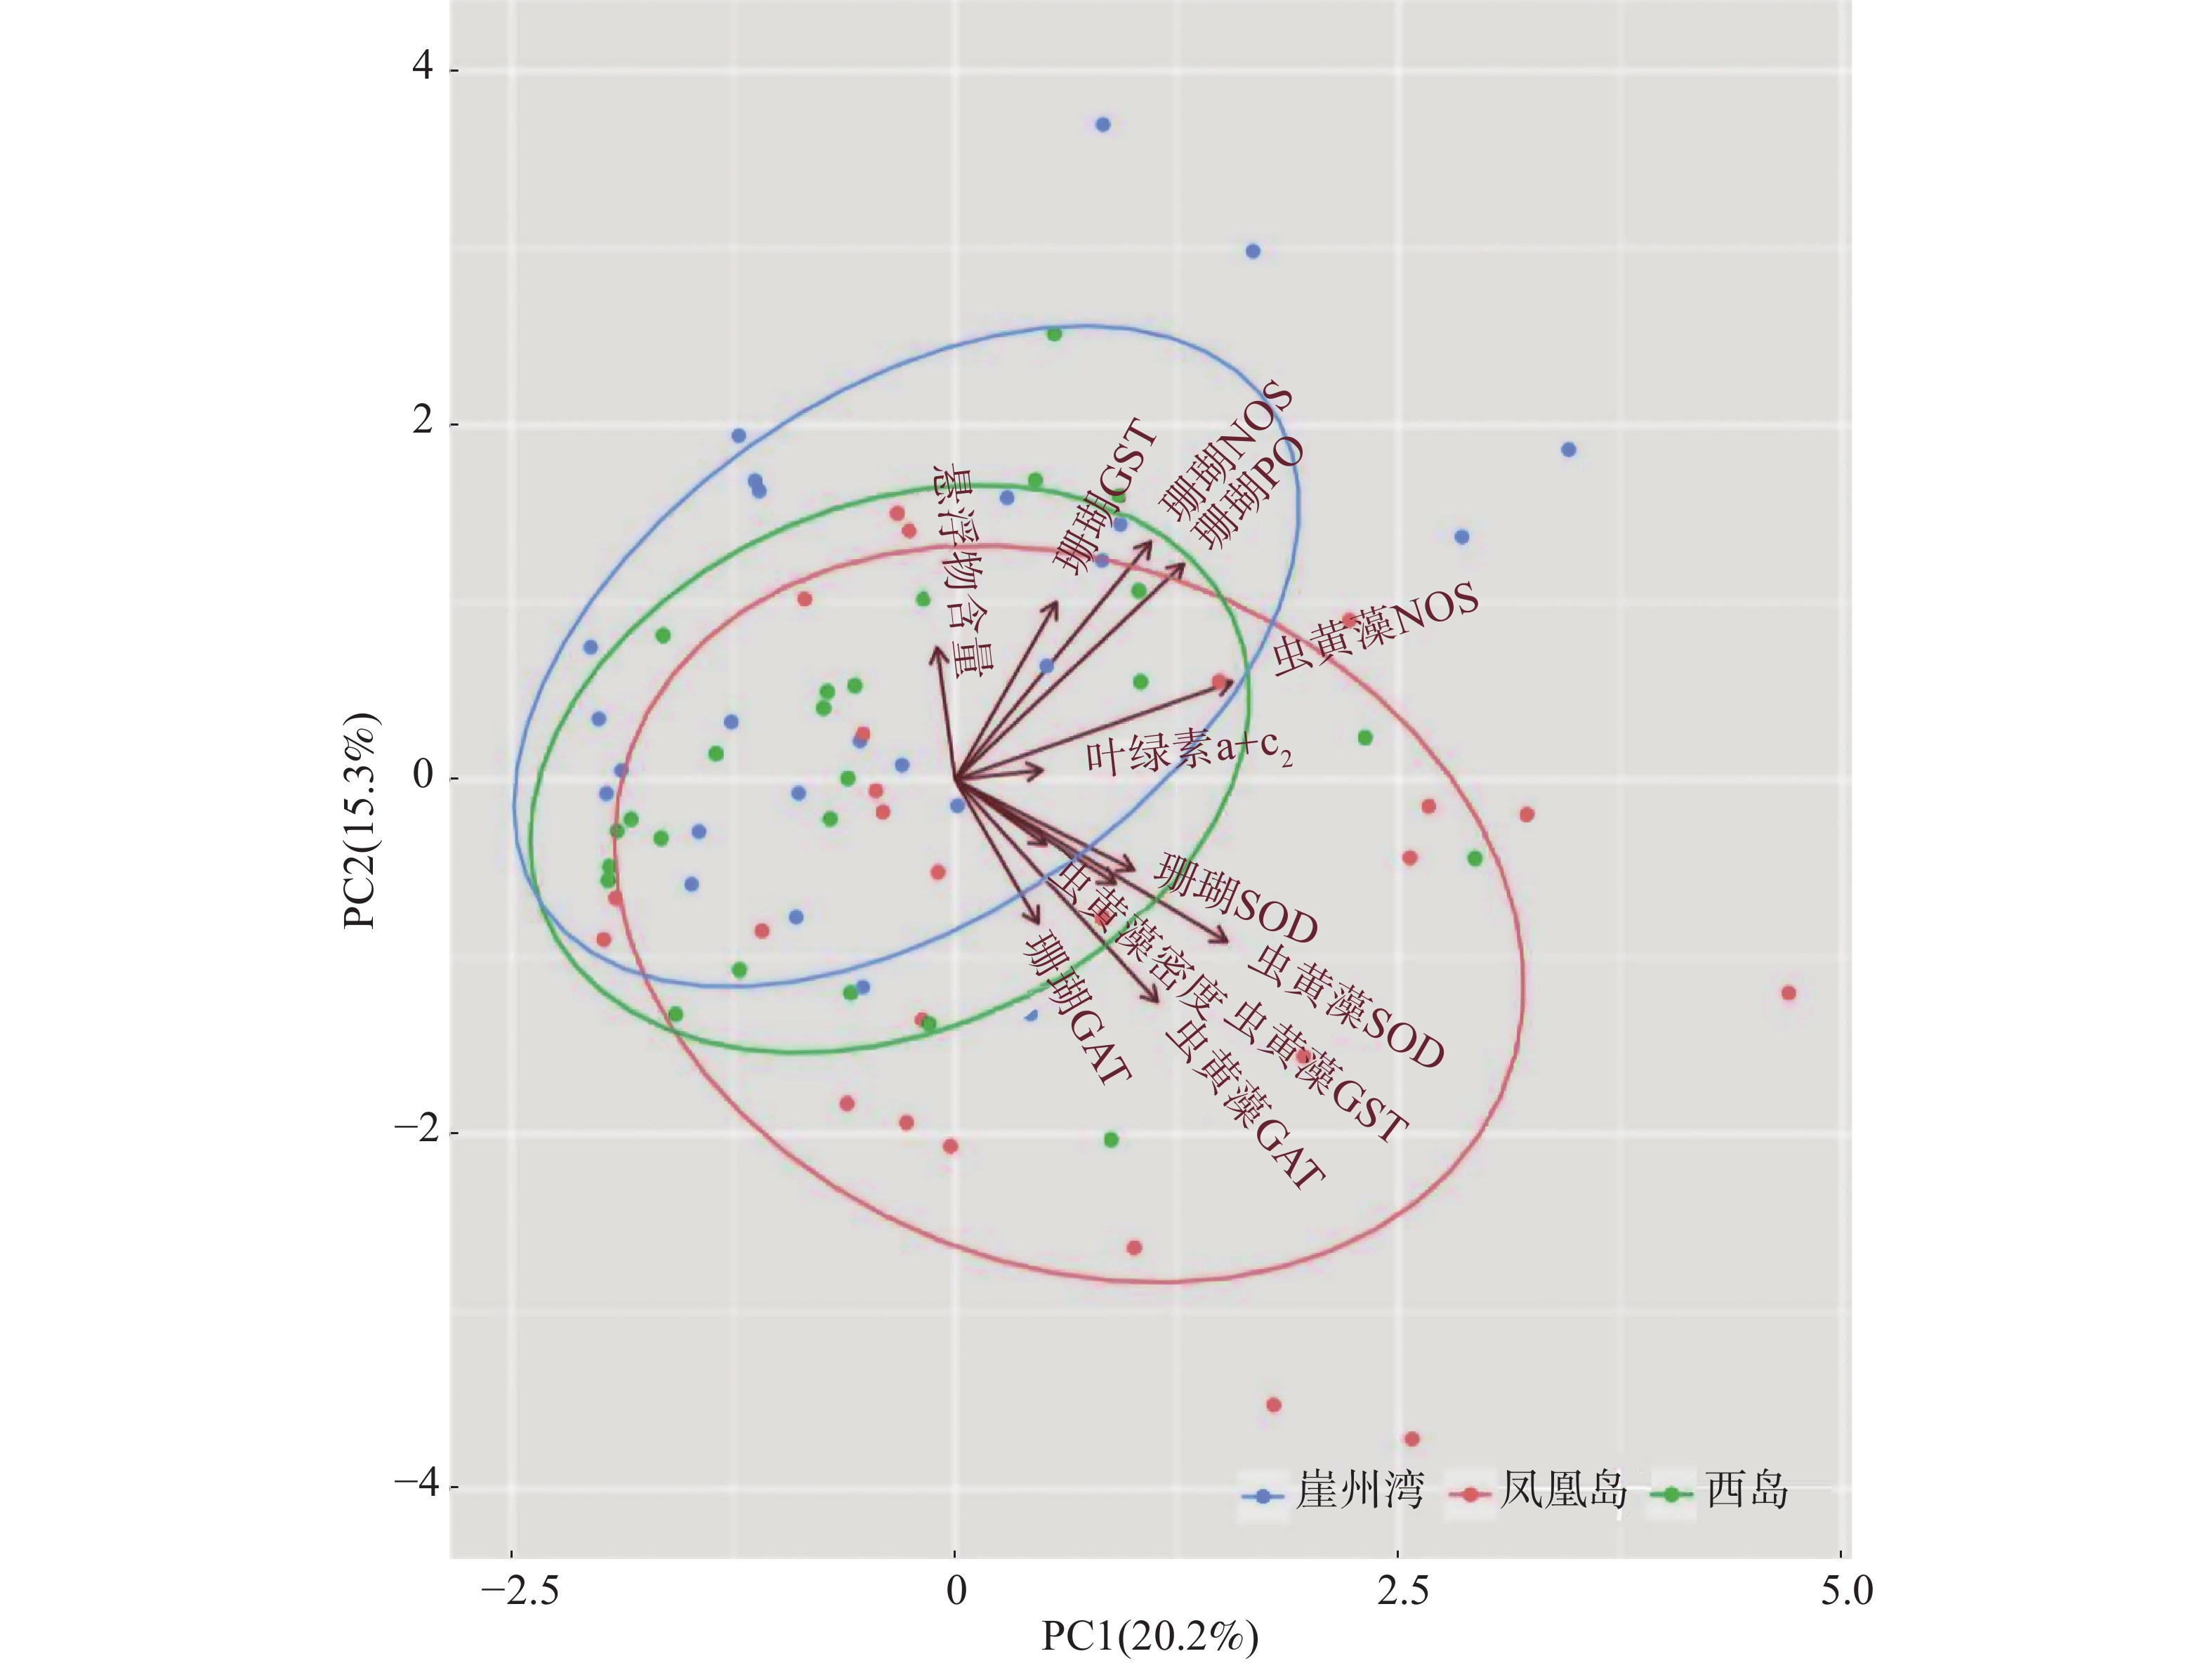
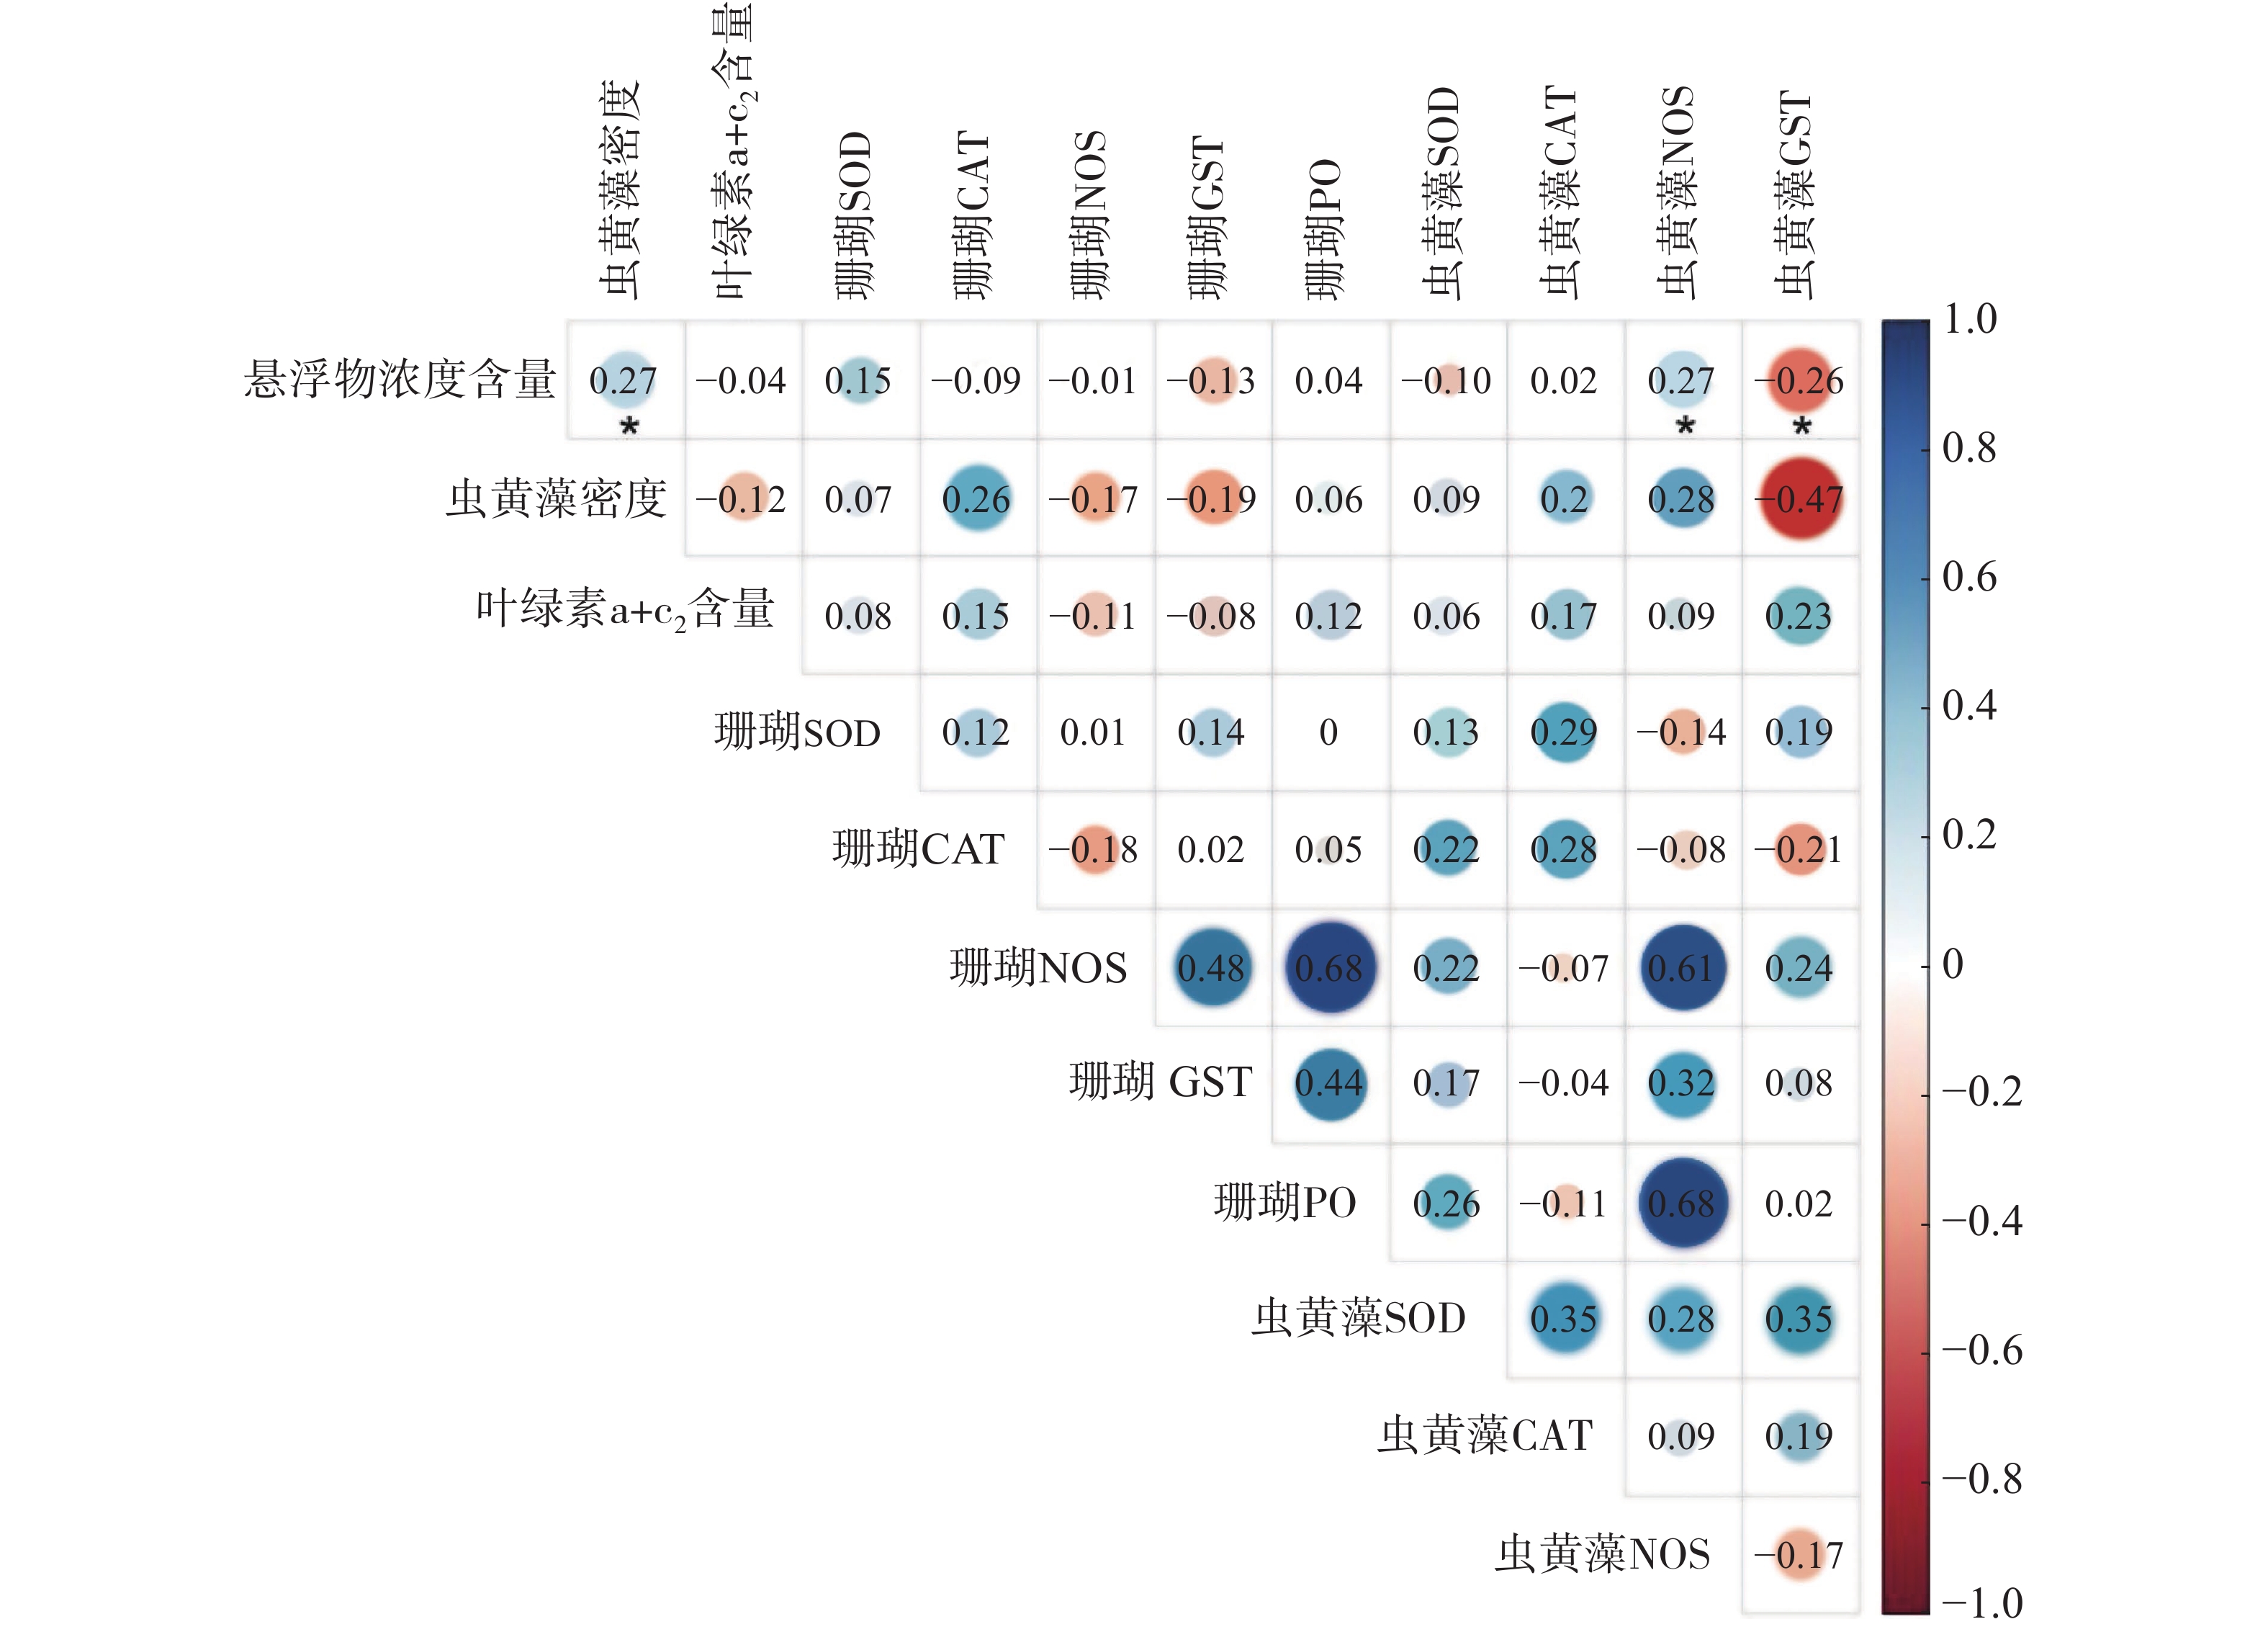
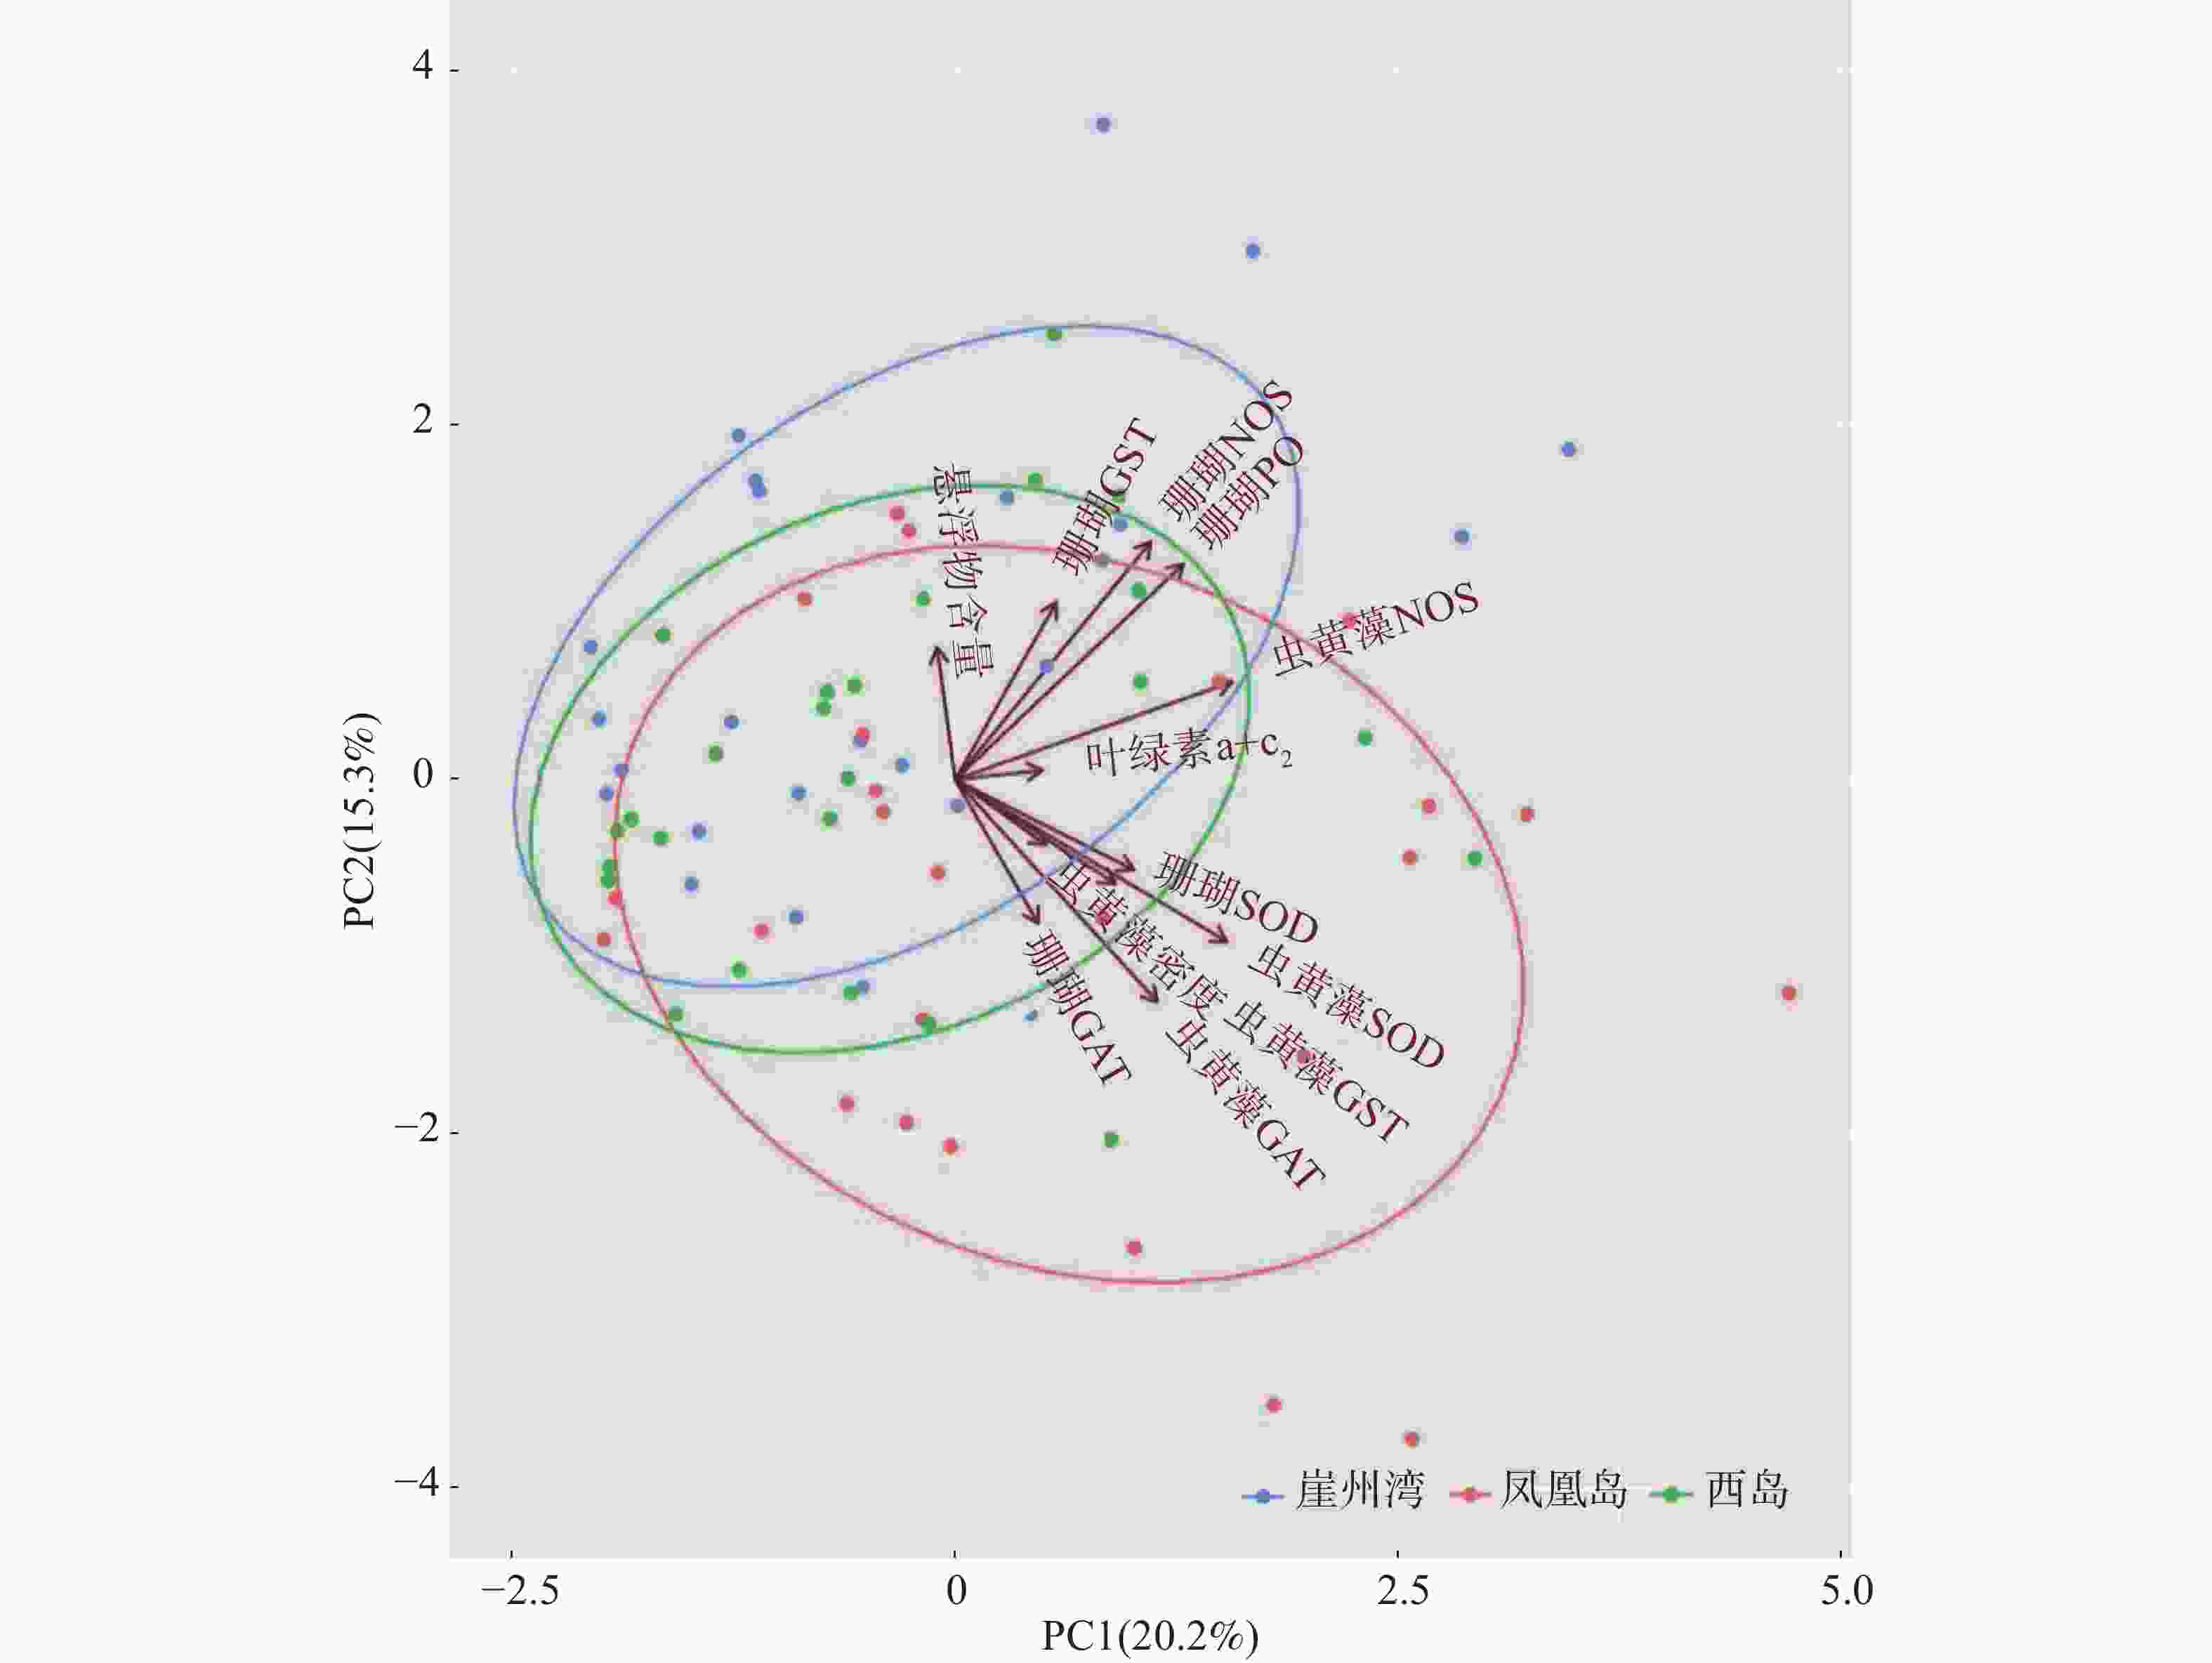
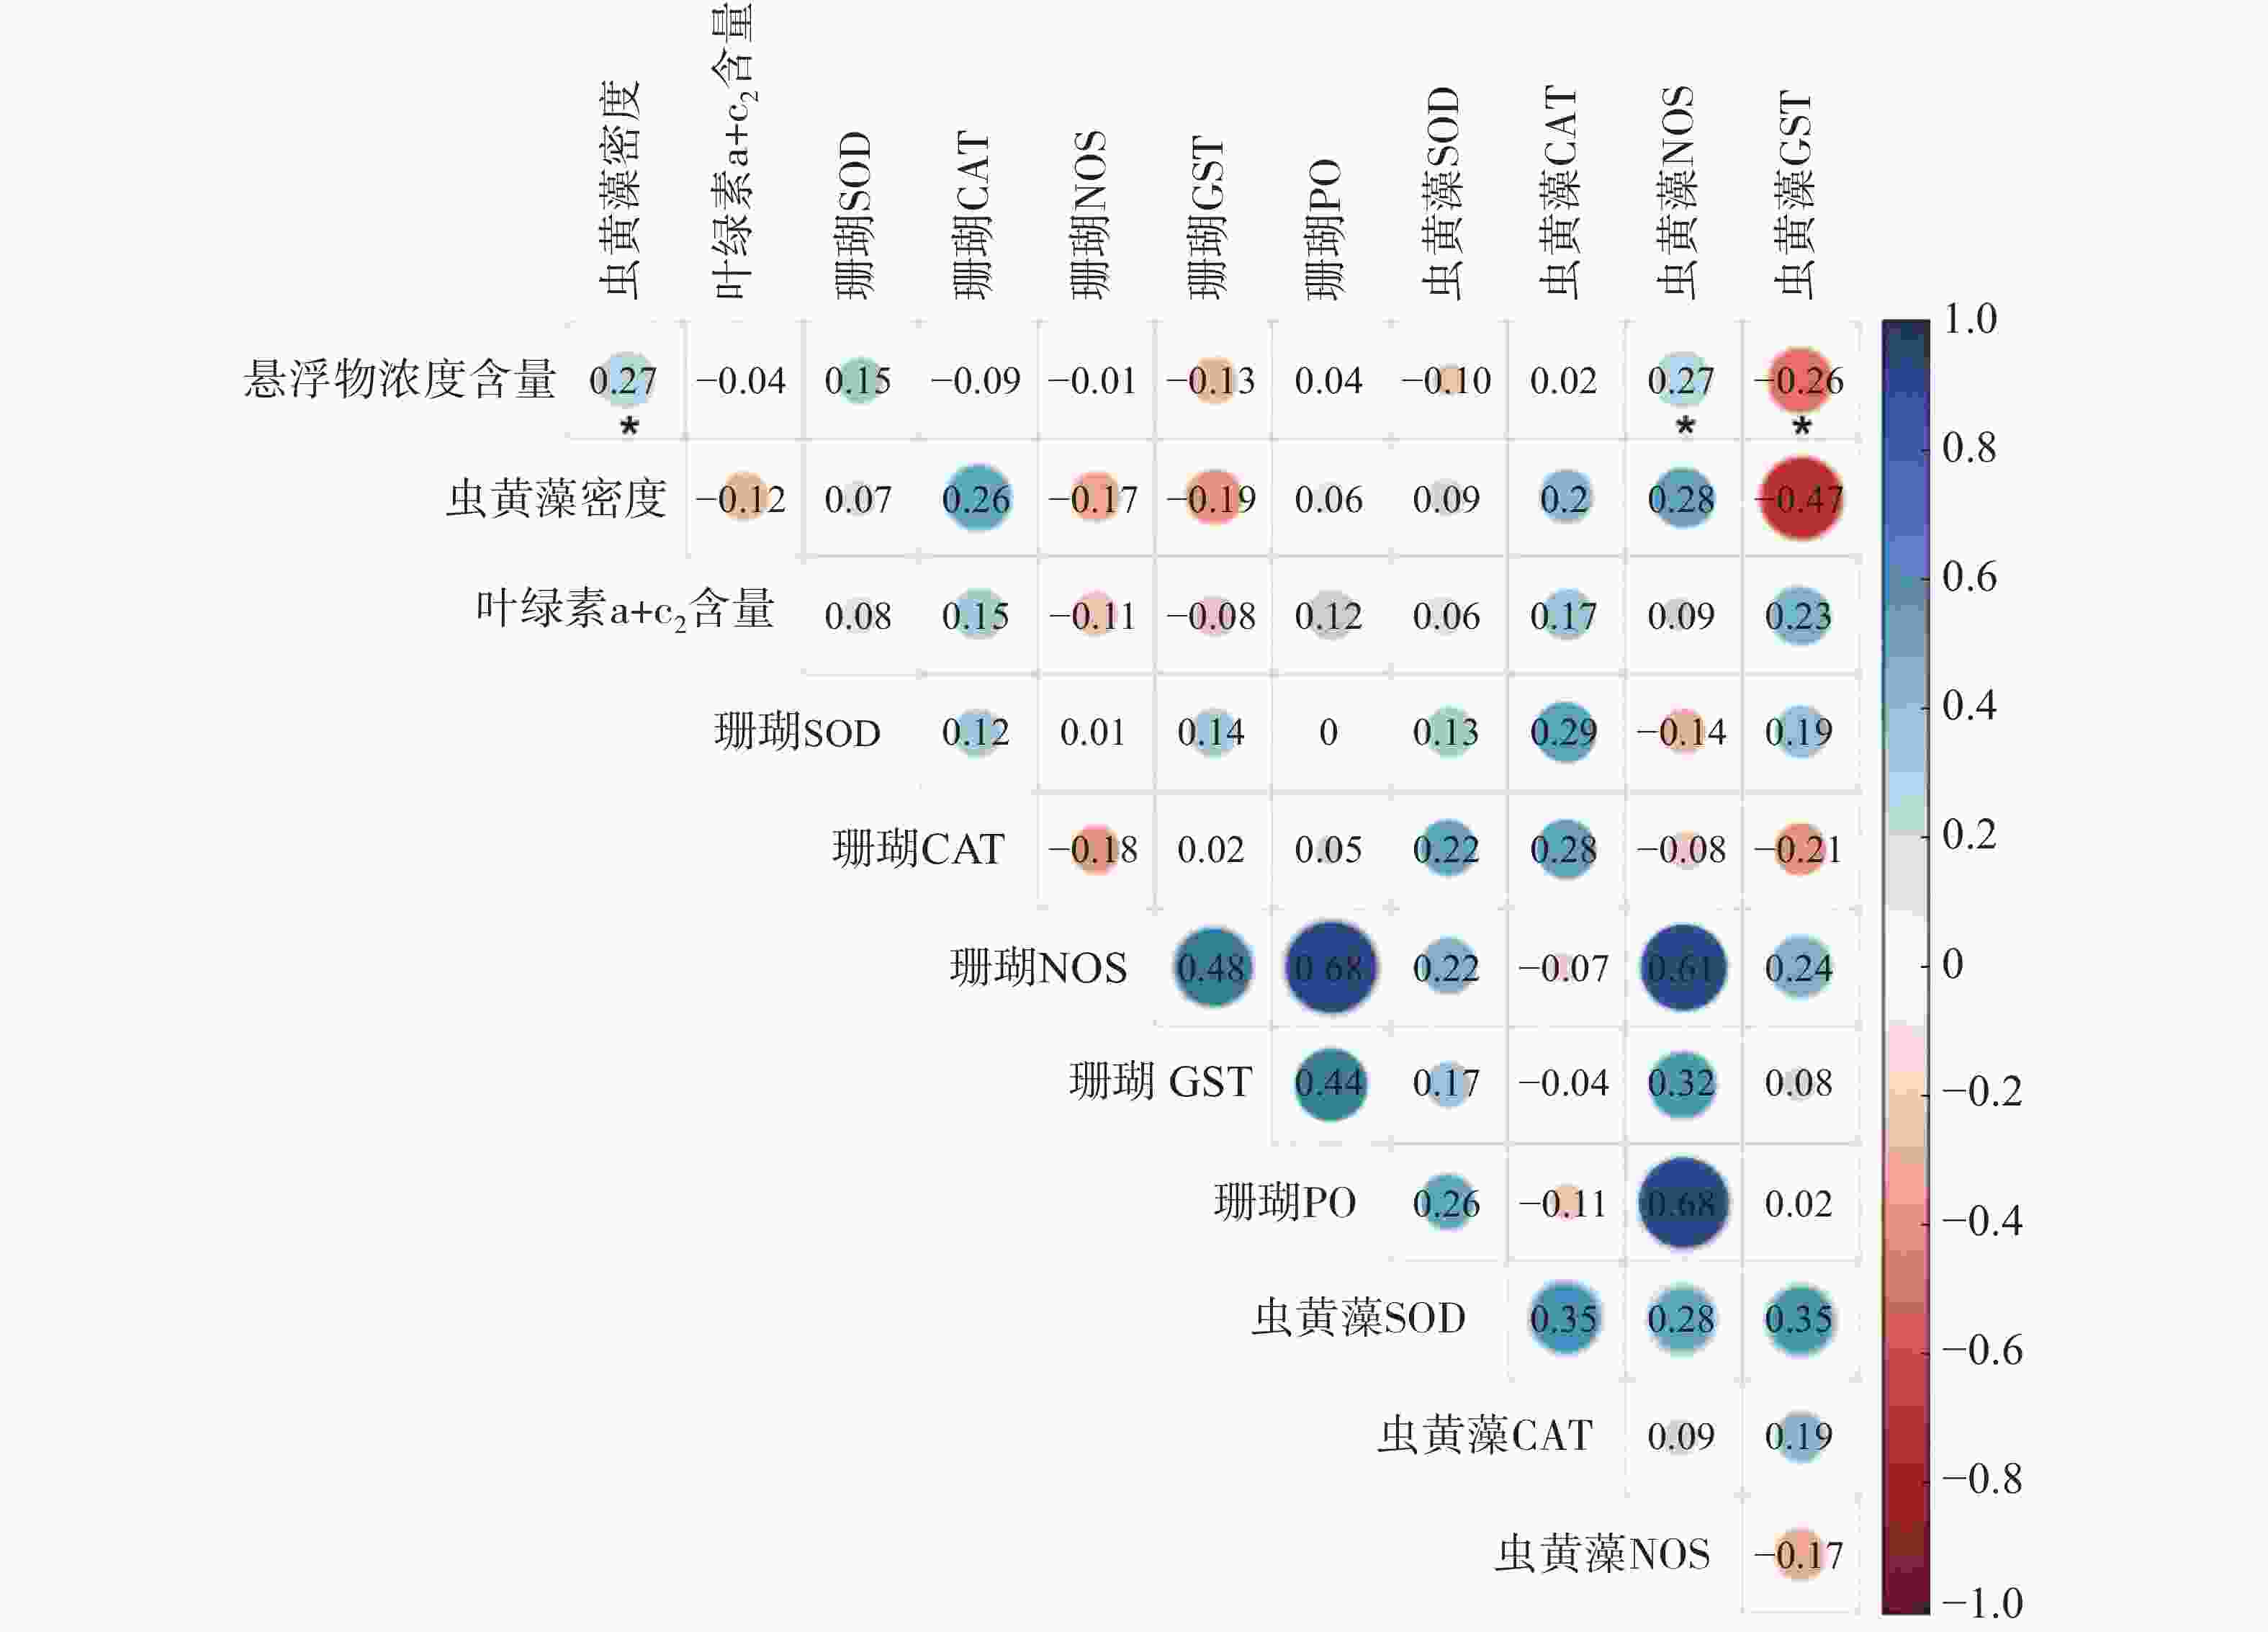
采用主成分分析方法(PCA)探索普哥滨珊瑚及其共生虫黄藻的各项生理活性指标的主效应。如图3所示,PC1占20.2%,PC2占15.3%,两者总和为35.5%,主效应不显著。同时,对各礁区海水悬浮物质量浓度与普哥滨珊瑚及其共生虫黄藻的各项生理活性指标进行关联分析。结果发现,海水悬浮物质量浓度与共生虫黄藻的密度和NOS活力均呈显著性正相关(R = 0.27,P < 0.05;R = 0.27,P < 0.05),而与共生虫黄藻的GST活力呈显著负相关(R = −0.26,P < 0.05)(图4)。
-
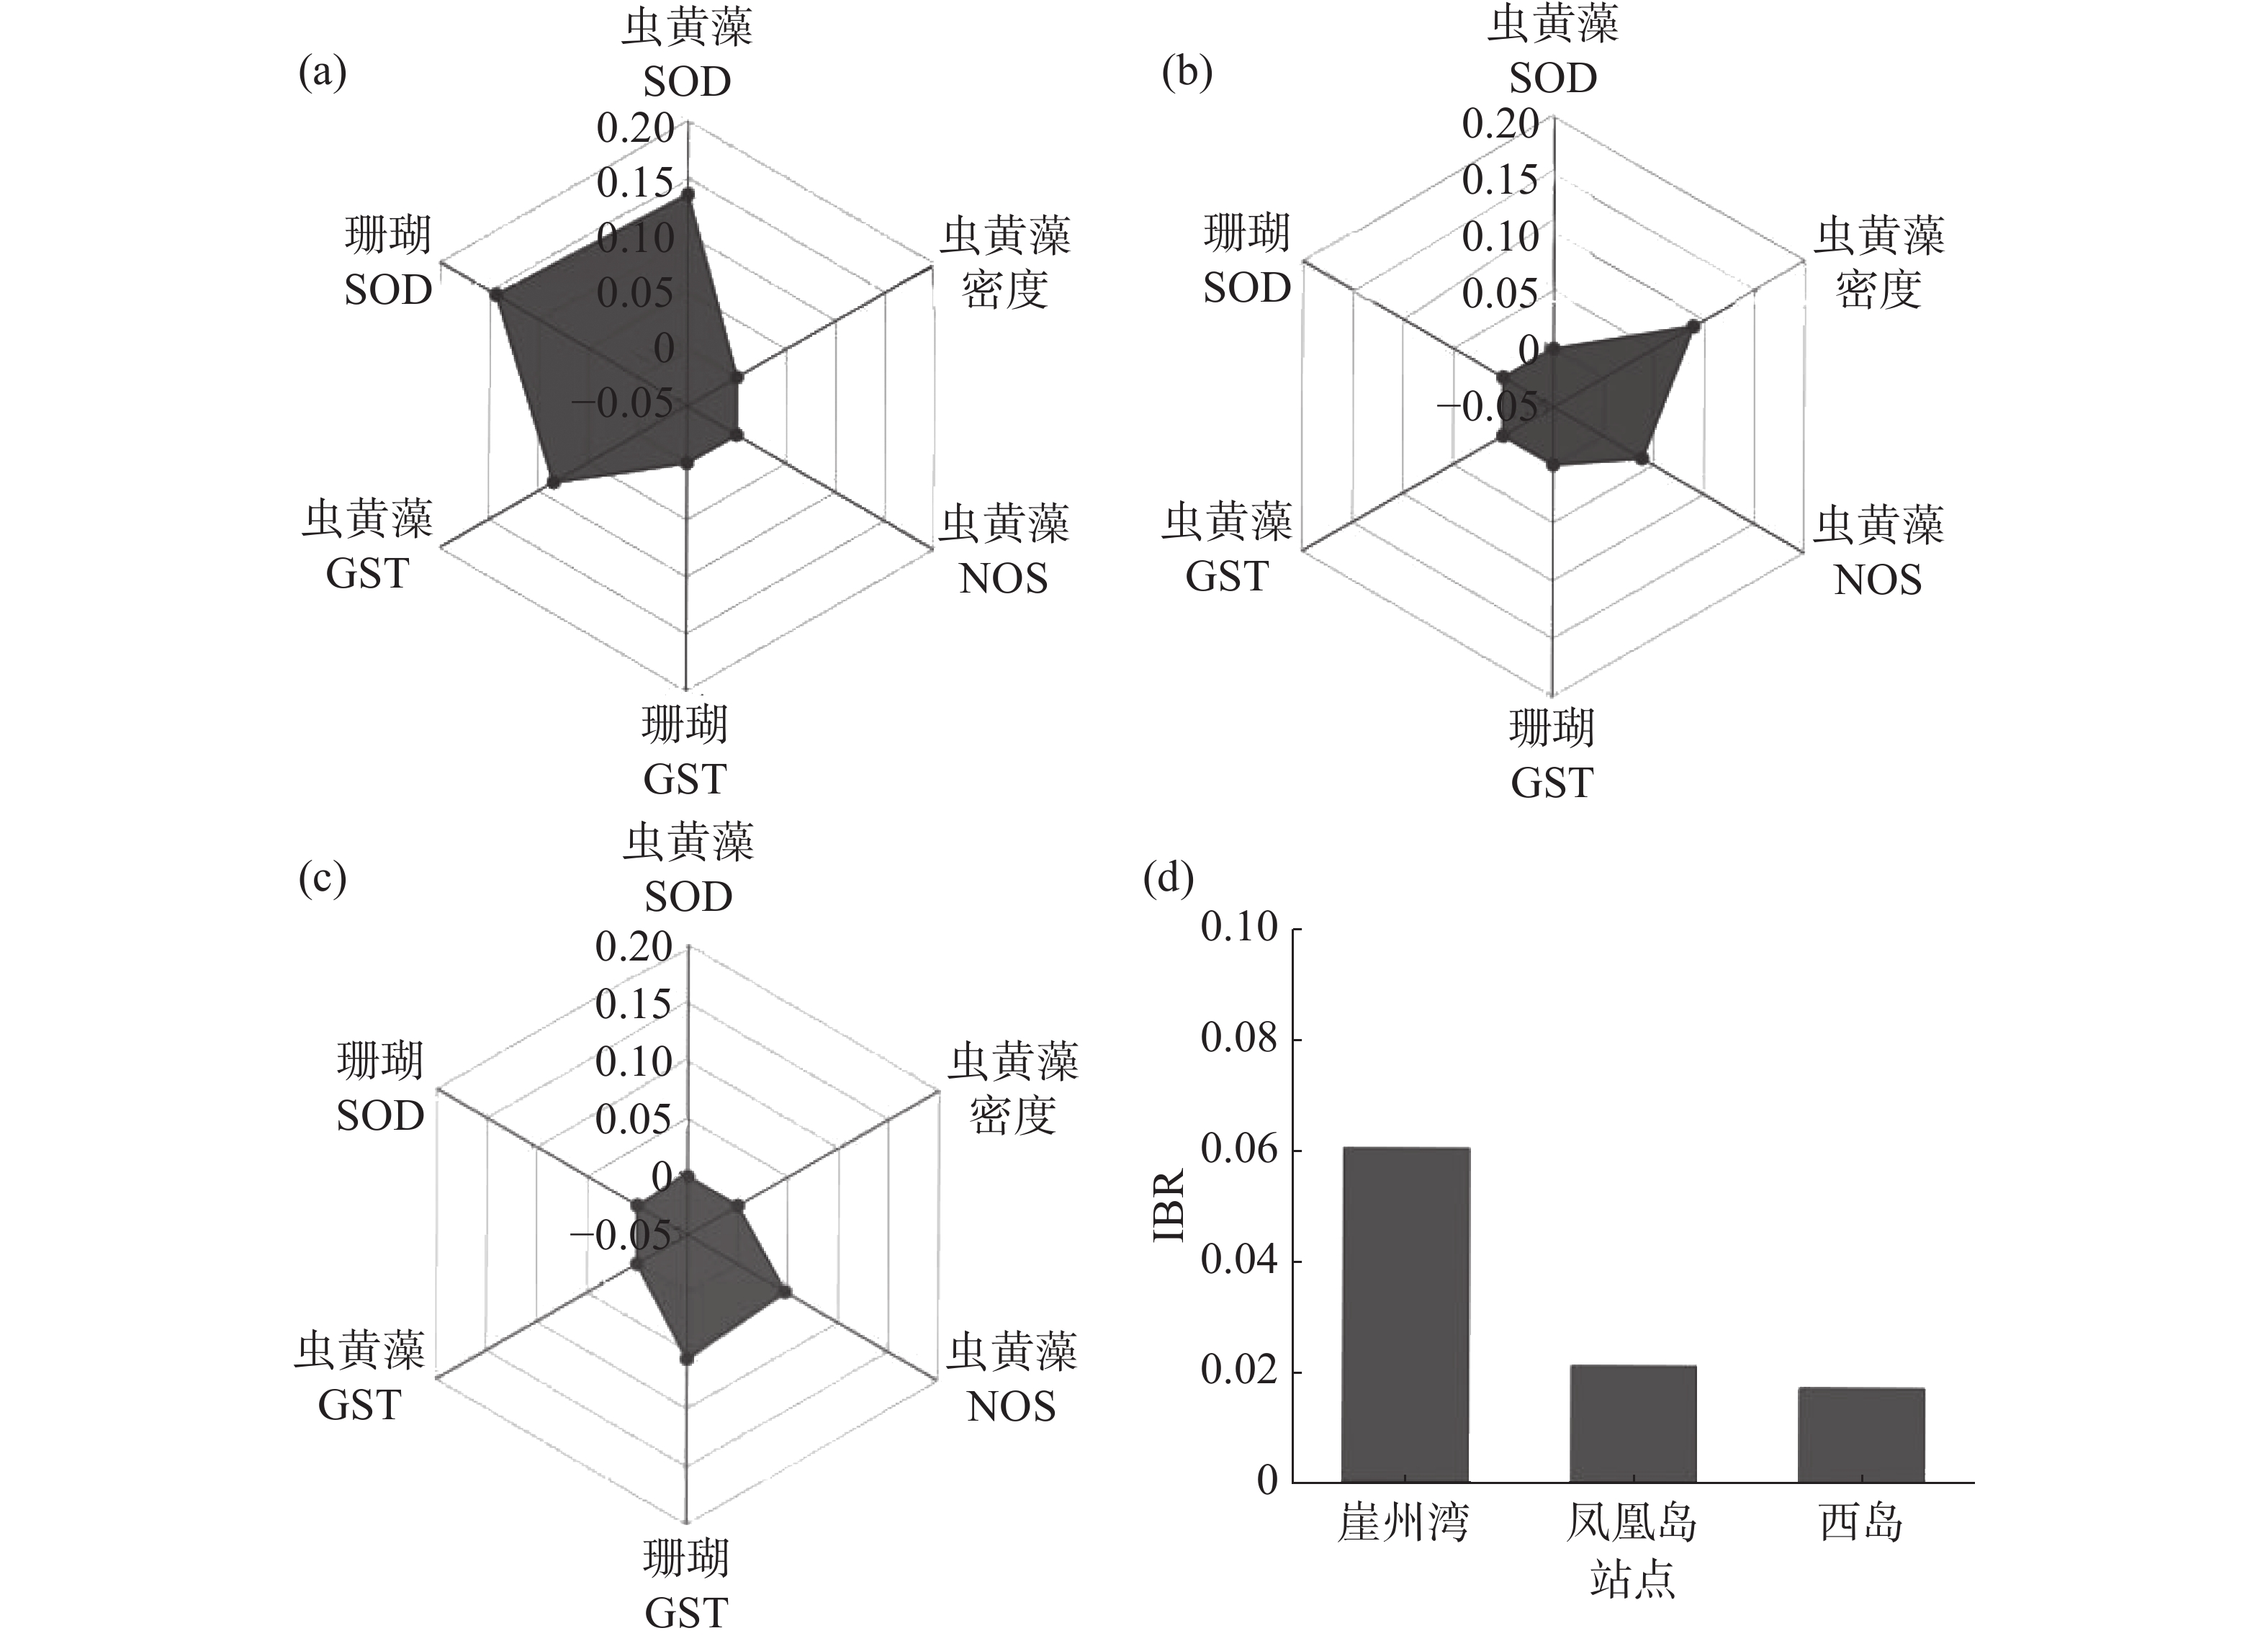
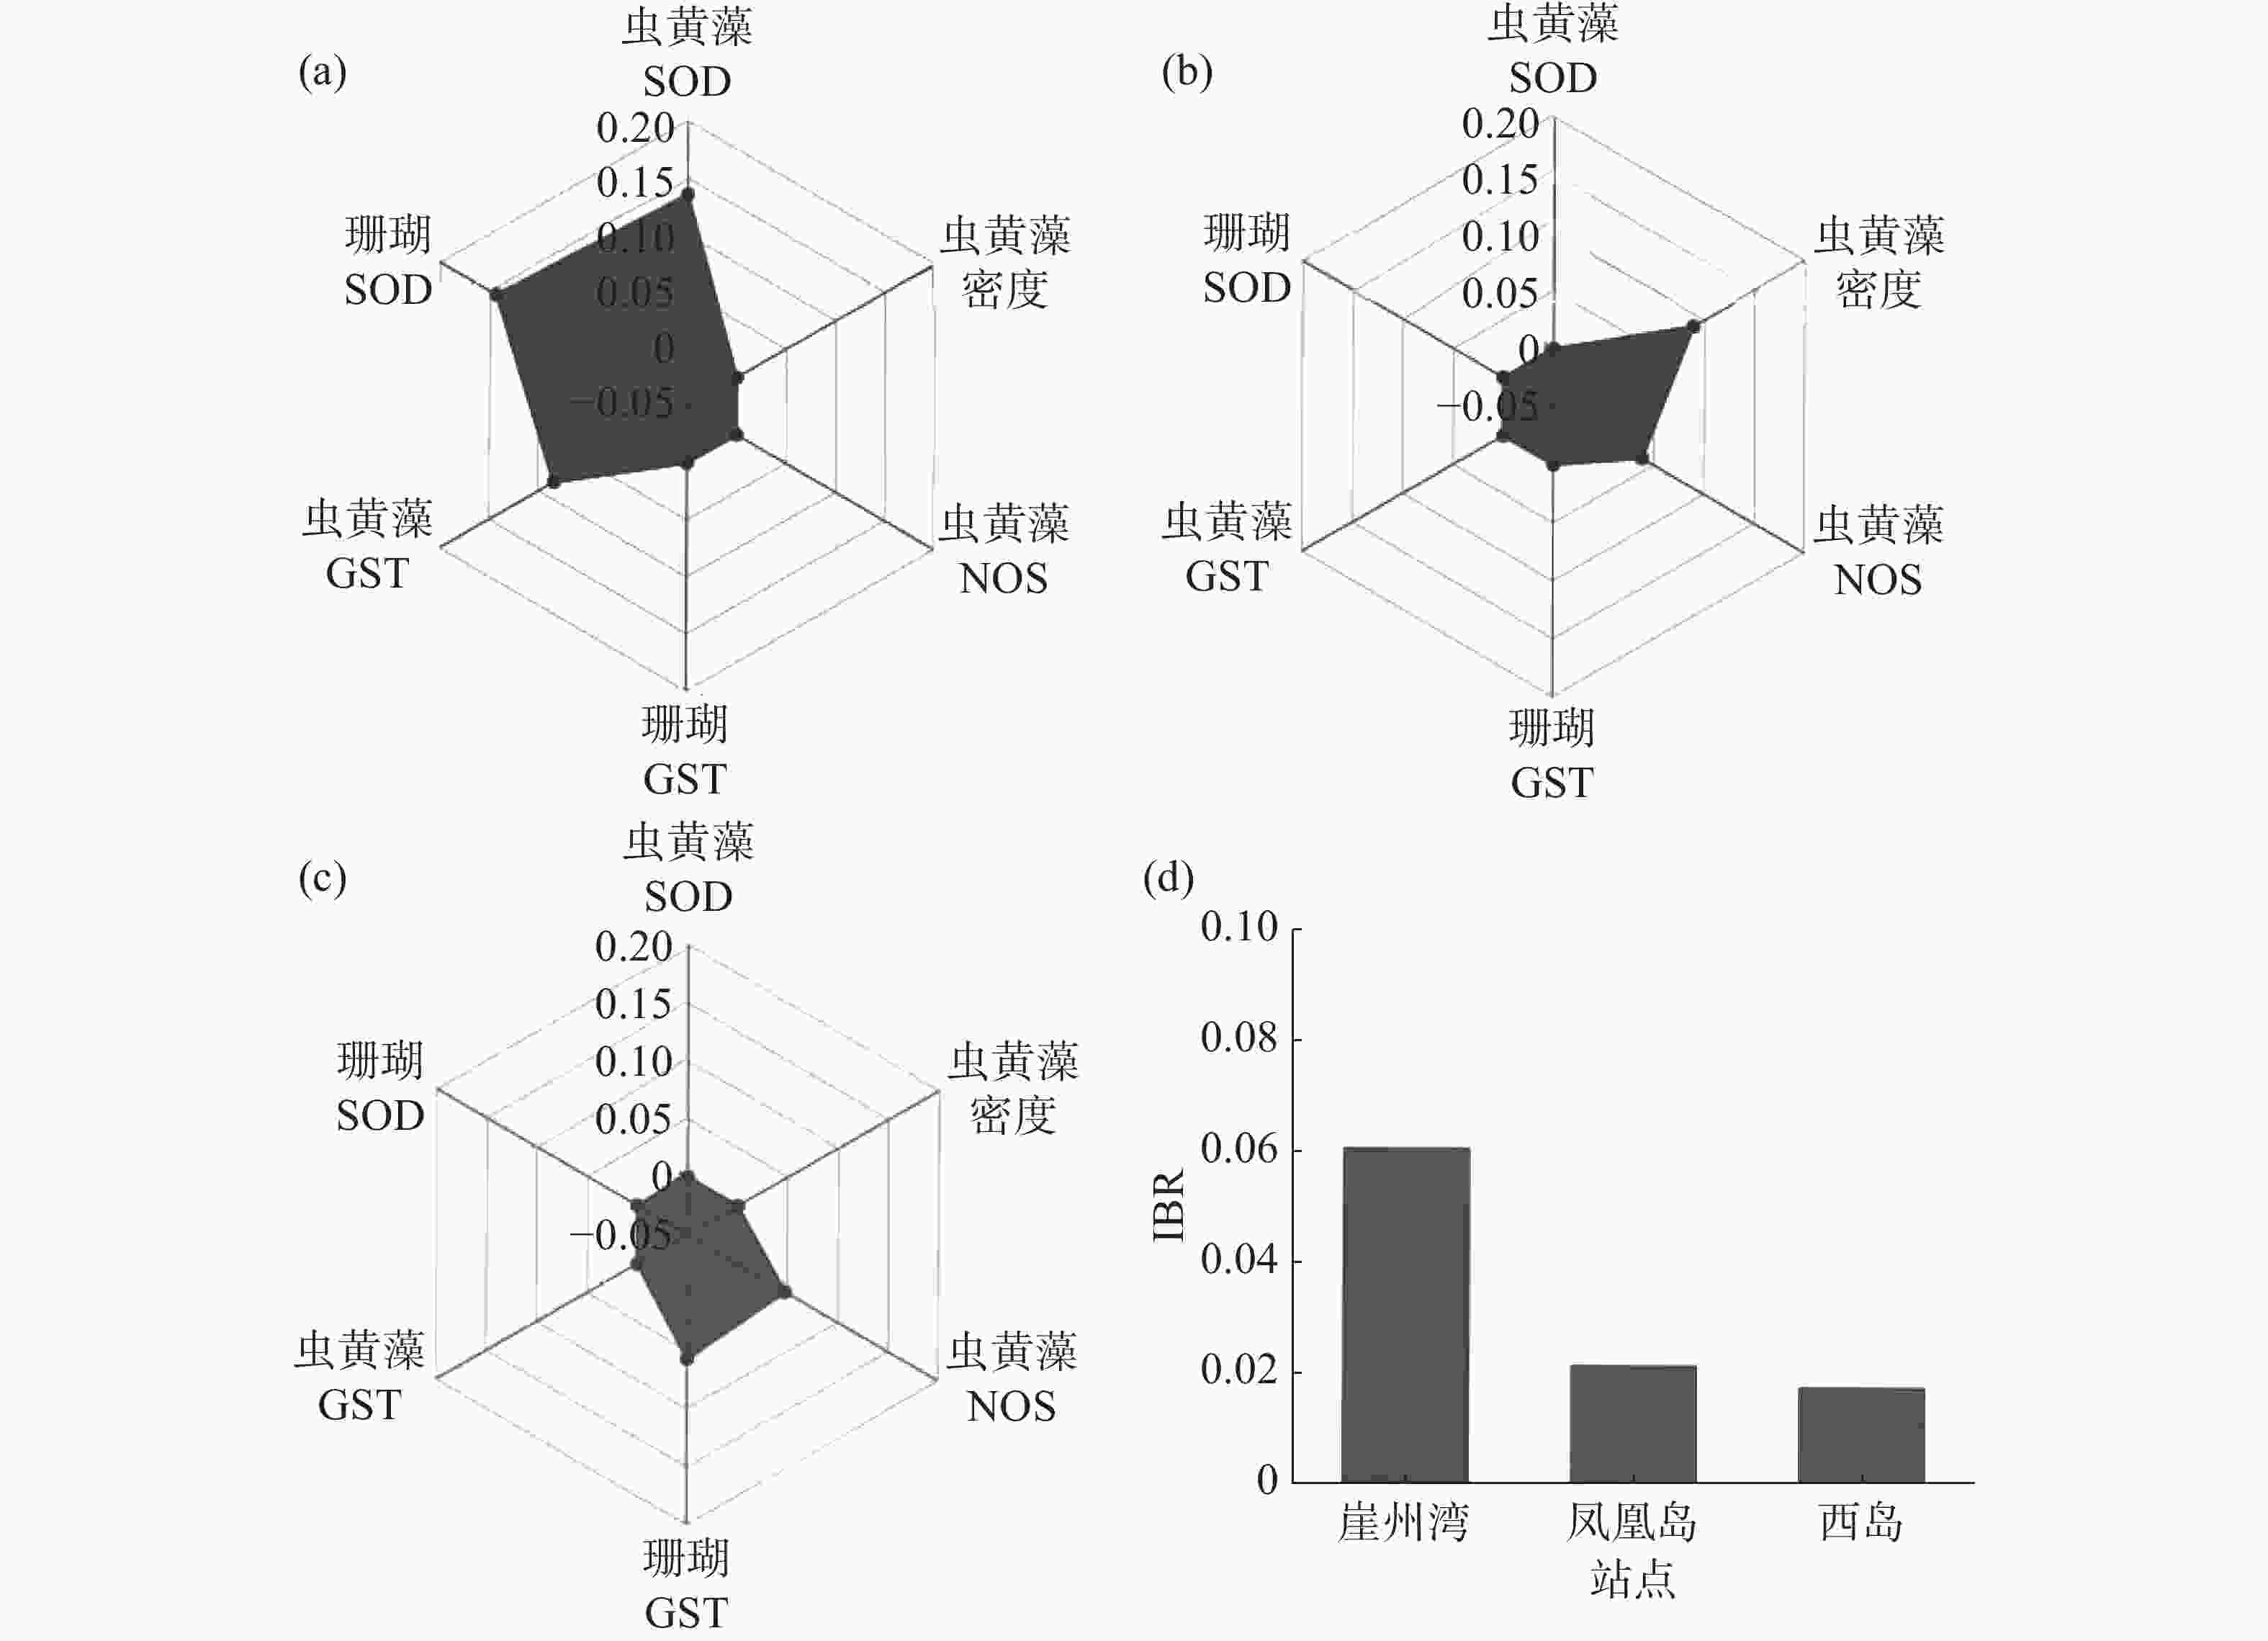
选与海水悬浮物质量浓度相关性相对高(R ≥ 0.1或 R ≤ −0.1)的生理活性指标(普哥滨珊瑚的SOD和GST活力,以及共生虫黄藻的密度、SOD、NOS和GST活力),计算和分析3个礁区(崖州湾、凤凰岛和西岛)普哥滨珊瑚的综合生物标志物响应指数,绘制了生物标志物星状图。崖州湾普哥滨珊瑚的综合生物标志物响应指数值最高,为0.060 5,凤凰岛为0.021 3,西岛仅为0.017 4(图5)。
-
近年来,随着人类对滨海的不断开发与利用,近海礁区水质明显下降,已严重威胁到珊瑚礁生态系统的健康和安全[16-17]。有研究表明,海水悬浮物浓度的升高是近岸珊瑚礁不断退化的原因之一[18-19],也有研究表明,在悬浮物浓度较高的海区一些珊瑚可以长时间生存[20]。为了揭示自然礁区中海水悬浮物对造礁石珊瑚的生理影响,本研究在三亚选取海水悬浮物浓度存在显著差异的3个礁区(崖州湾、凤凰岛和西岛),调查了海水悬浮物浓度的月际变化规律,检测了在3个礁区均分布的普哥滨珊瑚的生理活性,以期阐明造礁石珊瑚对高浓度悬浮物环境的适应机制。
笔者在调查中发现,崖州湾礁区的海水悬浮物质量浓度长期高于10 mg·L−1,超过了一类海水的相关标准[21]。崖州湾附近分布着大量水产养殖高位池,养殖过程中产生的残饵、排泄物、死亡生物和渔民生活污水等直接流入附近的珊瑚礁区;湾内南山港码头是三亚市的主要货运码头,来往大型货运船经常卷起底部沉积物,两者可能共同导致了崖州湾礁区海水悬浮物质量浓度的较高水平。凤凰岛毗邻临春河入海口,有城市污水的不断输入[22],这可能导致了凤凰岛礁区海水悬浮物质量浓度略高于西岛。因此,海水悬浮物污染已成为或将成为三亚近岸珊瑚礁的威胁因素之一。
赵美霞等[23]的调查结果表明,普哥滨珊瑚正逐渐成为三亚近岸珊瑚礁中的优势种,在海水悬浮物浓度较高的崖州湾礁区更是唯一幸存的珊瑚种。为了深入解析海水悬浮物对造礁石珊瑚的生理影响,本研究检测了3个礁区中普哥滨珊瑚的共生虫黄藻密度和叶绿素a+c2含量,以及珊瑚宿主和共生虫黄藻中环境胁迫相关酶(SOD、CAT、GST、NOS和PO)的活力。PCA分析发现,普哥滨珊瑚及其共生虫黄藻中多项生理活性指标的主效应并不显著。相关性分析表明,海水悬浮物质量浓度与共生虫黄藻的密度和NOS活力显著正相关,而与共生虫黄藻的GST活力显著负相关。与海水悬浮物质量浓度显著相关的指标均是共生虫黄藻的生理指标,表明普哥滨珊瑚通过调控共生虫黄藻的生理活性来适应高海水悬浮物浓度的礁区环境。三亚礁区海水悬浮物浓度(0.7~19.4 mg·L−1)的升高诱导了普哥滨珊瑚共生虫黄藻密度的增加,这与JONES等[24]的研究结果一致。这种诱导作用可归因于悬浮物对普哥滨珊瑚的遮荫效应,海水悬浮物质量浓度越高,共生虫黄藻获得的光照越不足,随之导致其光合作用产物减少。因此,普哥滨珊瑚能通过增加共生虫黄藻的密度来满足自身的能量需求,从而适应高海水悬浮物质量浓度环境。此外,海水悬浮物质量浓度的升高增加了共生虫黄藻的NOS活力,但抑制了其GST活力。因为共生虫黄藻的SOD和CAT活力与海水悬浮物质量浓度未呈显著相关性,NOS活力的上升可能并未导致胞内的过氧化水平,而是经由NO通路调节藻体的生理活性[25]。GST活性的下降可能会抑制共生虫黄藻的解毒水平,这可能是普哥滨珊瑚宿主降低共生虫黄藻的解毒耗能,而增加其对自身的能量供应[26]。因此,普哥滨珊瑚可能通过增加共生虫黄藻的密度和NOS活性,而降低其GST活力来适应高海水悬浮物质量浓度的崖州湾礁区环境。这种对不同海水悬浮物质量浓度的适应性调节与普哥滨珊瑚的综合生物标志物响应指数相一致,崖州湾的普哥滨珊瑚指数值> 凤凰岛 > 西岛。综上所述,普哥滨珊瑚能生存于较高海水悬浮物质量浓度环境的机制在于对共生虫黄藻生理的调控,包括对其密度和NOS活力的诱导,以及对GST活力的抑制。
笔者比较了三亚3个礁区的海水悬浮物浓度,分析了海水悬浮物浓度与普哥滨珊瑚及其共生虫黄藻的各项生理指标间的关系,并构建了3个礁区普哥滨珊瑚的综合生物标志物响应指数,发现崖州湾礁区海水悬浮物浓度最高,普哥滨珊瑚可能通过诱导共生虫黄藻的密度和NOS活力以及抑制共生虫黄藻的GST活力,来适应崖州湾礁区的较高悬浮物环境。此外,本研究构建的综合评价指标能够评估悬浮物对普哥滨珊瑚的影响程度,以期为珊瑚礁生态风险评估提供理论基础。
Physiological acclimatization of the scleractinian coral Porites pukoensis to suspended solids in Sanya coral reefs
doi: 10.15886/j.cnki.rdswxb.2022.03.001
- Received Date: 2022-01-05
- Accepted Date: 2022-03-03
- Rev Recd Date: 2022-02-26
- Available Online: 2022-03-14
- Publish Date: 2022-05-23
-
Key words:
- suspended solid /
- Porites pukoensis /
- Symbiodiniaceae /
- acclimatization
Abstract: Elevated concentrations of suspended solids in seawater threaten the survival of scleractinian corals, but little is known about the mechanism of this phenomenon. During May-September 2020, a survey was made of the concentration of suspended solids in seawater in the coral reef areas of Yazhou Bay, Phoenix Island and West Island in Sanya, Hainan, China and the physiological indexes of the scleractinian coral Porites pukoensis and its Symbiodiniaceae symbionts were determined, from which sensitive biomarkers were screened to evaluate the effect of suspended solids on P. pukoensis. The results showed that the concentration of suspended solids in the seawater of Yazhou Bay reef area was 13.7 − 19.4 mg·L−1, which was significantly higher than that in Phoenix Island (1.9 − 8.8 mg·L−1) and West Island (0.7 − 5.3 mg·L−1). The correlation analysis revealed significant positive correlations between suspended solids and the symbiotic density (R = 0.27, P < 0.05) or nitric oxide synthase activities (R = 0.27, P < 0.05), while the glutathione S-transferase activities in the symbionts were significantly negatively correlated with the concentration of the suspended solids. All these results suggest that P. pukoensis is adapted to the reef environment with a high concentration of suspended solids through the induction of symbiotic density and NOS activity and the inhibition of GST activity. Moreover, the integrated biomarker response (IBR) index established herein is in the descending order of Yazhou Bay > Phoenix Island > West Island, which is consistent with the order of the contents of the suspended solids in this coral reef area, indicating that the IBR index can be used for ecological risk assessment of coral reefs.
| Citation: | CAI Wenqi, TANG Jia, WU Chuanliang, ZHANG Kaidian, ZHOU Zhi. Physiological acclimatization of the scleractinian coral Porites pukoensis to suspended solids in Sanya coral reefs[J]. Journal of Tropical Biology, 2022, 13(3): 203-211. doi: 10.15886/j.cnki.rdswxb.2022.03.001

|
 DownLoad: