


-
榴莲(Durio zibethinus Murr.),又名韶子、麝香猫果,锦葵目锦葵科榴莲属植物,是东南亚特有的一种重要的特色水果,原产于马来群岛的文莱、印度尼西亚等地,是巨型热带常绿乔木,有着“水果之王”的美誉,是一种经济价值较高的热带水果[1],因其产生的强烈的硫酰基香味而闻名[2]。榴莲果实中富含蛋白质氨基酸等营养物质,以及丰富的矿质元素,如氮(N)、磷(P)、钾(K)、钙(Ca)、镁(Mg)、铁(Fe)、锌(Zn)等,还具有很好的保健功能[3]。此外,榴莲具有极高的药用价值,经常食用可以强身健体、补肾健脾、温通散寒、补血益气等功效[4-5]。榴莲现为东南亚国家广泛种植的经济作物,已成为各主产国的重要经济来源[6-7]。据统计,全世界种植的榴莲品种超过300个,主要品种为金枕、干尧、猫山王等。泰国是最大的榴莲生产国和出口国[4]。从中国海关的统计数据看,中国进口榴莲均主要来自泰国,2023年中国进口的鲜榴莲数量与金额均创历史新高,分别达142.59万t和67.16亿美元[8]。
作为热带岛屿省份,海南省榴莲种植刚刚起步,随着榴莲品种的不断引种栽培及海南本土榴莲产业的兴起,果实的产量及品质等特征有待验证,施肥管理技术尚未成熟,存在的问题也逐渐凸显出来,表现出畸形果、出肉率低、品质差等方面。果实的品质对于市场竞争力至关重要。果树在生长发育过程中,矿质元素直接影响着果实产量和品质的形成。矿质元素的缺失或过量都会对果树的生理代谢、品质改善及产量产生影响,若缺乏某种矿质元素,将导致果实生长受限、产量减少、品质下降[9-10]。如K、Ca等能够促进果实的生长、色泽、口感等方面的改善。另外,Mg、硼(B)等矿质元素也是果实中不可缺少的元素,它们对果实的味道、糖分含量等方面有着重要作用,而糖酸组分是决定果实风味的关键因素。目前,主要有对不同榴莲品种进行品质差异性研究[11-12],以及对果实中营养成分[13-14]、挥发性成分[15-16]和果皮的应用[17-18]等方面进行研究,且在苹果[19]、梨子[20]、葡萄[21]、荔枝[22-23]等对矿质元素含量与品质之间的关系有相关研究,在榴莲果实上少有提及。本研究以金枕榴莲栽培品种为研究对象,分析比较果实品质与矿质元素含量的关系和差异,评价影响果实各项品质指标的主要矿质因子,为合理施用养分肥料、生产优质高效榴莲提供理论依据和技术支持。
-
供试品种为金枕榴莲,果实样品于2024年7月分别采集于三亚、陵水、乐东、保亭4个市县的榴莲园,树龄4~5 a,树体长势良好,生长发育正常。
-
每个果园选取9株榴莲树;在树冠分布的同一高度,每株树选择果实大小、成熟度一致的果实采摘;每3株为1重复、每株每次采1个果实,重复3次。
-
果实采摘后立即带回实验室进行处理。将果实分成果皮、果肉、果核,进行矿质元素分析和品质分析。方法:用电子天平测定单果、果皮、果肉及果核的质量,计算可食率和记录种子个数;用游标卡尺测量果皮厚度及果实纵横径并计算果形指数;用排水法测量果实体积。将果实分皮、肉、核处理后装袋并做好编号,再分别置于烘箱105 ℃下杀青30 min,再调至75 ℃烘干至恒重,测量干质量,计算含水量,并将其粉碎装袋备用。
可食率(%)=(单果质量–果皮质量–种子质量)/单果质量×100
果形指数=纵径/横径
果实含水量(%)=(鲜质量–干质量)/鲜质量×100
N、P、K、Ca、Mg、硫(S)、Fe、锰(Mn)、铜(Cu)、Zn、B含量的测定参照土壤农化分析[24],氮采用H2SO4-H2O2消煮–纳氏试剂比色法;磷采用H2SO4-H2O2消煮—钼锑抗比色法;钾采用干灰化—火焰光度法;钙、镁、铁、锰、铜、锌采用干灰化—原子吸收法;硼采用干灰化—姜黄素比色法;硫采用HNO3-HClO4-HCl消煮—硫酸钡比浊法。将果实分皮、肉、核测定其含量,再计算果实含量。
果实含量=(用皮肉核各部位含量×其干物质量)/其总干物质量
可溶性固形物含量测定采用折射仪法[25],可溶性糖测定采用3,5−二硝基水杨酸比色法[26],总酸含量测定采用酸碱指示剂滴定法[27],维生素C含量测定采用2,6−二氯靛酚滴定法[28],糖酸比、固酸比以可溶性糖和可溶性固形物含量除以总酸含量的比值表示。
-
采用Microsoft Excel 2019和SPSS 26.0对试验数据进行皮尔逊相关分析及线性回归分析,采用Origin 2022软件作图。
-
从表1可见,果形指数在1.17~1.41,趋于长圆形,变异系数为5.44%;单果质量变幅为1.44~2.84 kg,变异系数为20.73%;果皮质量变幅为0.90~1.77 kg,变异系数为22.47%;果肉质量变幅为0.40~0.88 kg,变异系数为21.86%;果核质量变幅为0.03~0.19 kg,变异系数为47.15%;果体积变幅在2.00~3.91 dm3,变异系数为21.63%;果实密度变异系数最小,为2.42%;种子个数变异系数最大,为52.44%;果皮厚度变幅为9.58~15.00 mm,变异系数为20.16%,可见果核的变异系数较大。
指标
Index横径/cm
Transverse
Diameter纵径/cm
Longitudinal
diameter果形指数
Fruit shape
index单果质量/kg
Fruit
weight果皮质量/kg
Peel
weight果肉质量/kg
Fruit flesh
weight果核质量/kg
Stone
weight体积/dm3
Volume密度/cm3
Density种子
个数/个
Number of
seeds果皮厚/mm
Pericarp
width平均值
Average18.52 23.76 1.28 2.15 1.40 0.65 0.10 2.91 0.74 7.33 12.52 标准差
Standard
deviation1.66 2.03 0.07 0.45 0.31 0.14 0.05 0.63 0.02 3.85 2.53 最大值
Maximum21.63 27.54 1.41 2.84 1.77 0.88 0.19 3.91 0.76 14.00 15.52 最小值
Minimum16.21 20.00 1.17 1.44 0.90 0.40 0.03 2.00 0.71 3.00 9.48 变异系数/%
Coefficient of
variation8.95 8.54 5.44 20.73 22.47 21.86 47.15 21.63 2.42 52.44 20.16 Table 1. Fruit externally morphological index
-
由表2可见,固酸比变异系数最大,其次为糖酸比,分别为34.71%和34.19%,变异系数最小的是含水量,为3.17%。可溶性固形物含量变幅为20.00%~29.15%,变异系数为12.01%;可溶性糖含量变幅为12.88%~18.54%,变异系数为11.12%;总酸含量变幅为0.13%~0.31%,变异系数为32.23%;每100 g果实中Vc含量变幅为33.41~52.76 mg,变异系数为17.27%;可食率变幅为23.63%~38.99%,变异系数为14.57%。
指标
Index可溶性固形物含量/%
Soluble solids
content可溶性糖含量/%
Soluble
sugar总酸含量/%
Total
acid每100 g果实
中Vc含量/mg
Vc Content per 100 g
fruit糖酸比
Sugar-acid
ratio固酸比
Solids-acid
ratio可食率/%
Edible part
rate含水量/%
Moisture
content平均值
Average25.02 15.54 0.20 40.44 87.33 141.79 30.54 78.12 标准差
Standard
deviation3.00 1.73 0.06 6.99 29.86 49.22 4.45 2.48 最大值
Maximum29.15 18.54 0.31 52.76 129.49 198.46 38.99 82.23 最小值
Minimum20.00 12.88 0.13 33.41 45.19 66.98 23.63 73.93 变异系数/%
Coefficient of
variation12.01 11.12 32.23 17.27 34.19 34.71 14.57 3.17 Table 2. Internal quality index of fruit
-
表3表明,与榴莲内在品质指标相比,果实的矿质元素含量差异较大,在所测元素中P含量的变异系数最小,Zn含量的变异系数最大,变异系数分别为7.34%与43.88%。大中量元素中,K含量最高,变异系数为20.79%;N、S、Mg、Ca含量次之,P含量最低。微量元素中,以Fe含量最高,变异系数为16.67%;而Mn和B含量居中,变异系数分别为39.12%与25.13%。矿质元素中大中量元素含量由大到小排序为K > N > Mg > Ca > P > S;微量元素含量由大到小排序为Fe > Mn > B > Cu > Zn。
指标
Index矿质元素含量Mineral element/(g·Kg−1) N P K Ca Mg S Fe Mn Cu Zn B 平均值Average 4.21 1.52 16.98 2.24 2.40 1.13 66.52 18.23 10.30 5.14 17.36 标准差Standard deviation 0.86 0.11 3.53 0.27 0.36 0.22 11.09 7.13 1.69 2.25 4.36 最大值Maximum 5.70 1.66 22.23 2.66 2.87 1.42 78.26 30.59 13.94 8.25 24.96 最小值Minimum 3.19 1.32 10.98 1.87 1.67 0.86 45.21 8.81 8.15 1.72 10.70 变异系数Coefficient of variation/% 20.37 7.34 20.79 12.04 15.10 19.31 16.67 39.12 16.39 43.88 25.13 Table 3. Contents of mineral elements in fruit
-
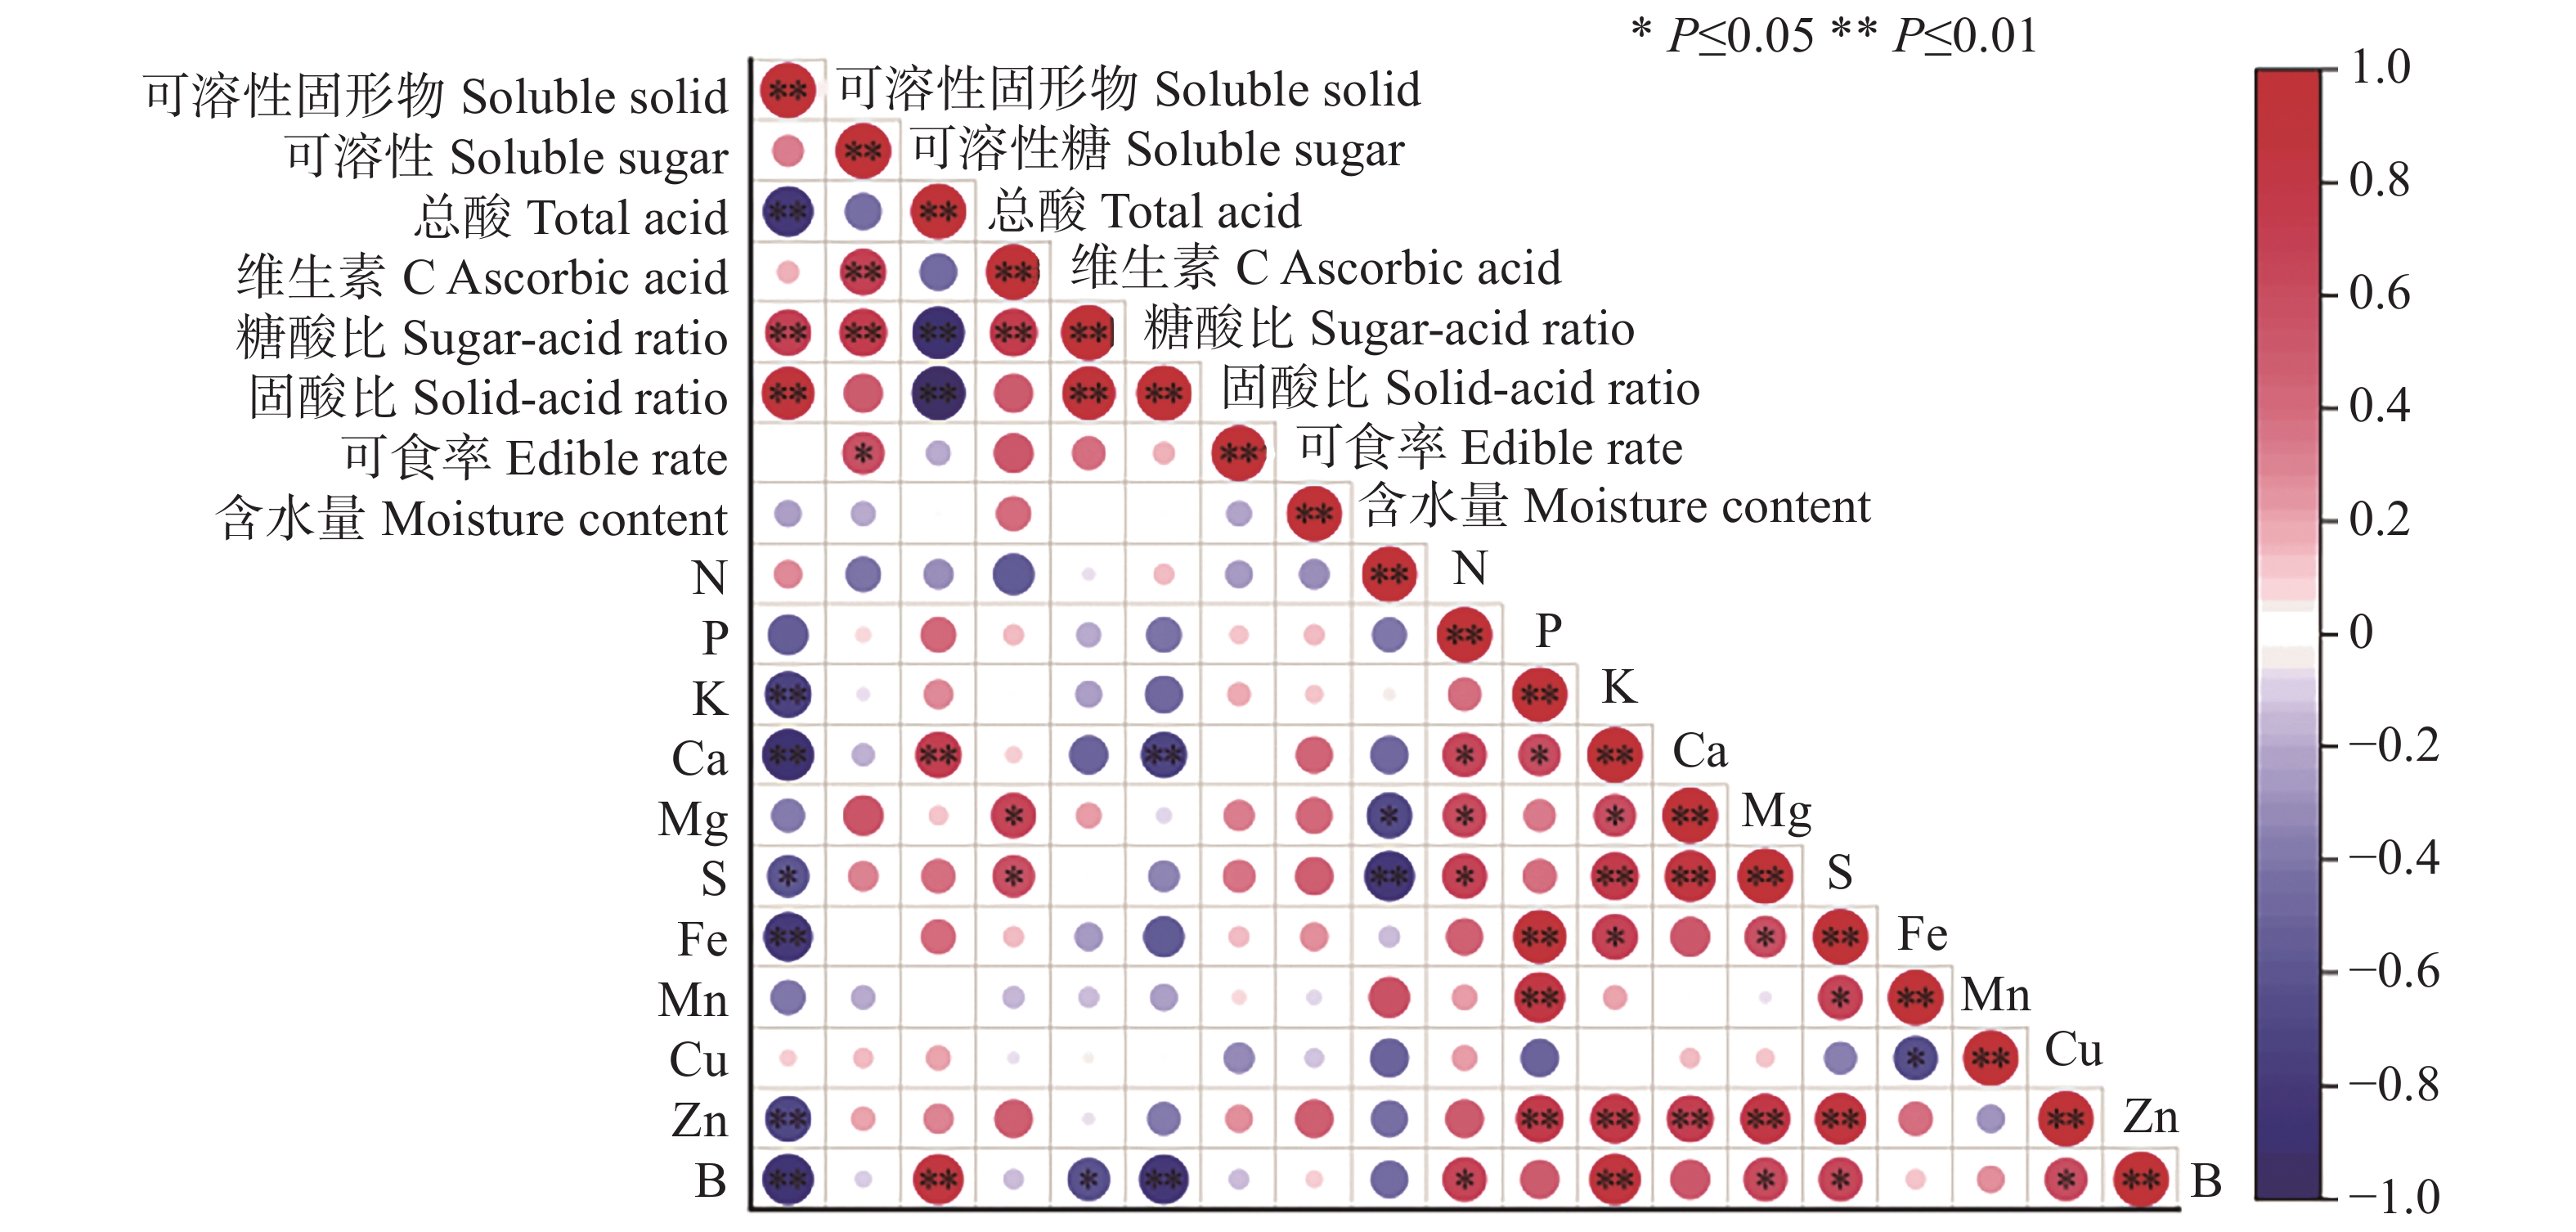
矿质元素含量与果实指标之间的相关性分析结果(图1)表明,可溶性固形物与K、Ca、Fe、Zn、B及S呈显著负相关;总酸与Ca、B呈极显著正相关;Vc与Mg、S呈显著正相关;糖酸比与B呈显著负相关。由此可知,不同矿质元素对果实内在品质存在一定的影响。
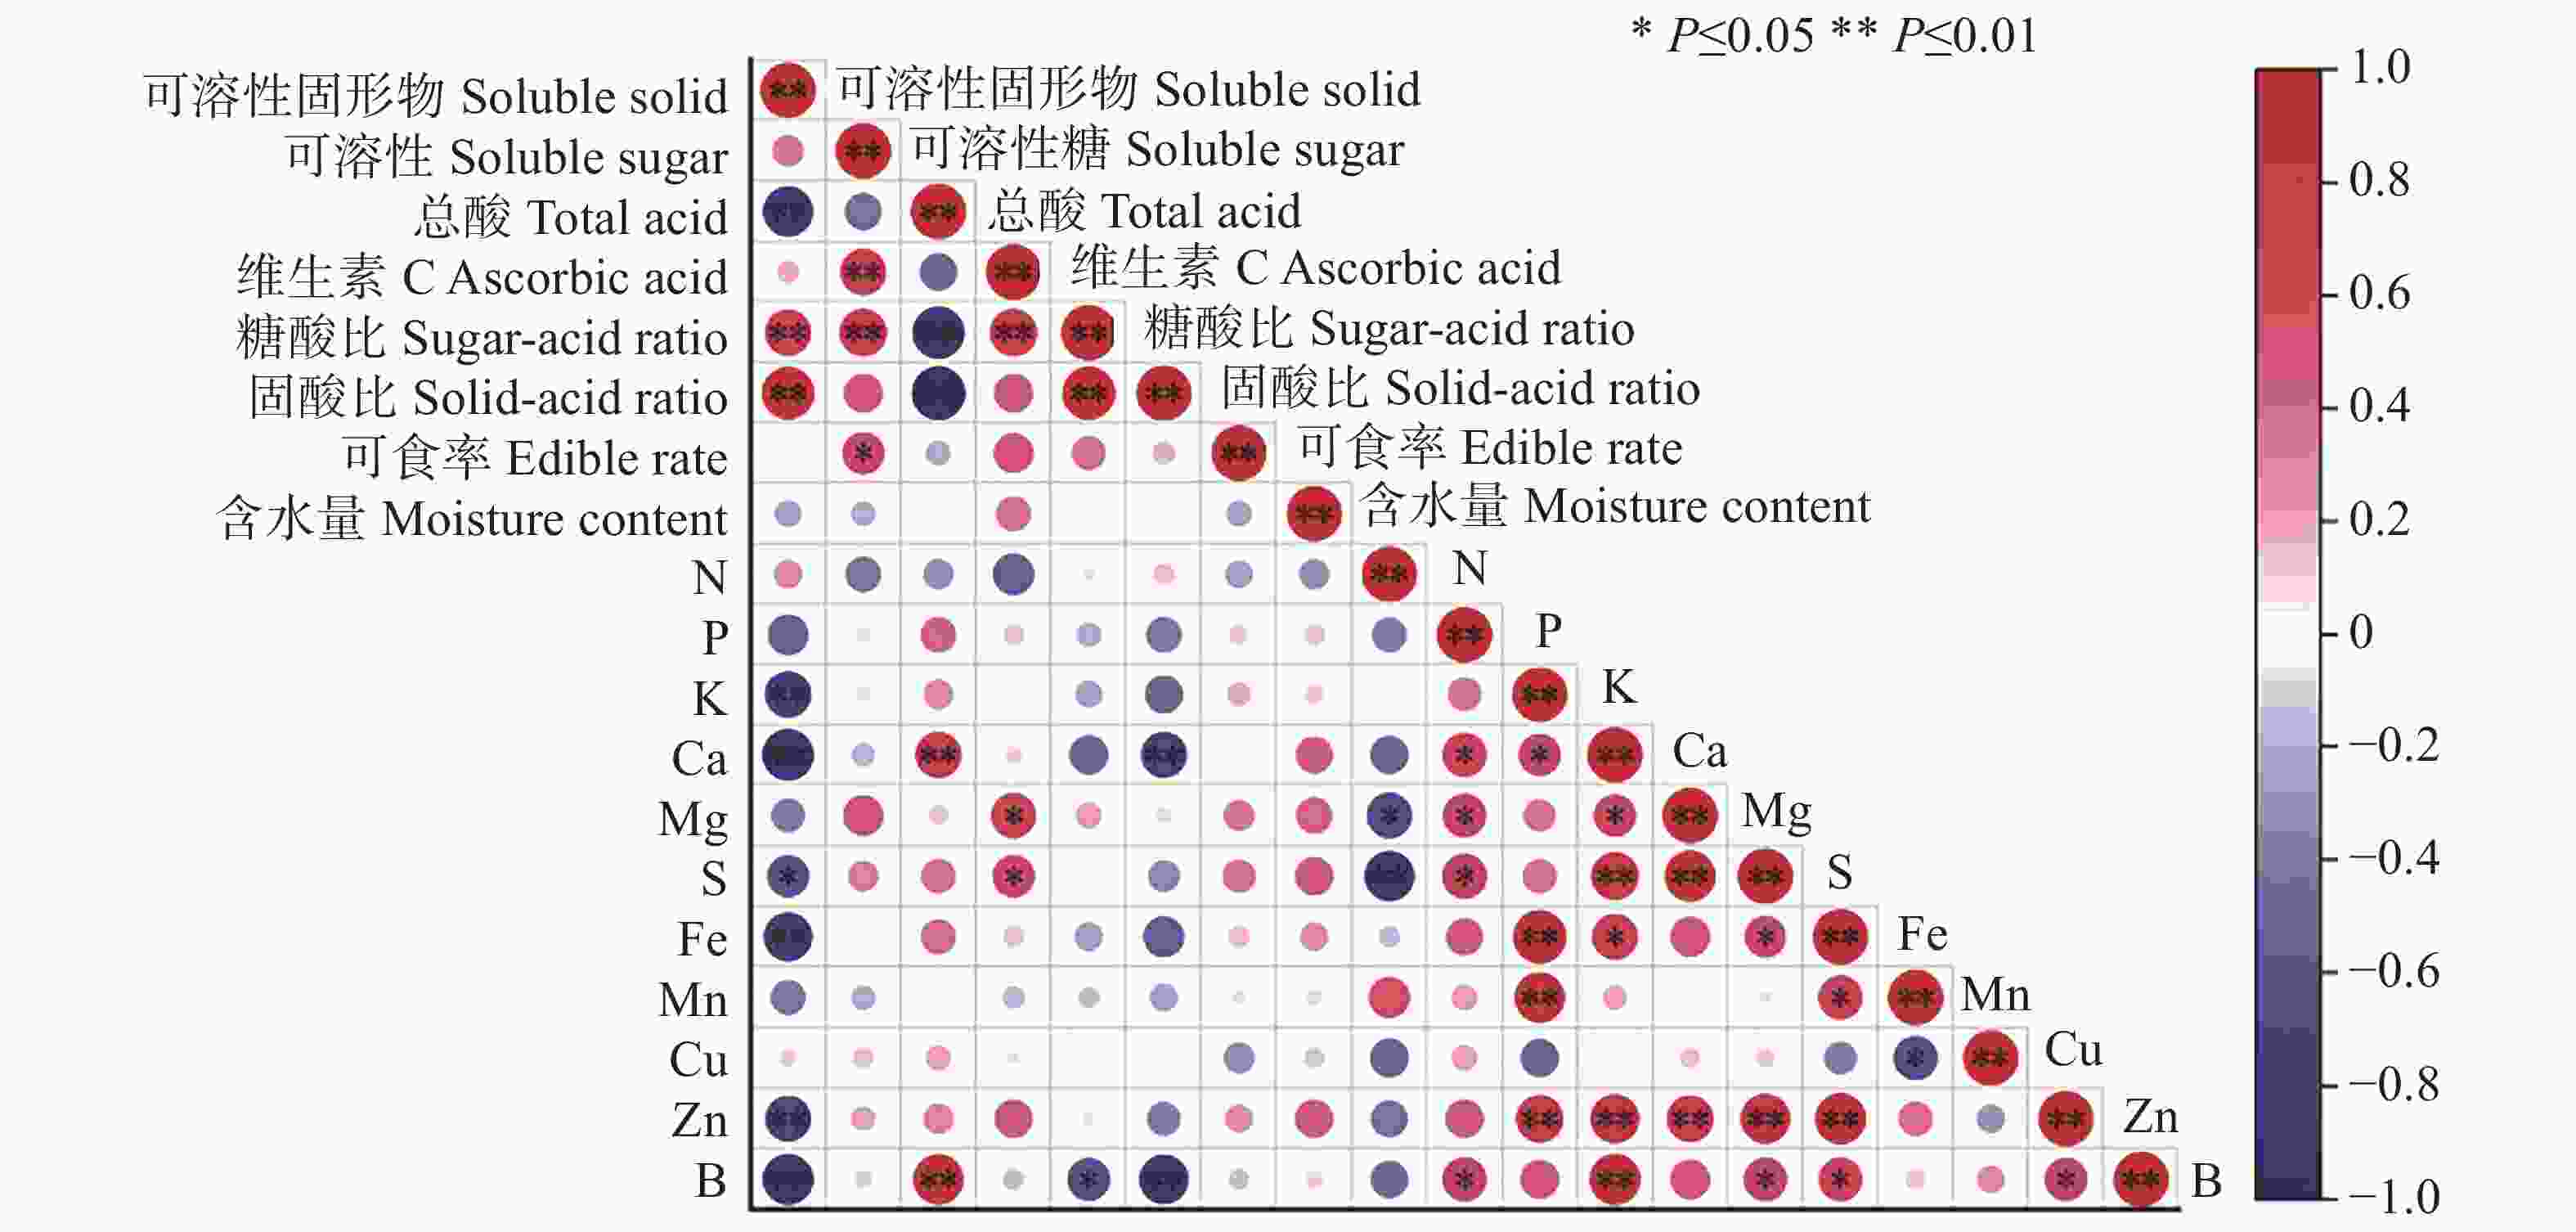
Figure 1. Correlation analysis between fruit mineral elements and internal quality indexes
-
果实矿质元素与可溶性固形物的通径分析结果(表4)表明,对可溶性固形物的主要影响因子有K、N、P、Ca、Mg、S、Fe、Mn、Cu、Zn、B。对果实可溶性固形物含量直接作用的最大影响因子为Mg(0.686),各元素对可溶性固形物影响的大小依次排序为Mg(0.686) > Zn(0.625) > Fe(0.548) > K(−0.502) > Ca(−0.473) > S(0.299) > B(−0.162) > Cu(−0.134) > N(−0.081) > P(−0.015) > Mn(0.003)。其中,Mg、S、Mn和Zn对可溶性固形物的影响为正值:K、N、P、Ca、Fe、Cu和B对可溶性固形物的影响为负值。间接通径系数表明,对果实可溶性固形物间接影响最大因子为Mn(−0.541),其次为N(−0.518)和Ca(0.442),P和B的间接通径系数较小。由此表明,对果实可溶性固形物影响较大的为N、Mg、Zn和Mn。
作用因子
Contribution
factors直接通
径系数
Direct path
coefficient间接通径系数 Indirect path coefficient 通过K
Through
K通过N
Through
N通过P
Through
P通过Ca
Through
Ca通过Mg
Through
Mg通过S
Through
S通过Fe
Through
Fe通Mn
Through
Mn通过Cu
Through
Cu通过Zn
Through
Zn通过B
Through
B总计
TotalK −0.502 −0.007 −0.004 −0.243 0.330 0.119 −0.484 0.002 0.064 0.464 −0.082 0.159 N −0.081 −0.041 0.005 0.235 −0.421 −0.234 0.068 0.002 0.055 −0.255 0.068 −0.518 P −0.015 −0.141 0.025 −0.278 0.291 0.141 −0.204 0.000 −0.018 0.266 −0.073 0.010 Ca −0.473 −0.258 0.040 −0.009 0.426 0.214 −0.278 0.000 0.004 0.420 −0.118 0.442 Mg 0.686 −0.241 0.050 −0.006 −0.294 0.256 −0.334 0.000 −0.007 0.481 −0.084 −0.180 S 0.299 −0.200 0.063 −0.007 −0.339 0.587 −0.309 0.000 −0.019 0.491 −0.101 0.166 Fe −0.548 −0.444 0.010 −0.006 −0.240 0.418 0.168 0.002 0.039 0.529 −0.100 0.377 Mn 0.003 −0.408 −0.043 −0.002 −0.053 0.039 −0.018 −0.344 0.081 0.229 −0.022 −0.541 Cu −0.134 0.239 0.033 −0.002 0.014 0.036 0.042 0.161 −0.002 −0.161 −0.040 0.320 Zn 0.625 −0.372 0.033 −0.006 −0.318 0.528 0.235 −0.464 0.001 0.034 −0.096 −0.425 B −0.162 −0.254 0.034 −0.007 −0.344 0.355 0.187 −0.339 0.000 −0.033 0.371 −0.030 Table 4. Path analysis of fruit mineral elements and soluble solids content
由表5可知,果实矿质元素与可溶性糖含量的直接通径系数由大到小为B(−0.683) > Mn(−0.621) > Zn(0.370) > Mg(−0.260) > Fe(−0.257) > N(0.183) > K(0.126) > P(−0.114) > Cu(0.105) > S(0.097) > Ca(0.079)。其中,K、N、Ca、S、Cu、Zn对可溶性糖的直接贡献为正值;P、Mg、Fe、Mn、B对可溶性糖的直接贡献为负值。Zn对果实可溶性糖的间接影响最大为(−1.257)且影响作用为负值,其次为 N(−0.711)。P和S对果实可溶性糖的间接影响也比较大,为P(−0.538)和S(−0.537)。Mn和B对可溶性糖间接通径系数比较小。K、Mg、Fe和Cu居中。因此,对果实可溶性糖影响较大的矿质元素为B、Mn、Zn、N。
作用因子
Contribution
factors直接通
径系数
Direct path
coefficient间接通径系数 Indirect path
coefficient通过K
Through
K通过N
Through
N通过P
Through
P通过Ca
Through
Ca通过Mg
Through
Mg通过S
Through
S通过Fe
Through
Fe通过Mn
Through
Mn通过Cu
Through
Cu通过Zn
Through
Zn通过B
Through
B总计
TotalK 0.126 0.015 −0.032 0.041 −0.126 0.039 −0.227 −0.504 −0.050 0.275 0.288 −0.283 N 0.183 0.010 0.035 −0.039 0.161 −0.076 0.032 −0.332 −0.043 −0.151 −0.307 −0.711 P −0.114 0.035 −0.056 0.046 −0.111 0.046 −0.096 −0.077 0.014 0.157 −0.497 −0.538 Ca 0.079 0.065 −0.091 −0.067 −0.163 0.069 −0.131 −0.069 −0.003 0.249 −0.353 −0.493 Mg −0.262 0.061 −0.112 −0.048 0.049 0.083 −0.157 −0.035 0.005 0.285 −0.426 −0.296 S 0.097 0.050 −0.143 −0.054 0.057 −0.224 −0.145 0.038 0.015 0.291 −0.422 −0.537 Fe −0.257 0.111 −0.023 −0.042 0.040 −0.160 0.055 −0.389 −0.031 0.313 −0.094 −0.220 Mn −0.621 0.102 0.098 −0.014 0.009 −0.015 −0.006 −0.161 −0.063 0.136 −0.168 −0.082 Cu 0.105 −0.060 −0.076 −0.015 −0.002 −0.014 0.014 0.075 0.373 −0.095 −0.405 −0.205 Zn 0.370 0.093 −0.075 −0.048 0.053 −0.201 0.076 −0.217 −0.228 −0.027 −0.683 −1.257 B −0.683 0.064 −0.077 −0.051 0.057 −0.135 0.061 −0.159 −0.086 0.026 0.219 −0.081 Table 5. Path analysis of fruit mineral elements and soluble sugar content
果实矿质元素与总酸含量的通径分析表明(表6),各矿质元素对果实总酸含量的直接通径系数由大到小依次为Mg(−0.476) > K(0.461) > Zn(−0.277) > Fe(0.271) > Mn(0.271) > B(0.157) > Cu(−0.156) > N(0.089) > S(−0.042) > Ca(0.036) > P(0.010)。其中,K、N、P、Ca、Fe、Mn和B对总酸的间接作用为正值;Mg、S、Cu和Zn对总酸的间接作用为负值。Mn元素对总酸含量间接作用影响最大,其次为N、Cu和Zn,P、Ca和B元素对总酸含量的间接通径系数影响较小。由此可知,对总酸含量影响较大的是K、N、Mg和Zn。
作用因子
Contribution
factors
直接通
径系数
Direct path coefficient
间接通径系数 Indirect path coefficient 通过K
Through
K通过N
Through
N通过P
Through
P通过Ca
Through
Ca通过Mg
Through
Mg通过S
Through
S通过Fe
Through
Fe通过Mn
Through Mn通过Cu
Through
Cu通过Zn
Through
Zn通过B
Through
B总计
TotalK 0.461 0.007 0.003 0.018 −0.229 −0.017 0.240 0.220 0.074 −0.206 0.079 0.191 N 0.089 0.037 −0.003 −0.018 0.292 0.033 −0.034 0.145 0.064 0.113 −0.066 0.564 P 0.010 0.129 −0.027 0.021 −0.202 −0.020 0.101 0.034 −0.021 −0.118 0.071 −0.032 Ca 0.036 0.236 −0.044 0.006 −0.296 −0.030 0.138 0.030 0.005 −0.186 0.114 −0.027 Mg −0.476 0.222 −0.055 0.004 0.022 −0.036 0.165 0.015 −0.008 −0.213 0.081 0.199 S −0.042 0.184 −0.070 0.005 0.026 −0.407 0.153 −0.017 −0.022 −0.218 0.098 −0.268 Fe 0.271 0.408 −0.011 0.004 0.018 −0.290 −0.024 0.170 0.046 −0.234 0.097 0.183 Mn 0.271 0.374 0.048 0.001 0.004 −0.027 0.003 0.170 0.094 −0.102 0.022 0.586 Cu −0.156 −0.219 −0.037 0.001 −0.001 −0.025 −0.006 −0.079 −0.163 0.071 0.039 −0.419 Zn −0.277 0.342 −0.036 0.004 0.024 −0.366 −0.033 0.229 0.099 0.040 0.093 0.397 B 0.157 0.233 −0.037 0.005 0.026 −0.246 −0.026 0.167 0.037 −0.038 −0.164 −0.044 Table 6. Path analysis of mineral elements and total acid content in fruit
果实矿质元素与维生素C含量的通径分析结果(表7)表明,各矿质元素对维生素C含量直接影响的大小顺序为S(−0.553) > Fe(−0.403) > Mg(0.379) > Cu(0.359) > K(−0.348) > B(−0.150) > Zn(0.127) > N(0.095) > Mn(0.084) > Ca(−0.062) > P(0.048)。其中,N、P、Mg、Mn、Cu、Zn对维生素C含量的影响为正值;K、Ca、S、Fe、B对维生素C含量的影响为负值。Zn对维生素C含量的间接贡献影响最大,其间接通径系数为−0.953,其次为Mg(−0.919)和Mn(−0.620)。S和Cu对果实维生素C的间接通径系数比较小。因此,S、Fe、Mg和Zn对果实维生素C含量影响较大。
作用因子
Contribution
factors直接通
径系数
Direct path
coefficient间接通径系数 Indirect path coefficient 通过K
Through
K通过N
Through
N通过P
Through
P通过Ca
Through
Ca通过Mg
Through
Mg通过S
Through
S通过Fe
Through
Fe通过Mn
Through
Mn通过Cu
Through
Cu通过Zn
Through
Zn通过B
Through
B总计
TotalK −0.348 0.008 0.013 −0.032 0.182 −0.221 −0.356 0.068 −0.171 0.094 −0.076 −0.490 N 0.095 −0.028 −0.015 0.031 −0.233 0.432 0.050 0.045 −0.148 −0.052 0.063 0.145 P 0.048 −0.097 −0.029 −0.036 0.161 −0.261 −0.150 0.010 0.048 0.054 −0.068 −0.369 Ca −0.062 −0.179 −0.047 0.028 0.235 −0.396 −0.205 0.009 −0.011 0.085 −0.109 −0.588 Mg 0.379 −0.167 −0.058 0.020 −0.039 −0.473 −0.246 0.005 0.019 0.098 −0.078 −0.919 S −0.553 −0.139 −0.074 0.023 −0.044 0.324 −0.227 −0.005 0.050 0.100 −0.094 −0.086 Fe −0.403 −0.308 −0.012 0.018 −0.031 0.231 −0.311 0.053 −0.105 0.107 −0.093 −0.451 Mn 0.084 −0.283 0.051 0.006 −0.007 0.022 0.034 −0.253 −0.216 0.047 −0.021 −0.620 Cu 0.359 0.166 −0.039 0.006 0.002 0.020 −0.077 0.118 −0.050 −0.033 −0.037 0.075 Zn 0.127 −0.258 −0.039 0.020 −0.042 0.291 −0.435 −0.341 0.031 −0.092 −0.089 −0.953 B −0.150 −0.176 −0.040 0.022 −0.045 0.196 −0.345 −0.249 0.012 0.088 0.075 −0.463 Table 7. Path analysis of mineral elements and vitamin C content in fruit
果实矿质元素与糖酸比的直接通径系数(表8)由大到小顺序为B(−0.426) > Zn(0.419) > Mg(0.372) > Fe(−0.368) > K(−0.344) > Cu(0.305) > Mn(−0.265) > S(−0.164) > N(−0.030) > Ca(−0.018) > P(0.004)。其中,P、Mg、Cu、Zn对可溶性糖的直接贡献为正值;K、N、Ca、S、Fe、Mn、B对糖酸比的直接贡献为负值。矿质元素Zn对糖酸比的间接影响最大(−0.836),其次为Mn(−0.585)、K(−0.487)且影响作用为负值。P、S、B对糖酸比的间接通径系数较小,为P(−0.160)、S(0.108)、B(−0.023)。因此,对榴莲果实糖酸比影响较大的为Zn、Mn、B和K。
作用因子
Contribution
factors直接通
径系数
Direct path
coefficient间接通径系数 Indirect path coefficient 通过K
Through
K通过N
Through
N通过P
Through
P通过Ca
Through
Ca通过Mg
Through
Mg通过S
Through
S通过Fe
Through
Fe通过Mn
Through
Mn通过Cu
Through
Cu通过Zn
Through
Zn通过B
Through
B总计
TotalK −0.344 −0.002 0.001 −0.009 0.179 −0.065 −0.325 −0.215 −0.145 0.311 −0.216 −0.487 N −0.030 −0.028 −0.001 0.009 −0.228 0.128 0.046 −0.142 −0.126 −0.171 0.179 −0.334 P 0.004 −0.096 0.009 −0.011 0.158 −0.077 −0.137 −0.033 0.041 0.178 −0.192 −0.160 Ca −0.018 −0.176 0.015 0.002 0.231 −0.117 −0.187 −0.029 −0.009 0.282 −0.310 −0.299 Mg 0.372 −0.165 0.018 0.002 −0.011 −0.140 −0.224 −0.015 0.016 0.322 −0.220 −0.419 S −0.164 −0.137 0.023 0.002 −0.013 0.318 −0.207 0.016 0.043 0.329 −0.266 0.108 Fe −0.368 −0.304 0.004 0.001 −0.009 0.227 −0.092 −0.166 −0.089 0.354 −0.263 −0.338 Mn −0.265 −0.279 −0.016 0.000 −0.002 0.021 0.010 −0.231 −0.183 0.154 −0.059 −0.585 Cu 0.305 0.164 0.012 0.001 0.001 0.019 −0.023 0.108 0.159 −0.108 −0.105 0.228 Zn 0.419 −0.255 0.012 0.002 −0.012 0.286 −0.129 −0.311 −0.097 −0.078 −0.253 −0.836 B −0.426 −0.174 0.013 0.002 −0.013 0.192 −0.102 −0.227 −0.037 0.075 0.248 −0.023 Table 8. Path analysis of fruit mineral elements and sugar-acid ratio
果实矿质元素与固酸比含量的通径分析表明(表9),各矿质元素对果实固酸比的直接通径系数按大小排序为Mg(0.653) > Zn(0.517) > Fe(−0.512) > K(−0.390) > Ca(−0.268) > B(−0.266) > Cu(0.190) > N(−0.136) > Mn(−0.102) > S(−0.074) > P(0.441)。其中,P、Mg、Cu和Zn对固酸比的影响为正值;K、N、Ca、S、Fe、Mn、和B对固酸比的影响为负值。各矿质元素对固酸比间接作用影响由大到小为Mn(−0.655) > Zn(−0.630) > N(−0.423) > Mg(−0.365) > S(0.321) > Cu(0.292) > K(−0.229) > Ca(0.121) > Fe(0.061) > P(−0.061) > B(−0.002)。由此可知,对固酸比含量影响较大的是Mg、Zn、Fe、Mn。
作用因子
Contribution
factors直接通
径系数
Direct path
coefficient间接通径系数 Indirect path coefficient 通过K
Through
K通过N
Through
N通过P
Through
P通过Ca
Through
Ca通过Mg
Through
Mg通过S
Through
S通过Fe
Through
Fe通过Mn
Through
Mn通过Cu
Through
Cu通过Zn
Through
Zn通过B
Through
B总计
TotalK −0.390 −0.011 0.011 −0.137 0.314 −0.030 −0.453 −0.083 −0.090 0.384 −0.135 −0.229 N −0.136 −0.032 −0.013 0.133 −0.401 0.058 0.063 −0.055 −0.078 −0.211 0.112 −0.423 P 0.041 −0.109 0.042 −0.157 0.277 −0.035 −0.190 −0.013 0.025 0.220 −0.120 −0.061 Ca −0.268 −0.200 0.067 0.024 0.406 −0.053 −0.260 −0.011 −0.006 0.347 −0.193 0.121 Mg 0.653 −0.188 0.084 0.017 −0.166 −0.063 −0.312 −0.006 0.010 0.398 −0.138 −0.365 S −0.074 −0.156 0.106 0.019 −0.192 0.558 −0.288 0.006 0.027 0.406 −0.166 0.321 Fe −0.512 −0.345 0.017 0.015 −0.136 0.398 −0.042 −0.064 −0.056 0.437 −0.164 0.061 Mn −0.102 −0.317 −0.073 0.005 −0.030 0.037 0.005 −0.321 −0.114 0.190 −0.037 −0.655 Cu 0.190 0.186 0.056 0.005 0.008 0.034 −0.010 0.150 0.061 −0.133 −0.065 0.292 Zn 0.517 −0.289 0.055 0.017 −0.180 0.502 −0.058 −0.433 −0.037 −0.049 −0.158 −0.630 B −0.266 −0.197 0.057 0.018 −0.195 0.338 −0.046 −0.316 −0.014 0.047 0.307 −0.002 Table 9. Path analysis of fruit mineral elements and solid acid ratio
-
从榴莲果实的外在形态和内在品质分析表明,不同地方果园的果实品质和矿质养分存在一定的差异,原因可能是土壤条件、树体差异、施肥管理及栽培技术等的不一致,导致呈现的结果差异较大[29-30]。本研究结果表明,果实外在形态中果实密度的变异系数最小,种子个数变异系数最大;内在品质中变异系数最大的是固酸比,这与在冰糖橙[30]及苹果[31]上的研究结果一致。糖酸是构成果实风味的重要物质。固酸比变异系数大是因为部分化合物与有机酸含量在果实中的积累不同。在所测元素中P的变异系数最小,Zn的变异系数最大,这与王贵等[32]对莱阳梨果实研究的结果一致。本研究发现榴莲果实K含量最高,这与陈艳秋等[33]在苹果梨及谭梦怡等[34]在火龙果的研究结果一致。榴莲果实品质和矿质养分的差异涉及多方面的因素,分析其内在关系,找出重要矿质因子,可为榴莲果实的优质生产提供有力支撑。
相关性研究结果表明,果实的矿质元素与果实品质指标存在一定的关系。可溶性固形物与K、Ca、Fe、Zn、B呈极显著负相关,这与冯建文等[35]在苹果上的研究结果一致,这与宋少华等[36]在甜柿上的研究结果却相反,说明不同果实矿质元素呈现的作用不同。相关研究表明,杨梅[37]果实中Ca与可溶性固形物亦呈极显著负相关,这与本研究结果一致,可能是外源钙抑制了果实乙烯的释放[38],从而抑制了糖类物质的合成。总酸与Ca、B呈极显著正相关,这与位杰等[39]在香梨研究中,以及李智峰等[40]在苹果上的研究结果一致,Ca、B等元素可能会使总酸中部分有机酸结合,从而导致酸度升高,硼可能促进糖分的合成,同时影响有机酸的积累,从而改变糖分与酸的比例。相关研究表明,金煌芒果实[41]中Vc含量与Mg含量呈显著正相关,这与本研究结果一致,说明Mg元素对维生素C含量具有较大的正向作用,镁是叶绿素的关键组成部分,促进光合作用有助于维生素C的合成[42]。果实的生长发育与品质的形成是各矿质元素协同作用的结果。
通径系数的绝对值大小能直接反映矿质元素对果实品质的影响,直接通径系数显示直接作用大小,间接通径系数则表示通过其他元素间接影响的程度。通径分析研究结果表明,果实各矿质元素对品质指标的影响存在一定差异,其中对可溶性固形物主要受N、Mg、Zn、Mn影响;对可溶性糖含量主要受B、Mn、Zn、N影响;对果实总酸含量主要受K、N、Mg、Zn影响;对维生素C含量主要受S、Fe、Mg、Zn影响;对糖酸比主要受K、Zn、Mn、B影响;对固酸比主要受Mg、Zn、Fe、Mn影响。综上所述,K、N、Ca、Mg、Zn、B等元素为影响榴莲果实品质的主要元素。相关研究表明,影响可溶性物较大的元素为Mg,与本研究结果一致。周丹蓉等[43]在研究芙蓉李果实矿质元素对品质影响的直接作用及与其他元素的间接作用,影响总酸的矿质元素主要为Mn,影响可溶性糖矿质元素为Zn,而朱振忠等[44]研究结果认为Ca为影响总酸的主要矿质元素。影响金煌芒果[42]维生素C含量为B,而Cu对葡萄[21]的维生素C含量的影响较大,与本研究结果存在一定差异,可能与品种不同、地域关系以及气候环境等均有关系。
-
综上结果表明,矿质元素对果实品质的影响由大到小为K > N > Mg > Ca > P > S > Fe > Mn > B > Cu > Zn;相关性分析中主要与Ca、Mg、B元素呈显著相关;通径分析表明K、N、Mg、Fe、Zn、B等元素为影响榴莲果实品质的主要元素,榴莲果实的生长发育和果实品质受多种矿质元素的共同作用。海南地区高温多雨,岩石风化作用和淋溶作用强烈,导致土壤镁含量较低,且大部分土壤对硼元素也较缺乏,加上矿质元素中Zn含量的变异系数较大,但土壤中Fe元素并不缺乏。结合海南本地土壤及果实养分含量,本团队建议在榴莲生产中可通过适当增施K、Mg、Zn、B肥,同时协调各元素之间的施肥比例,以实现优质果品的生产。此外,本试验选取金枕榴莲果实,不能完全代表榴莲植株及其他品种养分规律,需结合当地果园的土壤养分和施肥管理情况进一步探究。
Correlation and path analysis between mineral elements and quality of Jinzhen durian fruit
DOI: 10.15886/j.cnki.rdswxb.20240134
- Received Date: 2024-08-24
- Accepted Date: 2025-02-28
- Rev Recd Date: 2024-10-08
- Available Online: 2025-03-10
- Publish Date: 2026-03-25
-
Key words:
- Durio zibethinus Murr. /
- fertilizer application /
- mineral elements /
- quality /
- correlation analysis /
- path analysis
Abstract: In order to explore the effect of mineral nutrient elements on fruit quality and screen the main mineral element factors affecting fruit quality, fruit of durian (Durio zibethinus Murr.) Jinzhen planted in Hainan Province were selected for correlation and path coefficient analysis of the external morphology and internal quality indexes of the fruit as well as 11 mineral elements. The correlation analysis showed that there was a significantly negative correlation between soluble solids content and sulfur (S) content. The total acid content was significantly positively correlated with calcium (C) and boron (B) contents. There was a significantly positive correlation between vitamin C content and magnesium (Mg) and S contents. There was a significantly negative correlation between sugar-acid ratio and B content. The solid-acid ratio was significantly negatively correlated with Ca and B contents. The path analysis showed that there were some differences in the effects of mineral elements on fruit quality indexes. The main elements influencing soluble solids content were nitrogen (N), Mg, zinc (Zn) and manganese (Mn). The main factors influencing soluble sugar content were B, Mn, Zn and N, and the main elements affecting the total acid content of the fruit were potassium (K), N, Mg and Zn. The main elements affecting the content of vitamin C were S, iron (Fe), Mg and Zn. The main elements affecting the ratio of sugar to acid are K, Zn, Mn and B, and the main elements influencing solid acid ratio were Mg, Zn, Fe and Mn. In summary, K, N, Ca, Mg, Zn and B are the main elements affecting the quality of the durian fruit, and are the comprehensive results of the synergistic regulation of various mineral elements. Considering the local soil and fruit nutrient content in Hainan, the fruit yield and quality can be improved through application of K, Mg, Zn and B fertilizers at a slightly higher rate and a coordinated ratio.
| Citation: | Wang Yuanming, Xu Danyong, Wang Yuyang, Li Huadong, Zhou Junlei, Lin Dian. Correlation and path analysis between mineral elements and quality of Jinzhen durian fruit[J]. Journal of Tropical Biology, 2026, 17(2): 337-346. doi: 10.15886/j.cnki.rdswxb.20240134

|
 DownLoad: